
The Compendium of the Philippine Environment Statistics (CPES) is a compilation of environment and related socio-economic statistics collected from various government agencies. The CPES has six components, namely: 1) environmental conditions and quality; 2) environmental resources and their use;
The first component of the Compendium covers statistics on the physical, biological, and chemical characteristics of the environment and their changes over time. This component has three subcomponents: physical conditions; land cover, ecosystems, and biodiversity; and environmental quality.
Subcomponent 1.1: Physical Conditions
The Physical Conditions focuses on statistics on the meteorological, hydrographical, geological, and geographical conditions, and soil characteristics.
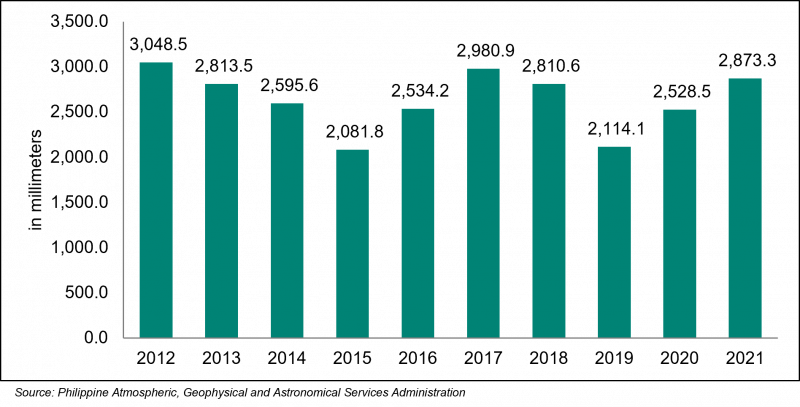
Over the period 2012 to 2021, the annual average amount of rainfall fluctuated. The highest amount of rainfall was reported in 2012 at
Figure 1. Annual Average Rainfall, 2012 to 2021 (in millimeters)
Subcomponent 1.2: Land Cover, Ecosystems and Biodiversity
Land cover includes statistics on the extent, as well as the physical and spatial characteristics of land cover. Changes in land cover are the result of natural processes and changes in land use. Meanwhile, ecosystems and biodiversity cover information on the physical quantitative as well as qualitative information and statistics about a country’s main ecosystems, including the extent, chemical and physical characteristics, and biological components (biodiversity) of the ecosystems.
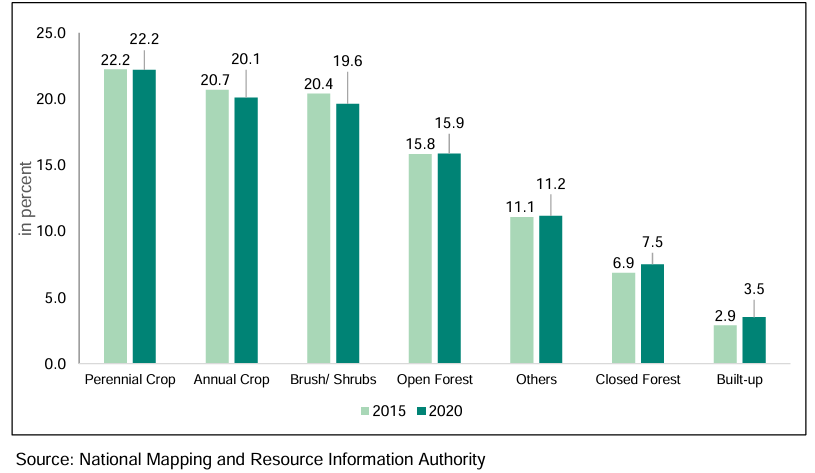
In 2015, closed forests comprised
Figure 2. Area Distribution of Land Cover by Type, 2015 and 2020 (in percent)
Subcomponent 1.3: Environmental Quality
Statistics on environmental quality are important in monitoring pollution impacts on the human sub-system and ecosystems. The concentration of air pollutants, suspended solid particles, and other gases are the statistics compiled in this subcomponent. Air quality is measured by monitoring stations which are located mostly near the major sources of pollution.
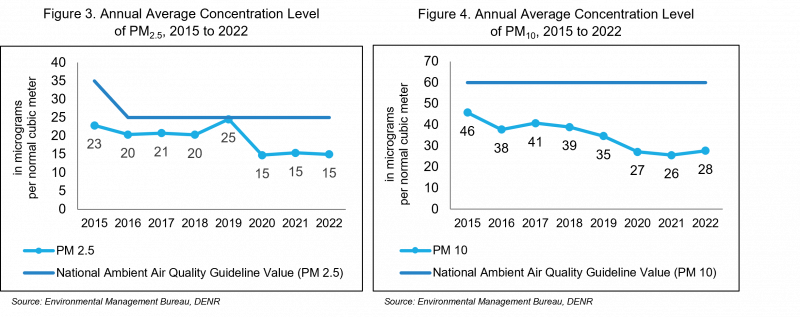
The National Ambient Air Quality Guideline Value (NAAQGV) for Particulate Matter (PM)2.5 was
From 2015 to 2022, the annual average PM10 concentration fell below the NAAQGV of 60 micrograms per normal cubic meter. (Table 1.22 and Figure 4)
Statistics on the concentration levels of PM2.5 and PM10 serve as inputs to Sustainable Development Goals (SDG) indicator 3.9.1 Mortality rate attributed to household and ambient air pollution and to SDG indicator 11.6.2 Annual mean levels of fine particulate matter in cities. These statistics are also included in the GSCCSI under the topic of Climate Change and Human Health.
The Compendium of Philippine Environment Statistics follows the United Nations Framework for the Development of Environment Statistics (FDES) 2013. Among the 141 statistics identified in the FDES, a total of 45 statistics were compiled for Component 1 for this edition of the Compendium.
These statistics are useful in compiling ecosystem condition accounts as described in the System of Environmental-Economic Accounting Ecosystem Accounting. These are also linked to the GSCCSI, particularly, on the thematic area of Impacts. In addition, 35 statistics out of the 49 statistics that were found in the global set across all thematic areas are included for this component.
1GSCCSI is a statistical framework created to support countries in preparing own sets of climate change statistics and indicators in accordance with specific concerns. It consists of five thematic areas: Drivers, Impacts, Vulnerability, Mitigation and Adaptation.
DIVINA GRACIA L. DEL PRADO, PhD
(Assistant National Statistician)
Officer-in-Charge, Deputy National Statistician
Sectoral Statistics Office