Highlights of the Philippine Export and Import Statistics February 2024 (Preliminary)
A. TOTAL EXTERNAL TRADE AND BALANCE OF TRADE
1. Total external trade increased by 9.7 percent
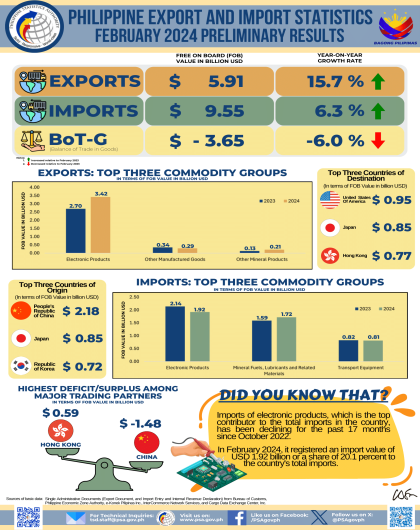
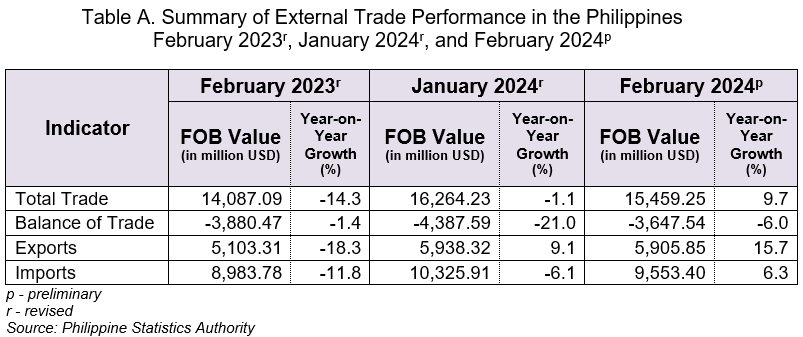
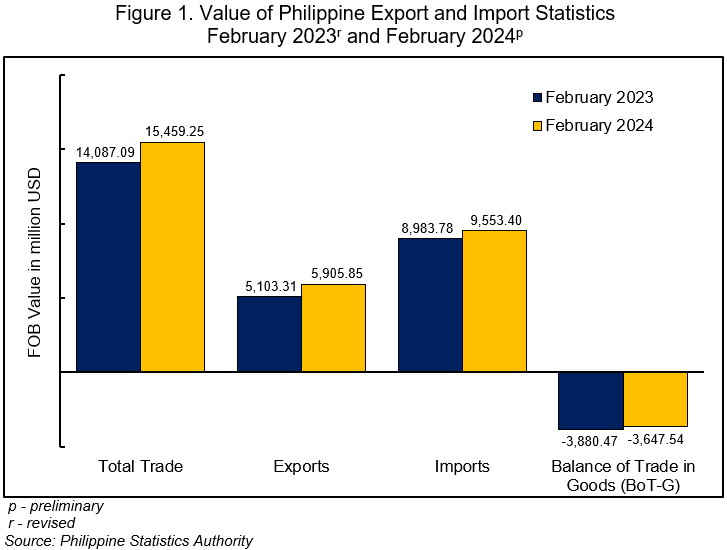
In February 2024, the country’s total external trade in goods amounted to USD 15.46 billion, which indicates an annual increase of 9.7 percent from the USD 14.09 billion total external trade in the same period of the previous year. In January 2024 and February 2023, total external trade in goods registered annual decreases of 1.1 percent and 14.3 percent, respectively. (Figure 1, and Tables A and 1)
Of the total external trade in February 2024, 61.8 percent were imported goods, while the remaining were exported goods.
2. Trade deficit posted an annual decrease
The balance of trade in goods (BoT-G) is the difference between the value of exports and imports. The BoT-G in February 2024 amounted to USD -3.65 billion, indicating a trade deficit with an annual decrease of 6.0 percent. In January 2024 and February 2023, the trade deficit recorded annual decrements of 21.0 percent and 1.4 percent, respectively. (Figure 1, and Tables A and 4)
B. EXPORTS
1. Sales from export posted a positive growth
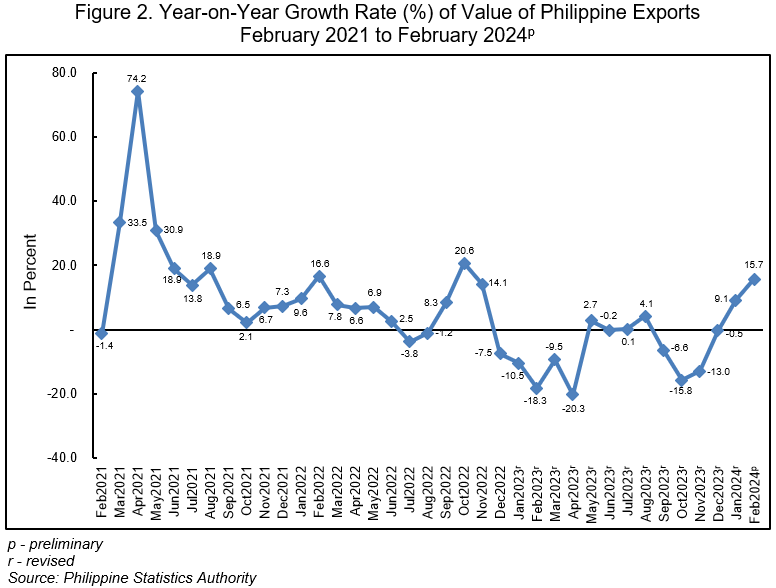
The country’s total export sales in February 2024 amounted to USD 5.91 billion, indicating an annual increase of 15.7 percent from the USD 5.10 billion total exports in the same month of the previous year. In January 2024, the total exports recorded an annual increase of 9.1 percent, while it posted an annual decline of 18.3 percent in February 2023. (Figures 1 and 2, and Tables A and 3)
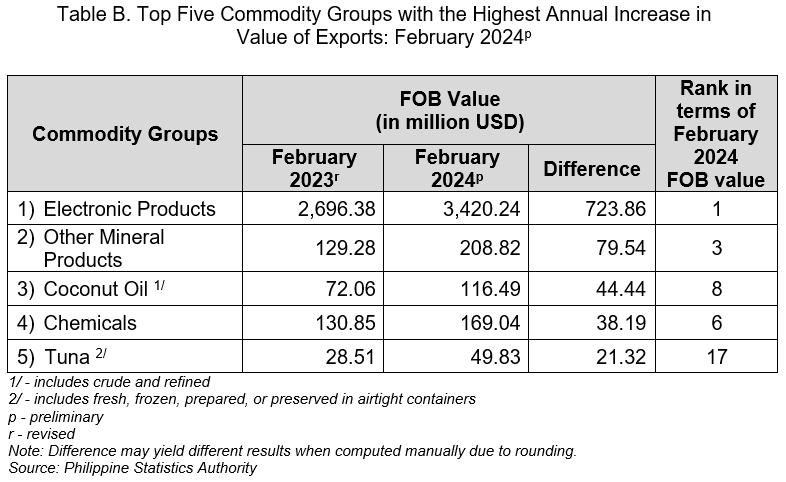
The commodity group with the highest annual increment in the value of exports in February 2024 was electronic products with USD 723.86 million. This was followed by other mineral products with an annual increase of USD 79.54 million, and coconut oil with an annual increment of USD 44.44 million. (Tables B and 5)
2. Year-to-date annual total exports increased
The year-to-date annual total value of exports, that is from January to February 2024, amounted to USD 11.84 billion. This represents an annual increase of 12.3 percent from the year-to-date annual total export value of USD 10.55 billion in January to February 2023. (Tables 3 and 6)
3. Electronic products commodity group remained the highest on export sales
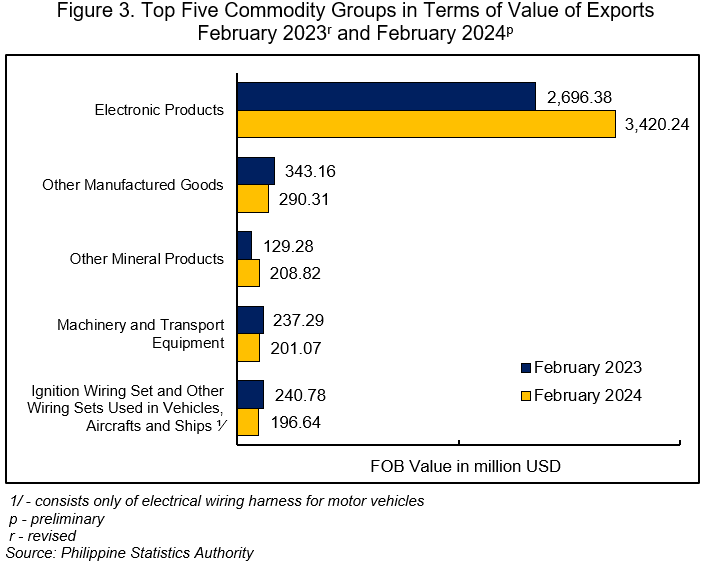
By commodity group, electronic products continued to be the country’s top exports in February 2024 with total earnings of USD 3.42 billion or 57.9 percent of the country’s total exports during the period. This was followed by other manufactured goods with an export value of USD 290.31 million (4.9%), and other mineral products with USD 208.82 million (3.5%). (Figure 3 and Table 5)
4. Manufactured goods still comprised the largest portion of total exports among major types of goods
By major type of goods, exports of manufactured goods contributed the largest to the country’s total exports in February 2024 amounting to USD 4.88 billion or a share of 82.7 percent. This was followed by mineral products with a share of USD 456.46 million (7.7%), and total agro-based products, which contributed USD 425.93 million (7.2%). (Figure 4 and Table 7)

5. United States of America (USA) contributed the highest to the total export value
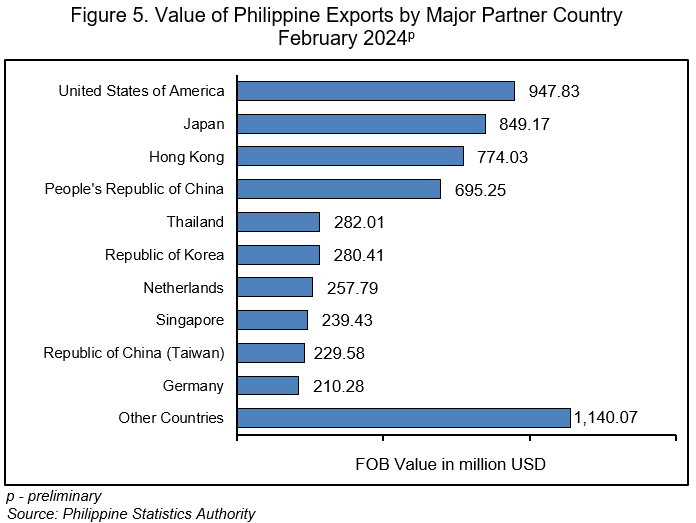
By major trading partner, exports to USA comprised the highest export value amounting to USD 947.83 million or a share of 16.0 percent to the country’s total exports in February 2024.
Completing the top five major export trading partners for this month with their export values and percent shares to the total exports were:
a. Japan, USD 849.17 million (14.4%);
b. Hong Kong, USD 774.03 million (13.1%);
c. People’s Republic of China, USD 695.25 million (11.8%); and
d. Thailand, USD 282.01 million (4.8%). (Figure 5 and Table 9)
6. Majority of exports were for Asia-Pacific Economic Cooperation (APEC) countries
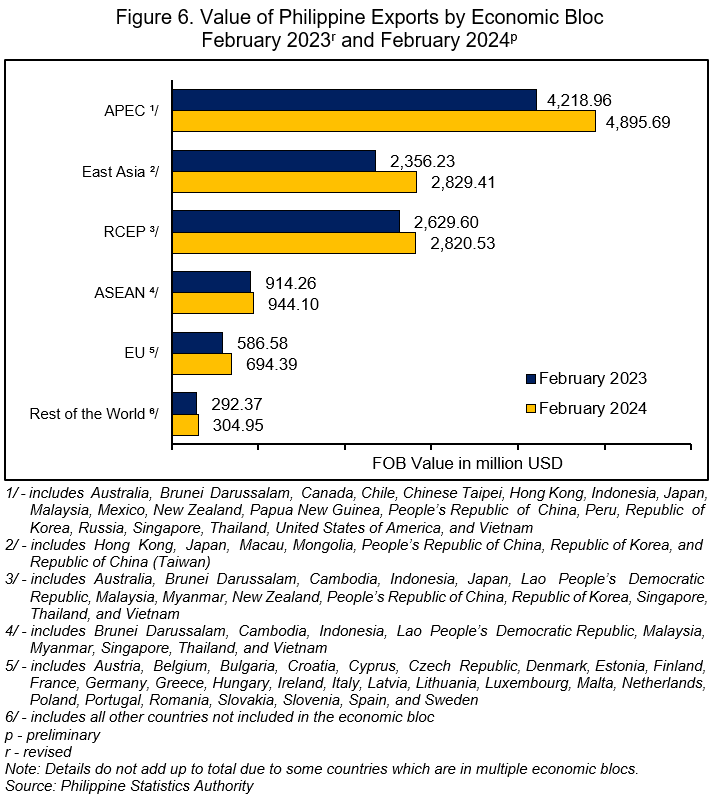
By economic bloc, majority of the country’s merchandise exports in February 2024 went to APEC countries with a share of USD 4.90 billion or 82.9 percent to the country’s total exports. This was followed by East Asia at USD 2.83 billion (47.9%), and Regional Comprehensive Economic Partnership (RCEP), valued at USD 2.82 billion (47.8%). (Figure 6, and Tables 10 and 18)
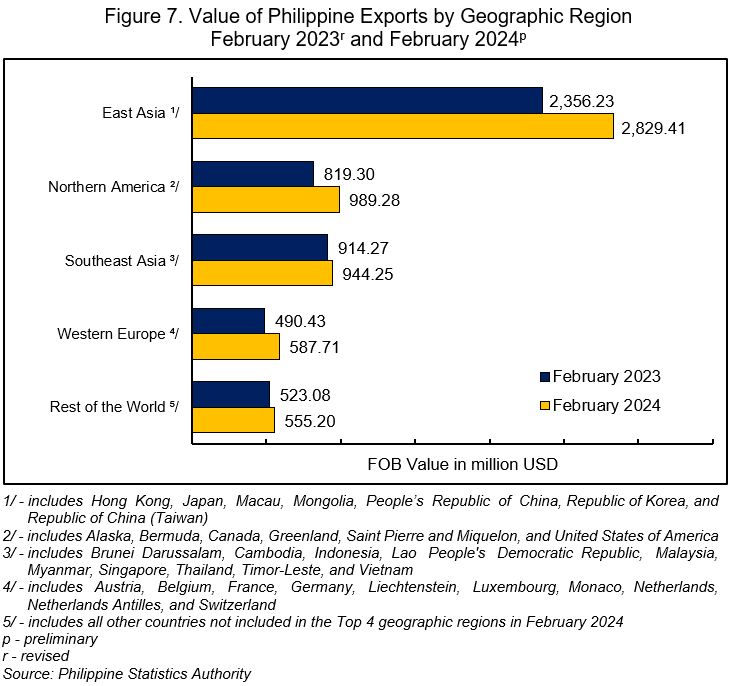
7. East Asia contributed the highest export value by geographic region
By geographic region, East Asia comprised the highest export value in February 2024 amounting to USD 2.83 billion (47.9%). This was followed by Northern America with an export value of USD 989.28 million (16.8%), and Southeast Asia with USD 944.25 million (16.0%) worth of exports. (Figure 7 and Table 19)
C. IMPORTS
1. Import value increased in February 2024
The total imported goods in February 2024 amounted to USD 9.55 billion, indicating an annual increase of 6.3 percent from the USD 8.98 billion import value in the same month of the previous year. In January 2024 and February 2023, import value recorded annual declines of 6.1 percent and 11.8 percent, respectively. (Figures 1 and 8, and Tables A and 2)

In February 2024, the commodity group with the highest annual increment in the value of imported goods was metalliferous ores and metal scrap with USD 219.59 million. This was followed by cereals and cereal preparations, which grew by USD 137.23 million, and mineral fuels, lubricants and related materials with an annual increase of USD 131.71 million. (Tables C and 11)

2. Year-to-date annual total import value decreased
The year-to-date annual total import value, that is from January to February 2024, amounted to USD 19.88 billion. This represents an annual decrement of 0.5 percent from the year-to-date annual total import value of USD 19.98 billion in January to February 2023. (Table 12)
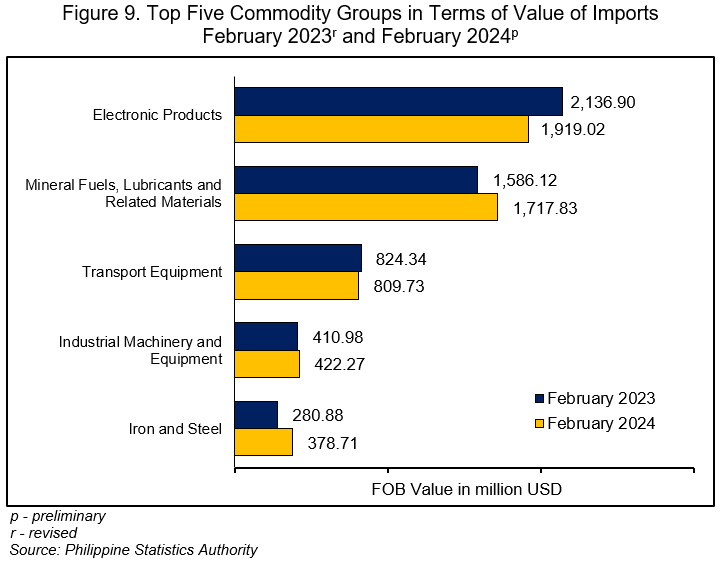
3. Electronic products recorded the highest import value among commodity groups
The commodity group with the highest import value in February 2024 was electronic products, which amounted to USD 1.92 billion or a share of 20.1 percent to the country’s total imports. This was followed by mineral fuels, lubricants and related materials at USD 1.72 billion (18.0%), and transport equipment at USD 809.73 million (8.5%). (Figure 9 and Table 11)
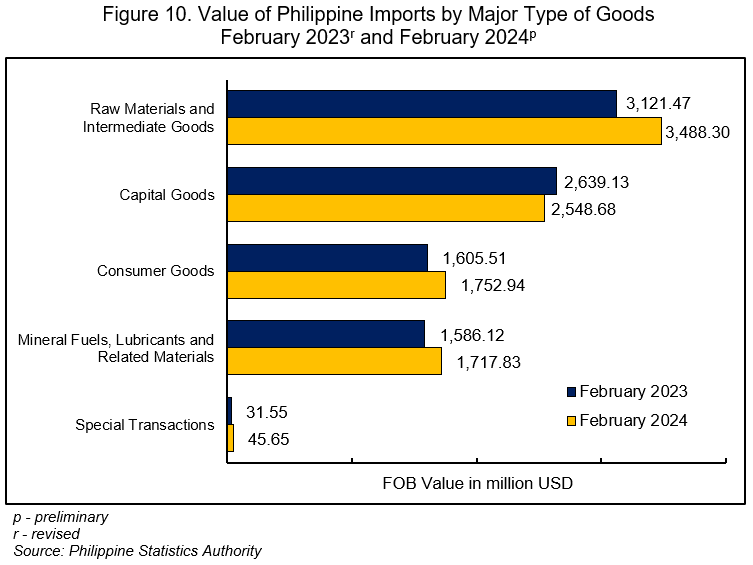
4. Imports of raw materials and intermediate goods contributed the highest among major types of goods
By major type of goods, imports of raw materials and intermediate goods accounted for the largest share of the country’s total imports in February 2024, amounting to USD 3.49 billion (36.5%). This was followed by capital goods with a share of USD 2.55 billion (26.7%), and consumer goods with an import value of USD 1.75 billion (18.3%). (Figure 10 and Table 13)
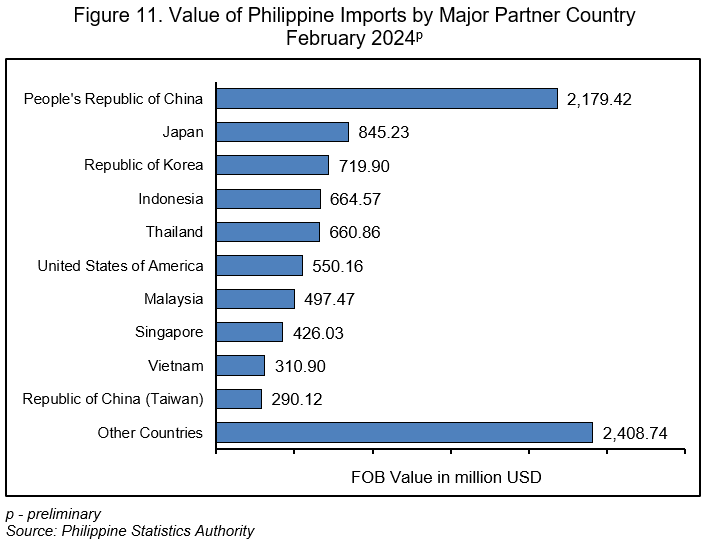
5. People’s Republic of China had the highest import value
People’s Republic of China was the country’s largest supplier of imported goods valued at USD 2.18 billion or 22.8 percent of the country’s total imports in February 2024.
Completing the top five major import trading partners for this month with their corresponding import values and percent shares to the total imports were:
a. Japan, USD 845.23 million (8.8%);
b. Republic of Korea, USD 719.90 million (7.5%);
c. Indonesia, USD 664.57 million (7.0%); and
d. Thailand, USD 660.86 million (6.9%). (Figure 11 and Table 15)
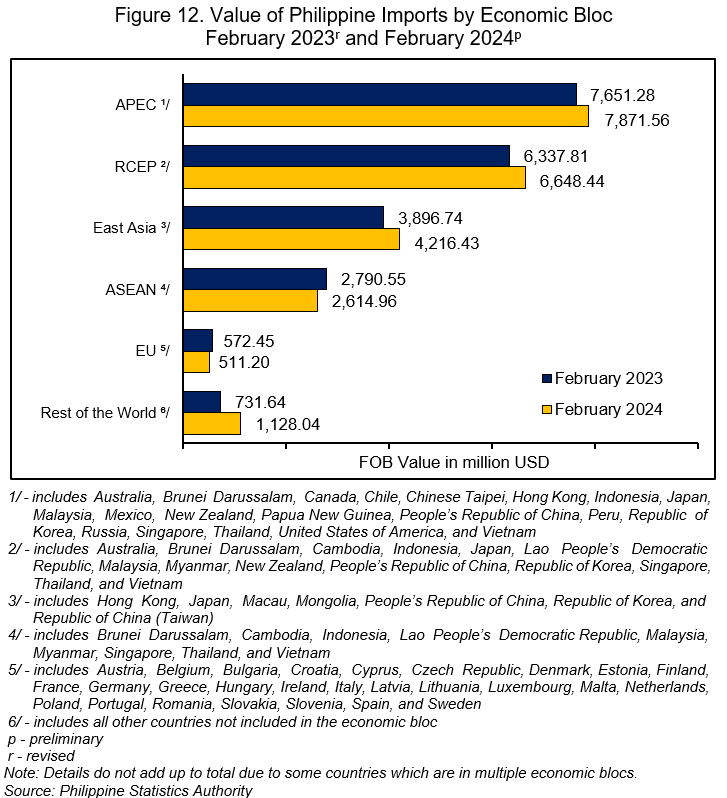
6. Imports came largely from APEC member countries
By economic bloc, APEC countries were the largest suppliers of the country’s imported goods in February 2024 with a share of USD 7.87 billion (82.4%). This was followed by RCEP with an import value of USD 6.65 billion (69.6%), and East Asia with USD 4.22 billion (44.1%). (Figure 12, and Tables 16 and 18)
7. East Asia contributed the highest import value among geographic regions
By geographic region, East Asia had the highest import value of USD 4.22 billion (44.1%) in February 2024. This was followed by Southeast Asia with an import value amounting to USD 2.61 billion (27.4%), and Northern America valued at USD 584.86 million (6.1%). (Figure 13 and Table 19)

CLAIRE DENNIS S. MAPA, PhD
Undersecretary
National Statistician and Civil Registrar General
See more at the Export and Import Statistics landing page.