

A. Total Agricultural Trade
1. Total agricultural trade decreased by 0.9 percent
The country’s total agricultural trade in the fourth quarter of 2023, which amounted to USD 6.27 billion, posted an annual decline of 0.9 percent. This indicates a slower annual decline from the 12.0 percent annual decrease in the third quarter of 2023. In the fourth quarter of 2022, the total agricultural trade recorded an annual increase of 5.1 percent.
In the fourth quarter of 2023, total agricultural exports was recorded at USD 1.63 billion or 25.9 percent share to the total agricultural trade, while agricultural imports accounted for USD 4.64 billion or 74.1 percent of the total agricultural trade. (Figure 1, and Tables A and 1)

2. Agricultural trade balance decreased by 6.6 percent
In the fourth quarter of 2023, the total balance of trade in agricultural goods was recorded at USD -3.02 billion, which reflects a deficit with an annual drop of 6.6 percent. In the third quarter of 2023, the annual decrease in the trade deficit went down by 10.5 percent, while the trade deficit in the fourth quarter of 2022 posted an annual increment of 37.6 percent. (Tables A and 1)
B. Agricultural Exports
1. Agricultural exports grew by 5.0 percent
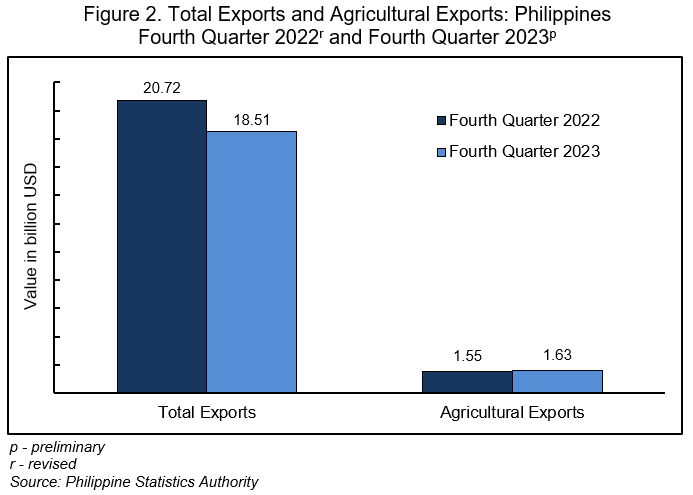
The country’s agricultural export revenue increased to USD 1.63 billion in the fourth quarter of 2023. This indicates an annual increment of 5.0 percent from the USD 1.55 billion agricultural export revenue in the fourth quarter of 2022. In the fourth quarter of 2023, the value of agricultural exports accounted for 8.8 percent of the country’s total exports. (Figure 2, and Tables A and 1)
2. Edible fruit and nuts; peel of citrus fruit melons commodity group accounted for the largest share to the total agricultural exports
The top 10 commodity groups in terms of value of agricultural exports contributed USD 1.56 billion or 96.2 percent to the total agricultural export revenue in the fourth quarter of 2023. The combined agricultural export value of these top 10 commodity groups posted an annual increase of 4.7 percent during the quarter.
Among the commodity groups, edible fruit and nuts; peel of citrus fruit melons, which was valued at USD 501.12 million, comprised the largest share of 30.8 percent to the total agricultural exports in the fourth quarter of 2023. (Figure 3 and Table 3)

3. Malaysia led as a trading partner in agricultural exports among Association of Southeast Asian Nations (ASEAN) member countries
The country’s agricultural exports to ASEAN member countries in the fourth quarter of 2023 amounted to USD 204.31 million, which accounted for 7.2 percent of the total value of exports to ASEAN member countries. Among the ASEAN member countries, Malaysia was the top buyer of agricultural exports worth USD 52.02 million or a share of 25.5 percent to the total value of agricultural exports to ASEAN member countries in the fourth quarter of 2023. (Figure 4 and Table 7)

4. Tobacco and manufactured tobacco substitutes commodity group was the top agricultural exports to ASEAN member countries
The top three major agricultural commodities exported to ASEAN member countries in the fourth quarter of 2023 were:
a. tobacco and manufactured tobacco substitutes, USD 76.49 million;
b. animal or vegetable fats and oils and their cleavage products; prepared edible fats; animal or vegetable waxes, USD 30.69 million; and
c. preparations of cereals, flour, starch or milk; pastrycooks' products, USD 17.56 million. (Table 7)
5. Netherlands was the country’s major trading partner in the exports of agricultural goods among European Union (EU) member countries
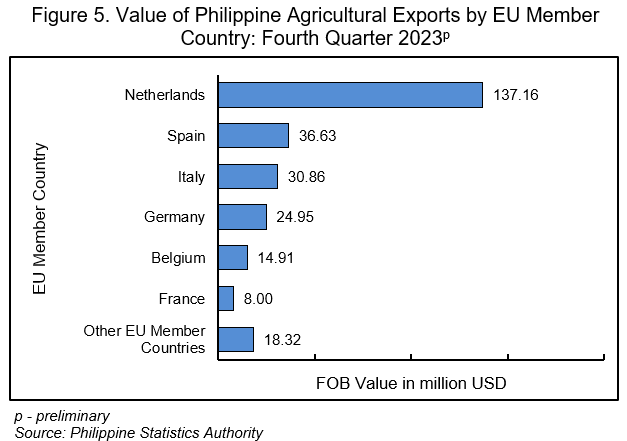
Exports of agricultural goods to EU member countries in the fourth quarter of 2023 reached USD 270.81 million, which contributed 13.6 percent to the country’s total value of exports to EU member countries.
Among the EU member countries, Netherlands was the country’s top destination of agricultural commodities worth USD 137.16 million or 50.6 percent of the total agricultural exports to EU member countries for this quarter of 2023. (Figure 5 and Table 9)
6. Animal or vegetable fats and oils and their cleavage products; prepared edible fats; animal or vegetable waxes commodity group was the top agricultural exports to EU member countries
The top three major agricultural commodities exported to EU member countries in the fourth quarter of 2023 were:
a. animal or vegetable fats and oils and their cleavage products; prepared edible fats; animal or vegetable waxes, USD 135.10 million;
b. preparations of meat, of fish, or of crustaceans, molluscs and other aquatic invertebrates, USD 53.04 million; and
c. lac; gums, resins and other vegetable saps and extracts, USD 19.43 million. (Table 9)
C. Agricultural Imports
1. Agricultural imports decreased annually by 2.9 percent
The total agricultural imports was valued at USD 4.64 billion, representing a share of 14.7 percent to the country’s total imports in the fourth quarter of 2023. It registered a decline of 2.9 percent from the USD 4.78 billion worth of agricultural imports in the fourth quarter of 2022. (Figure 6, and Tables A and 1).

2. Cereals commodity group accounted for the highest value of agricultural imports
The top 10 commodity groups in terms of value of agricultural imports amounted to USD 3.95 billion or 85.0 percent of the total agricultural import revenue in the fourth quarter of 2023. The combined agricultural import value of these top 10 commodity groups posted an annual decrement of 1.4 percent during the fourth quarter of 2023 relative to its same quarter value in 2022.
Among the major commodity groups, cereals accounted for the largest share worth USD 1.02 billion or 22.0 percent of the total value of agricultural imports in the fourth quarter of 2023. (Figure 7 and Table 5)

3. Vietnam reported the highest agricultural import value among ASEAN member countries
The country’s agricultural imports from ASEAN member countries in the fourth quarter of 2023 amounted to USD 1.67 billion or 17.8 percent of the country’s total imports. In terms of value, Vietnam was the leading supplier of agricultural products to the Philippines among ASEAN member countries. It contributed USD 479.29 million or 28.6 percent to the country’s total value of agricultural imports from ASEAN member countries in the fourth quarter of 2023. (Figure 8 and Table 8)

4. Cereals commodity group was the top imported agricultural commodity from ASEAN member countries
The top three imported agricultural goods from ASEAN member countries in the fourth quarter of 2023 were:
a. cereals, USD 444.85 million;
b. miscellaneous edible preparations, USD 368.33 million; and
c. animal or vegetable fats and oils and their cleavage products; prepared edible fats; animal or vegetable waxes, USD 304.74 million. (Table 8)
5. Spain led EU member countries in agricultural imports
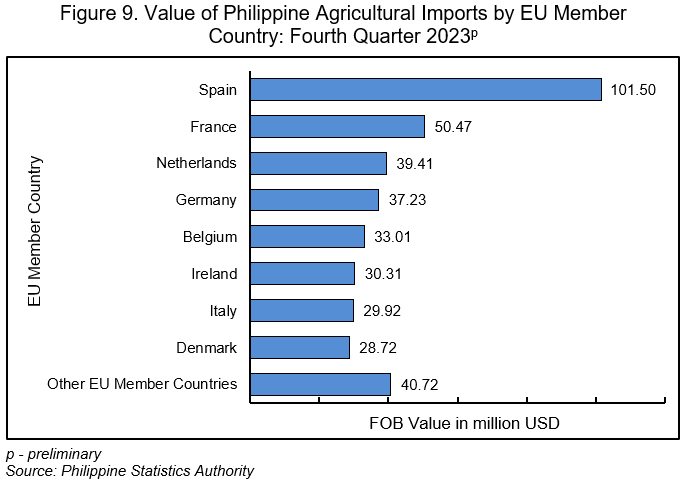
The country’s agricultural imports from EU member countries amounted to USD 391.29 million or a share of 19.7 percent to the total value of imports in the fourth quarter of 2023. Among EU member countries, Spain was the country’s top supplier of agricultural commodities with an import value of USD 101.50 million or a share of 25.9 percent to the country’s total value of agricultural imports from EU member countries. (Figure 9 and Table 10)
6. Meat and edible meat offal commodity group topped agricultural imports from EU member countries
The top three agricultural commodities imported from EU member countries in the fourth quarter of 2023 were:
a. meat and edible meat offal, USD 92.05 million;
b. dairy produce; birds’ eggs; natural honey; edible products of animal origin, not elsewhere classified, USD 68.37 million; and
c. beverages, spirits and vinegar, USD 54.64 million. (Table 10)
DIVINA GRACIA L. DEL PRADO, PhD
Assistant Secretary
Deputy National Statistician
Sectoral Statistics Office