
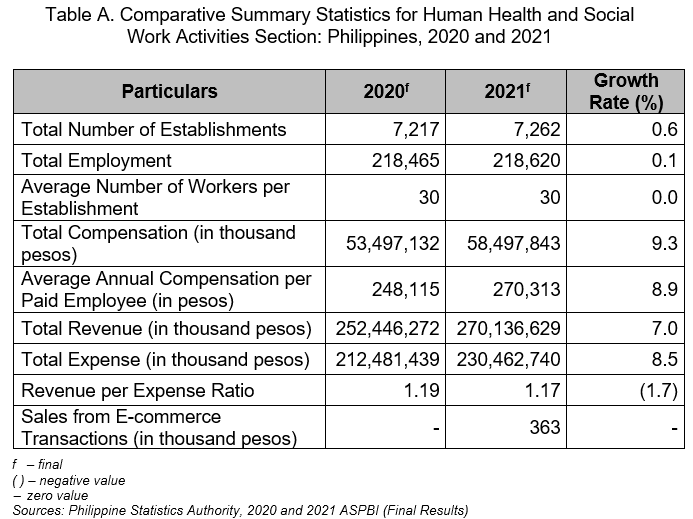
Medical and dental practice activities industry group had the highest share to the total number of establishments
The final results of the 2021 Annual Survey of Philippine Business and Industry (ASPBI) showed that a total of 7,262 establishments in the formal sector of the economy were engaged in human health and social work activities. This reflects an increase of 0.6 percent from the 7,217 establishments reported in 2020. (Tables A and 1)
Among industry groups, medical and dental practice activities led with 5,370 establishments or 74.0 percent of the total establishments for the section in 2021. This was followed by hospital activities with 1,078 establishments (14.8%) and other social work activities without accommodation, not elsewhere classified with 321 establishments (4.4%). (Figure 1 and Table 1)
At the regional level, the National Capital Region (NCR) registered the highest number of 2,252 establishments or 31.0 percent of the total. CALABARZON and Central Luzon followed with 1,143 establishments (15.7%) and 777 establishments (10.7%), respectively. (Table 3)
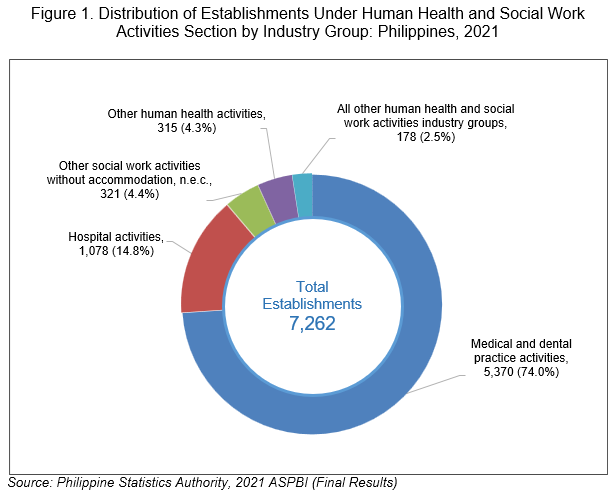
Hospital activities industry group employed the highest number of workers
The human health and social work activities section employed a total of 218,620 workers in 2021. This indicates an increase of 0.1 percent from the 218,465 workers recorded in 2020. Of the total workforce, 216,408 workers or 99.0 percent were paid employees, while the remaining were working owners and unpaid workers. (Tables A and 1)
Among industry groups, hospital activities employed the highest number of 157,368 workers (72.0%) in 2021. This was followed by medical and dental practice activities and other social work activities without accommodation, not elsewhere classified with 48,877 workers (22.4%) and 5,783 workers (2.6%), respectively. (Figure 2 and Table 1)
NCR topped among the regions in terms of employment with 70,316 workers (32.2%). This was followed by CALABARZON and Central Luzon with 33,344 workers (15.3%) and 22,947 workers (10.5%), respectively. (Table 3)
The section recorded an average employment of 30 workers per establishment in 2021, which was the same average number of workers posted in 2020. Among industry groups, hospital activities posted the highest average employment of 146 workers per establishment. This was followed by residential care activities for mental retardation, mental health and substance abuse with 27 workers per establishment and other social work activities without accommodation, not elsewhere classified with 18 workers per establishment. (Tables A and 2)
By region, SOCCSKSARGEN had the highest average employment of 44 workers per establishment, while the lowest average employment was registered in Cordillera Administrative Region with 17 workers per establishment. (Table 4)
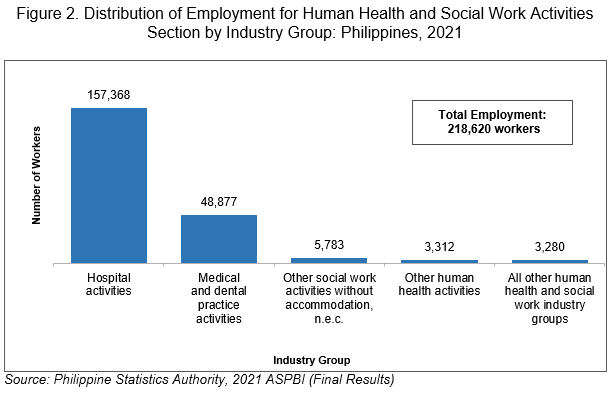
Hospital activities industry group paid the highest average annual compensation per paid employee
In 2021, the section paid a total compensation of PhP 58.50 billion. This translates to an average annual compensation of PhP 270.31 thousand per paid employee, which was 8.9 percent higher than the average annual compensation of PhP 248.12 thousand per paid employee reported in 2020. (Tables A, 1, and 2)
By industry group, hospital activities paid the highest average annual compensation of PhP 289.61 thousand per paid employee in 2021. Social work activities without accommodation for the elderly and disabled followed with an average annual pay of PhP 278.82 thousand per paid employee. On the other hand, residential nursing care facilities paid the lowest average annual compensation of PhP 114.19 thousand per paid employee. (Figure 3 and Table 2)
By region, NCR paid the highest average annual compensation of PhP 380.04 thousand per paid employee, while Bangsamoro Autonomous Region in Muslim Mindanao recorded the lowest average annual compensation of PhP 129.85 thousand per paid employee in 2021. (Table 4)
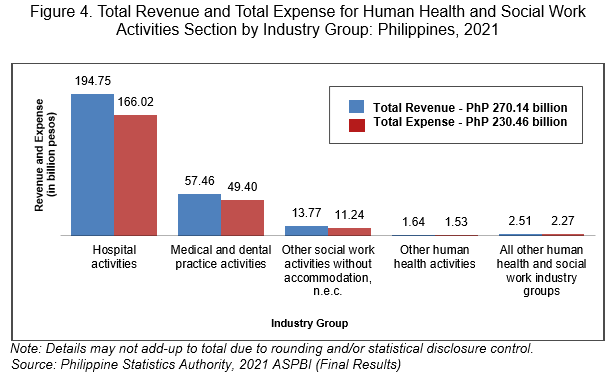
Hospital activities industry group contributed the highest share to the total revenue and total expense
The section generated a total revenue of PhP 270.14 billion in 2021, indicating an increase of 7.0 percent from the total revenue of PhP 252.45 billion in 2020. Meanwhile, total expense incurred by the section amounted to PhP 230.46 billion in 2021. This was 8.5 percent higher than the total expense of PhP 212.48 billion in 2020. (Figure 4, and Tables A and 1)
The top three industry groups in terms of total revenue and total expense for the section were as follows:
1. Hospital activities accounted for the highest share with total revenue of PhP 194.75 billion (72.1%) and total expense of PhP 166.02 billion (72.0%);
2. Medical and dental practice activities with PhP 57.46 billion (21.3%) total revenue and PhP 49.40 billion (21.4%) total expense; and
3. Other social work activities without accommodation, not elsewhere classified with PhP 13.77 billion (5.1%) total revenue and PhP 11.24 billion (4.9%) total expense. (Figure 4 and Table 1)
The top three regions in terms of total revenue generation comprised 68.4 percent of the section’s total revenue. NCR earned the highest revenue amounting to PhP 121.07 billion (44.8%). This was followed by CALABARZON and Central Luzon with respective total revenue of PhP 40.89 billion (15.1%) and PhP 22.73 billion (8.4%). (Table 3)
Similarly, NCR emerged as the top spender with PhP 103.61 billion (45.0%) total expense. This was followed by CALABARZON and Central Luzon with PhP 35.51 billion (15.4%) and PhP 18.74 billion (8.1%) total expense, respectively. (Table 3)
The section generated a revenue per peso expense ratio of 1.17 in 2021, indicating a decline of 1.7 percent from the revenue per peso expense ratio of 1.19 in 2020. Among industry groups, residential care activities for the elderly and disabled generated the highest revenue per peso expense ratio of 1.28. (Tables A and 2)
By region, Cagayan Valley generated the highest revenue per peso expense ratio of 1.58. This was followed by Cordillera Administrative Region with 1.45 revenue per peso expense ratio and Zamboanga Peninsula with 1.39 revenue per peso expense ratio. (Table 4)
Sales from e-commerce amounted to PhP 363.00 thousand
E-commerce transaction is the sale or purchase of goods or services, whether between businesses, households, individuals, governments, and other public or private organizations, conducted over the Internet. The goods and services are ordered over the Internet, but the payment and the ultimate delivery of the good or service may be conducted on or offline.
E-commerce sales generated by the section in 2021 amounted to PhP 363.00 thousand. This amount was solely from the medical and dental practice activities industry group, which is located in NCR. No sales from e-commerce was recorded in 2020. (Tables A and 1)
DIVINA GRACIA L. DEL PRADO, PhD
Assistant Secretary
Deputy National Statistician
Sectoral Statistics Office
TECHNICAL NOTES
2021 Annual Survey of Philippine Business and Industry
I. Introduction
I.1. Background of the Survey
The Annual Survey of Philippine Business and Industry (ASPBI), one of the designated statistical activities of the Philippine Statistics Authority (PSA), generates essential statistics for economic planning and analysis. It is specifically designed to collect and generate information on the levels, structure, performance, and trends of economic activities of the formal sector of the country’s economy.
The 2021 ASPBI is the 49th in the series of annual surveys of establishments in the country. It was conducted nationwide in April 2022 with 2021 as reference period. In this round of the ASPBI, the 2021 Survey on Information and Communications Technology (SICT) is a rider to this survey.
The conduct of the 2021 ASPBI is authorized under Republic Act No. 10625, known as the Philippine Statistical Act of 2013, which mandates the PSA to collect, compile, analyze, and publish statistical information relating to the country’s economic condition.
I.2. Objectives
The 2021 ASPBI aims to collect and generate information on the levels, structure, performance, and trends of economic activities of the formal sector of the economy for the year 2021.
Specifically, the 2021 ASPBI aims to:
1. collect and generate detailed information on employment, revenue, expense, inventories, tangible fixed assets, intangible assets, and total assets of the establishments;
2. generate estimates for other economic indicators such as value added, average compensation, and other indicators which are necessary to evaluate the performance of industries at the national and regional levels;
3. generate statistics for micro, small, and medium establishments (MSME) where identification of MSME is based on total employment; and
4. gather pertinent information for the updating of the sampling frame of establishment-based surveys.
I.3. Historical Information on the Survey
Annual surveys are usually conducted a year after the reference year. Except for the survey conducted in 2002, the year in the survey title refers to the reference year.
The following are the annual surveys conducted:
1. 1956 Annual Survey of Manufactures (ASM) – First annual survey of establishments undertaken since the Bureau of Census and Statistics (BCS) was established in 1940. It was conducted jointly by the National Economic Council (now the National Economic and Development Authority or NEDA) and the BCS with technical assistance provided by the International Cooperation Administration (ICA) of the United States (US). The ICA is the predecessor of the now US Agency for International Development (USAID).
2. 1957 ASM – This was also conducted jointly by NEDA and BCS.
3. 1958 ASM – This survey was integrated as a regular activity of the BCS.
4. 1959, 1960, 1962, 1963, 1964, 1965, and 1966 ASM – Annual Surveys of Manufactures were conducted for these years.
5. 1965 Annual Survey of Wholesale and Retail Trade (ASWRT) was conducted for the City of Manila only. The 1966 ASWRT was expanded to cover both the City of Manila and suburbs, but there were no available publications.
6. 1968 and 1969 – The ASM and the ASWRT were conducted.
7. The 1968 ASWRT was the start of the annual series for wholesale and retail trade at the national level.
8. 1970 and 1971 Annual Survey of Establishments (ASE) – The scope of the annual survey was expanded to include the business, utilities, and services sectors, aside from manufacturing, and wholesale and retail trade.
9. 1973 and 1974 ASE – The coverage of the 1971 ASE was expanded to include Mining and Quarrying; Construction; and Transportation, Communication and Storage; Electricity, Gas, and Water; Financing; Insurance; Real Estate and Business Services were included for the first time in the 1974 ASE.
10. 1976 ASE – The annual survey was conducted for all sectors, which was also the start of the Annual Surveys of Agriculture, Forestry and Hunting, and Fishing.
11. 1977, 1979, 1980, 1981, 1982, 1984, 1985,1986, 1987, 1989, 1990, 1991, 1992, 1993 and 1995 – Annual surveys for all sectors were conducted for these years.
12. 1996 and 1997 ASE – Only one survey was conducted for all sectors to collect data for two years, 1996 and 1997.
13. 1998 ASE – Annual survey was conducted for all sectors.
14. 2000 – No annual survey was conducted for this reference year.
15. 2001 – The title of the survey for this reference year was renamed as 2002 Annual Survey of Philippine Business and Industry (ASPBI). This was based on NSCB Resolution No.3 Series of 2000 which approved the change in the title of Census of Establishments to 2000 Census of Philippine Business and Industry (CPBI) and changed the title to the year when the census was undertaken. Thus, the title of the ASE was changed accordingly to ASPBI.
16. 2002 – No annual survey was undertaken for this reference year.
17. 2003 ASPBI – Starting with the 2003 ASPBI, the year in the survey title referred again to the reference year. The survey was conducted in 2004.
18. 2004 – No annual survey was undertaken for this reference year.
19. 2005 ASPBI – An annual survey was conducted in 2006 instead of the originally planned 2005 Census of Philippine Business and Industry.
20. 2007 and 2011 – No annual survey was undertaken for these reference years.
21. 2009, 2010, 2013, 2014, 2015, 2016, 2017, 2019, 2020 and 2021 ASPBI – The surveys were conducted for these reference years.
An economic census of establishments was undertaken for reference years 1903, 1918, 1939, 1948, 1961, 1967, 1972, 1975, 1978, 1983, 1988, 1994, 1999, 2006, 2012, and 2018. Except for 1999, the title of the census refers to the year the census was conducted. For these years, no annual surveys were undertaken.
I.4. Scope and Coverage
The 2021 ASPBI covered establishments engaged in 18 sections classified according to the 2009 Philippine Standard Industrial Classification (PSIC), namely:
1. Agriculture, Forestry, and Fishing (A)
2. Mining and Quarrying (B)
3. Manufacturing (C)
4. Electricity, Gas, Steam, and Air Conditioning Supply (D)
5. Water Supply; Sewerage, Waste Management, and Remediation Activities (E)
6. Construction (F)
7. Wholesale and Retail Trade; Repair of Motor Vehicles and Motorcycles (G)
8. Transportation and Storage (H)
9. Accommodation and Food Service Activities (I)
10. Information and Communication (J)
11. Financial and Insurance Activities (K)
12. Real Estate Activities (L)
13. Professional, Scientific, and Technical Activities (M)
14. Administrative and Support Service Activities (N)
15. Education (P)
16. Human Health and Social Work Activities (Q)
17. Arts, Entertainment, and Recreation (R)
18. Other Service Activities (S)
The survey was confined to the formal sector of the economy, which consists of the following:
1. Corporations and partnership, regardless of employment size;
2. Cooperatives and foundations, regardless of employment size;
3. Single proprietorships with branches, regardless of employment size; and
4. Single proprietorship with no branches but with total employment (TE) of 10 and over.
Hence, the 2021 ASPBI covered all establishments regardless of employment size, except those establishments with:
1. Legal Organization of single proprietorship (LO=1),
2. Economic Organization of single establishment (EO=1), and
3. TE of less than 10.
II. Data Collection and Processing
II.1. Data Collection
The survey was conducted nationwide in 2022 with 2021 as the reference period, except for employment where the reference period is as of 15 November 2021.
Distribution and collection of 2021 ASPBI questionnaires were done according to a timetable set. Distribution was done in April 2022 through personal visits by PSA field staff to the sample establishments located in the provinces and cities nationwide. The collection of accomplished questionnaires started one week after distribution.
II.2. Survey Instruments
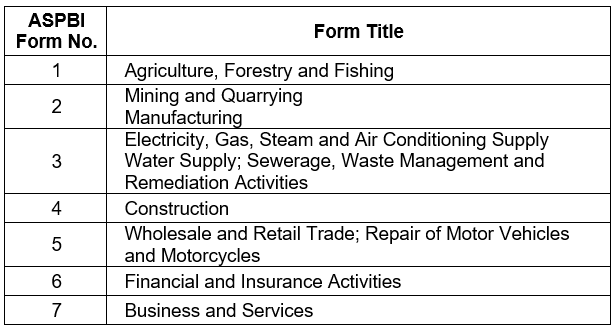
The 2021 ASPBI utilized seven forms of questionnaires which captured data of sample establishments engaged in the 18 sections of the economy as defined in the 2009 PSIC. The seven forms of questionnaires are presented in the table below:
Each form of the survey questionnaire is available in three options. These are the following:
1. online questionnaire which can be accessed at https://aspbi.psa.gov.ph;
2. electronic copy of the questionnaire, either in portable document format (.pdf) or Excel (.xlsx) file format; and
3. printed copy of the self-administered questionnaire.
The sample establishment can choose from these options in recording the information for the data items in the survey questionnaire.
II.3. Data Items
The survey collected data on employment, revenue, expense, sales from e-commerce transactions, capital expenditure, book value of fixed tangible and intangible assets, average capacity utilization rate, and inventory.
II.4. Data Processing
To ensure quality of survey reports, several levels of validation following guidelines set were done during the processing phase of the survey operation.
Computer systems were also developed and used to facilitate the smooth conduct and monitoring of the survey operation. These were the Monitoring and Tracking System (MTS) and the Establishment Data Management System (EDMS) which are online systems. The MTS was used to monitor the real-time progress of the survey operation, which included distribution, collection, transmittal, manual processing, and data processing of questionnaires, among others. On the other hand, the EDMS was used in the processing of data and tabulation of survey results.
III. Methodology
III.1. Sampling Frame
The sampling frame for the 2021 ASPBI was extracted from the preliminary 2021 List of Establishments (LE) updated as of 24 January 2022. This frame was used to draw the sample establishments for the survey. The preliminary 2021 LE showed that there were 1,079,093 establishments that were in operation in the country of which 349,071 establishments comprised the sampling frame or the establishments that are within the scope and coverage of the 2021 ASPBI.
III.2. Sample Selection Procedure
The 2021 ASPBI uses a stratified systematic sampling design with 3-digit or 5-digit PSIC as the first stratification variable, depending on the section and total employment, which is classified into Micro, Small, Medium establishments (MSME), as the second stratification variable.
Stratified systematic sampling is a process of dividing the population into homogeneous groups, called strata, and then selecting independent samples in each stratum systematically. This method ensures that all important subgroups of the population are represented in the sample and increases the precision of “overall” survey estimates.
Domain
The geographic domain of the 2021 ASPBI is the region. The industry domain/stratum is a 3-digit or 5-digit industry classification, and the employment domain/stratum is the MSME classification.
Unit of Enumeration
The unit of enumeration for the 2021 ASPBI is the establishment.
III.3. Estimation Procedure
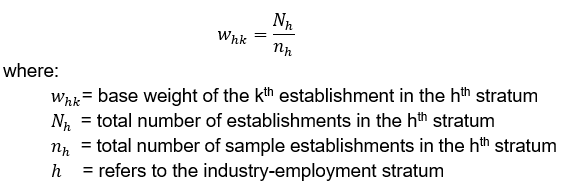
III.3.1. Weights Computation
Base Weight
The base weight is the inverse of the probability of selection. For the ASPBI, the base weight for each domain is given by:
Adjustment Factor
To take into account the non-responding sample establishments, the adjustment factor by region and industry section is as follows:

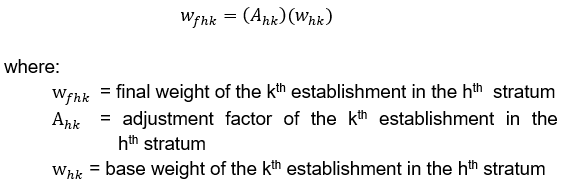
Final Weight
The final weight is the product of the base weight and adjustment factor. That is,
III.3.2. Estimation of Total
Total by Industry-Employment Stratum (h)
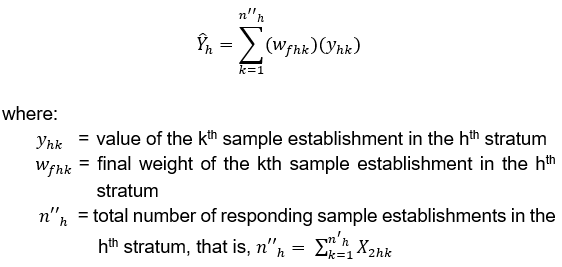
The estimator for the total of a characteristic in each industry-employment stratum (h) in a region (geographic domain) is given by:
Total by Industry Stratum per Region
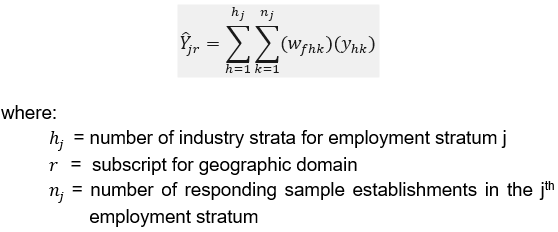
The estimator for the total of a characteristic in each industry stratum in a region is given by:

Total by Employment Stratum per Region
The estimator for the total of a characteristic in each employment stratum for the regional domain is given by:
Total by Geographic Domain
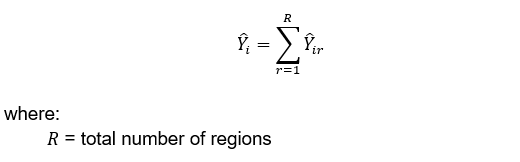
The estimator for the total of a characteristic in each geographic domain is given by:

Total by Industry Stratum (National)
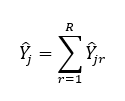
The estimator for the national total of a characteristic in each industry domain/stratum is given by:
Total by Employment Stratum (National)
The estimator for the national total of a characteristic in each employment domain/stratum is given by:
National Total
The estimator for the national total of a characteristic is given by:
III.4. Response Rate
Response rate for all Human Health and Social Work Activities section was 93.1 percent (1,795 out of 1,928 establishments). This included receipts of "good" questionnaires, partially accomplished questionnaires, and reports of closed, moved out, or out-of-scope establishments.
Of the total responses, 134 establishments or 7.7 percent responded online.
Reports of establishments which were found to be duplicate of another establishment, out-of-scope and out of business in 2021 were not included in the generation of statistical tables.
III. Concepts and Definition of Terms
An establishment is defined as an economic unit under a single ownership or control which engages in one or predominantly one kind of economic activity at a single fixed location.
An establishment is categorized by its economic organization, legal organization, industrial classification, employment size, and geographic location.
Economic Organization refers to the organizational structure or role of the establishment in the organization. An establishment may be a single establishment, branch, establishment, and main office with branches elsewhere, main office only, or an ancillary unit other than the main office.
Legal Organization refers to the legal form of the economic entity which owns the establishment. An establishment may be a single proprietorship, partnership, government corporation, stock corporation, non-stock corporation, or cooperative.
Industrial classification of an economic unit was determined by the activity from which it derives its major income or revenue. The 2009 PSIC which was approved for adoption by government agencies and instrumentalities through PSA Resolution No. 01 Series of 2017-158 signed on 14 February 2017, was utilized to classify economic units according to their economic activities.
Size of an establishment is determined by its total employment as of the time of visit during the latest Updating of the List of Establishments.
Total Employment (TE) refers to the total number of persons who work in or for the establishment. This includes paid employees, working owners, unpaid workers, and all employees who work full-time or part-time including seasonal workers. Also included are persons on short-term leave such as those on sick, vacation or annual leaves, and on strike.
Geographic Classification refers to the grouping of establishments by geographic area using the Philippine Standard Geographic Code (PSGC) classification. The PSGC contains the latest updates on the official number of regions, provinces, cities, municipalities, and barangays in the Philippines. The PSGC as of 31 December 2021 was used for the 2021 ASPBI.
Compensation is the sum of salaries and wages, separation/retirement/terminal pay, gratuities, and payments made by the employer on behalf of the employees such as contribution to SSS/GSIS, ECC, PhilHealth, Pag-ibig, etc.
Expense is the cost incurred by the establishment during the year whether paid or payable. This is treated on a consumed basis. Valuation is at purchaser price including taxes and other charges, net of rebates, returns, and allowances. Goods and services received by the establishment from other establishments of the same enterprise are valued as though purchased.
Paid employees are all persons working in the establishment and receiving pay, as well as those working away from the establishment paid by and under the control of the establishment. Included are all employees on sick leave, paid vacation, or holiday. Excluded are consultants, home workers, receiving pure commissions only, and workers on indefinite leave.
Revenue is the cash received and receivables for goods/products and by-products sold and services rendered. Valuation is at producer prices (ex-establishment) net of discounts and allowances, including duties and taxes but excluding subsidies.
Salaries and wages are payments in cash or in kind to all employees, prior to deductions for employee’s contributions to SSS/GSIS, withholding tax, etc. Included are total basic pay, overtime pay, and other benefits.
E-commerce transaction is the sale or purchase of goods or services, whether between businesses, households, individuals, governments, and other public or private organizations, conducted over the Internet. The goods and services are ordered over the Internet, but the payment and the ultimate delivery of the good or service may be conducted on or offline.
V. Dissemination of Results and Revision
The results of the 2021 ASPBI are disseminated through the posting of Special Releases and electronic publications on the PSA website, and final statistical tables in OpenStat. The updating or revisions on data were done upon finalizing the results of the 2021 ASPBI data.
This Special Release presents the results of the 2021 ASPBI for Human Health and Social Work Activities establishments (Section Q). The survey covered all economic activities of the Human Health and Social Work Activities section except public medical, dental, and other health services. Data are presented by industry group or 3-digit classification as classified under the 2009 PSIC.
VI. Citation
Philippine Statistics Authority. (September 2023). Technical Notes on the 2021 Annual Survey of Philippine Business and Industry (ASPBI). https://psa.gov.ph/technical-notes/2021aspbi
VI. Contact Information
Soraya C. de Guzman
Chief Statistical Specialist
Services Statistics Division
(632) 8376-2090
For data request, you may contact the:
Knowledge Management and Communications Division
(632) 8462-6600 locals 820 and 823