
Release Date :
RICE
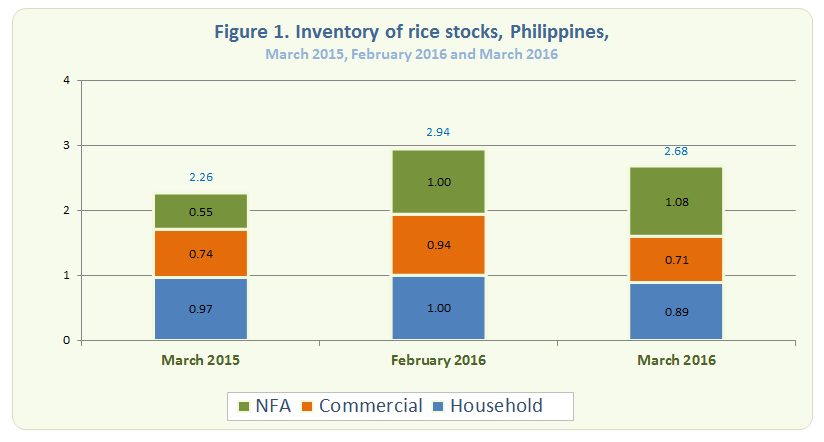
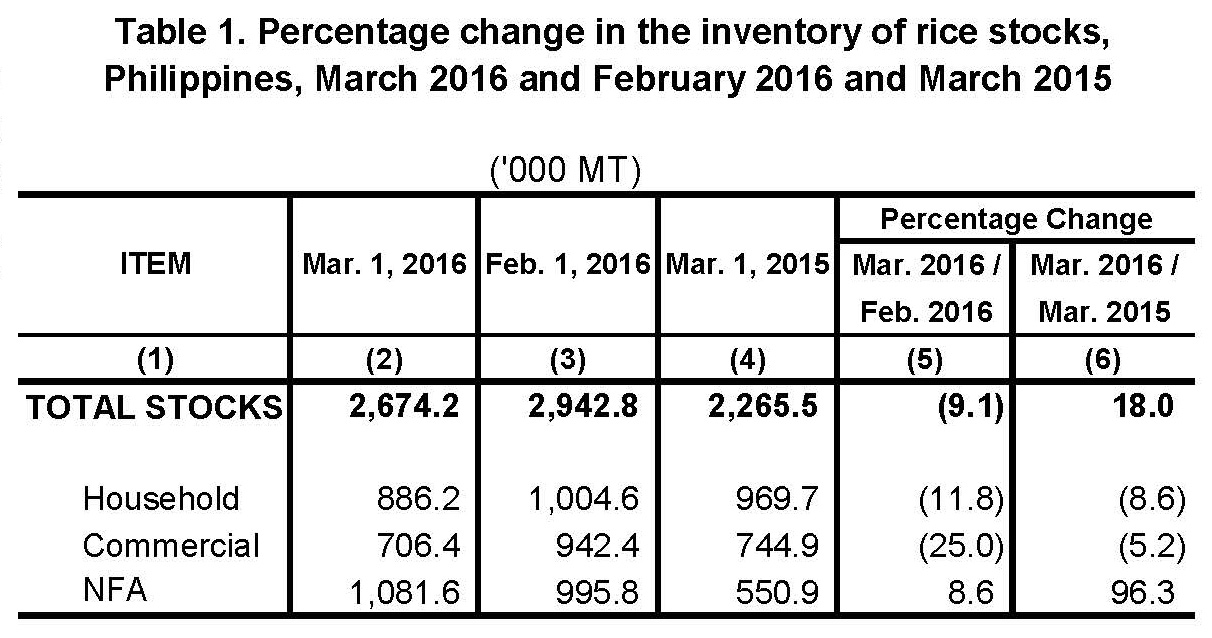
- As of March 1, 2016, the total rice stock inventory was 2.67 million metric tons (Figure 1). This was 18.0 percent above the 2.27 million metric tons level in March 2015 but 9.1 percent lower than last month’s inventory level of 2.94 million metric tons (Table 1).
- Compared with last year, rice stocks in NFA depositories increased by 96.3 percent. On the other hand, stocks in the households and in commercial warehouses decreased by 8.6 percent and 5.2 percent, respectively (Table 1).
- Compared with last month, rice stocks in NFA depositories, which comprised 86.9 percent of imported rice, grew by 8.6 percent. However, stocks in the households and in commercial warehouses dropped by 11.8 percent and 25.0 percent, respectively (Table 1).
- Of this month’s total rice stock inventory, 40.4 percent were in NFA depositories, 33.2 percent were with the households and 26.4 percent in commercial warehouses.
- The total rice inventory for this month would be sufficient for 79 days. Stocks in NFA depositories would be enough for 32 days, those in the households for 26 days, and those in commercial warehouses for 21 days.
CORN
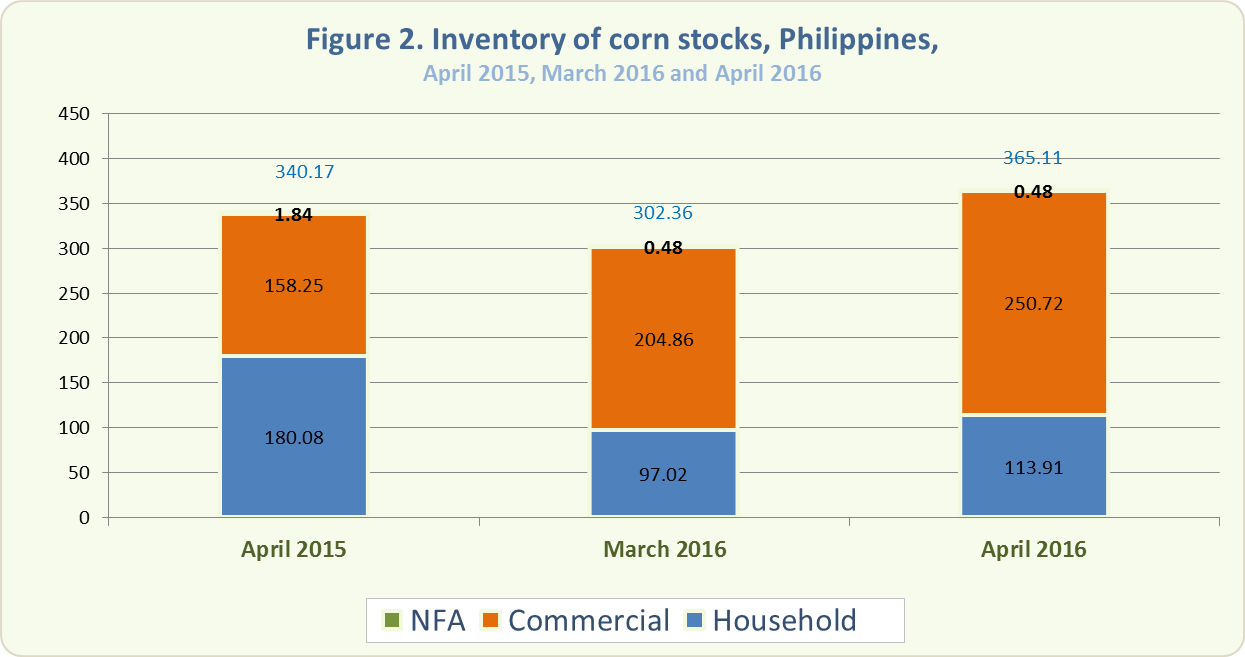
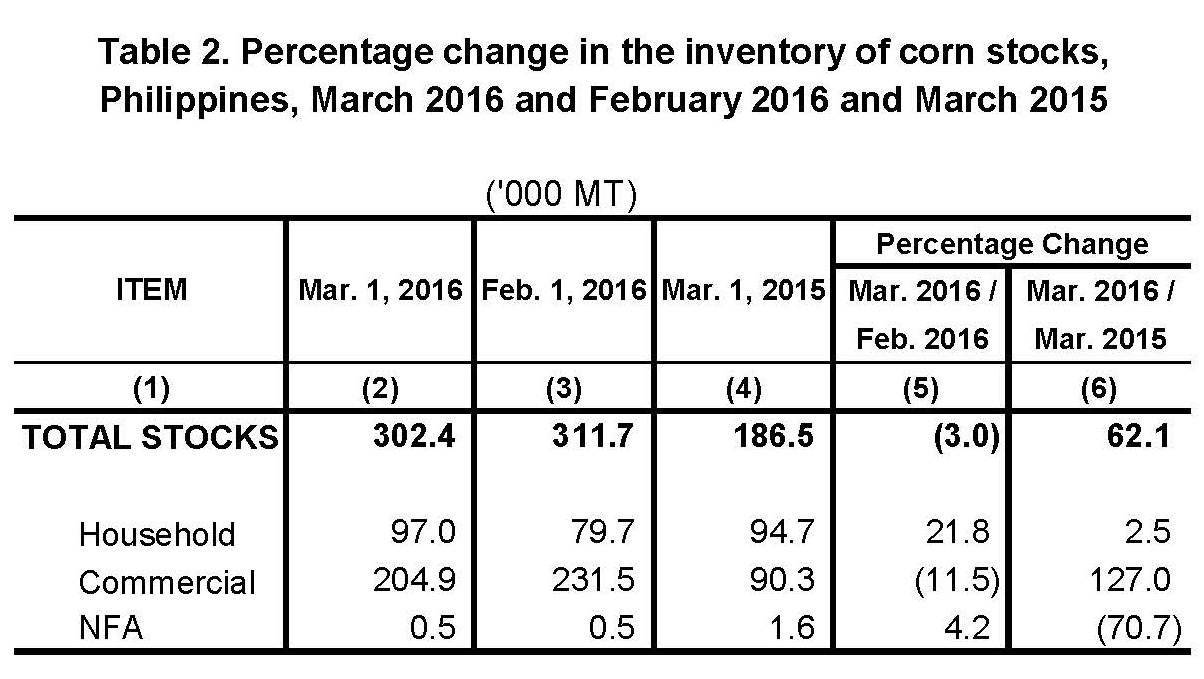
- The total corn stock inventory as of March 1, 2016, was 302.4 thousand metric tons (Figure 2). This was 62.1 percent higher than last year’s record of 186.5 thousand metric tons but 3.0 percent lower than last month’s level of 311.7 thousand metric tons (Table 2).
- Year-on-year, corn stocks in the households and in commercial warehouses increased by 2.5 percent and 127.0 percent, respectively. On the other hand, stocks in NFA depositories decreased by 70.7 percent (Table 2).
- Month-on-month, corn stocks in the households and in NFA depositories grew by 21.8 percent and 4.2 percent, respectively. However, stocks in the commercial warehouses dropped by 11.5 percent (Table 2).
- Around 67.8 percent of this month’s total corn stock inventory were in commercial warehouses, 32.0 percent were with the households, and 0.2 percent in NFA depositories.
| Attachment | Size |
|---|---|
|
|
476.76 KB |