
Release Date :
RICE
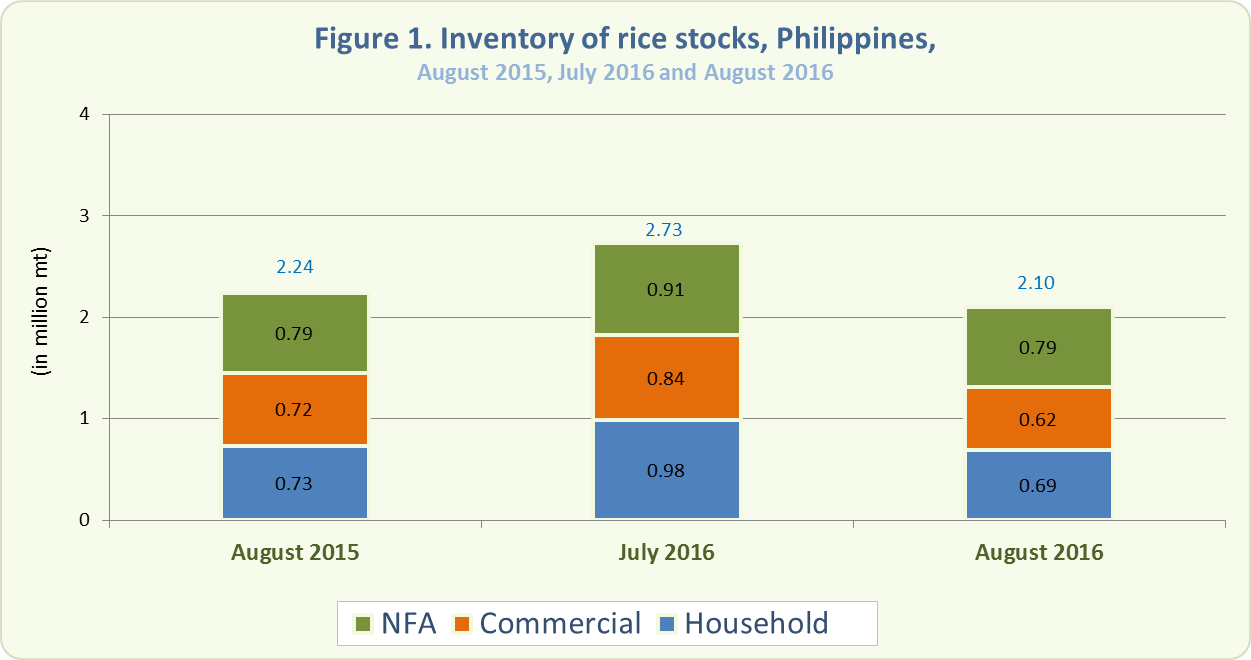
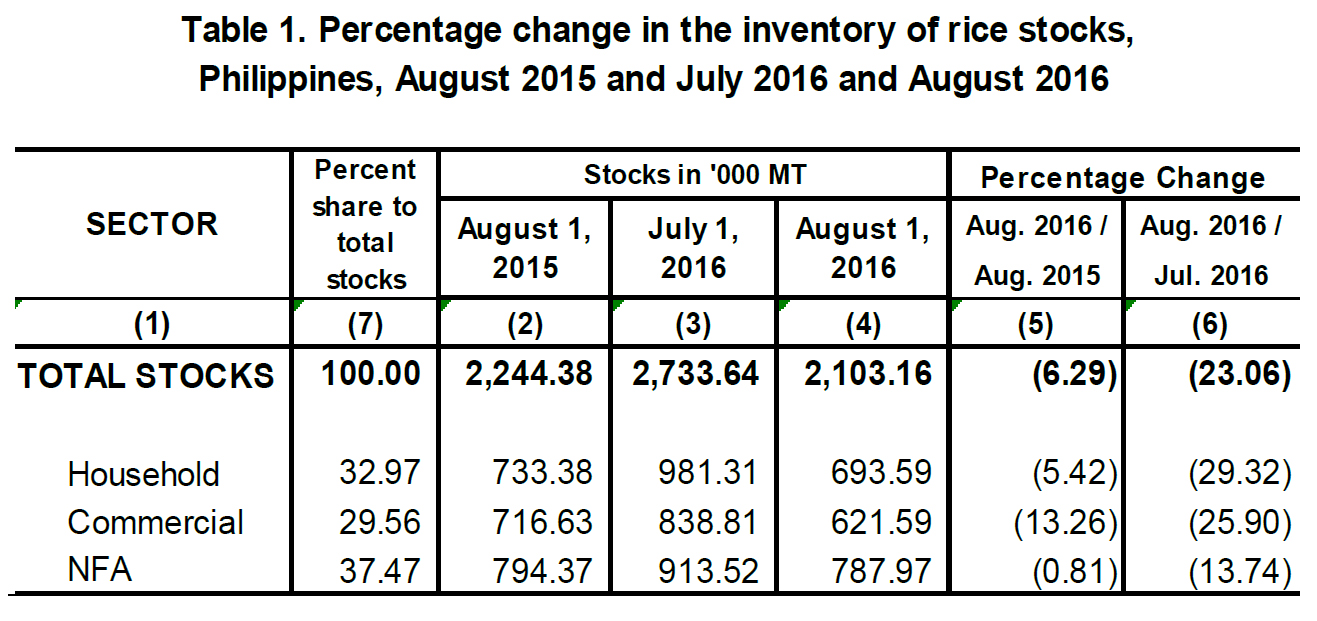
- As of August 1, 2016, the total rice stock inventory was 2.10 million metric tons (Figure 1). This was 6.29 percent lower than the 2.24 million metric tons level in August 2015 and 23.06 percent lower than last month’s inventory level of 2.73 million metric tons (Table 1).
- This month’s rice stocks in all sectors were lower compared with their levels last year. Stocks in the households decreased by 5.42 percent, in commercial warehouses by 13.26 percent, and in NFA depositories by 0.81 percent (Table 1).
- Compared with their levels last month, rice stocks in all sectors dropped. Stocks in the households decreased by 29.32 percent, in commercial warehouses by 25.90 percent, and in NFA depositories by 13.74 percent (Table 1).
- Of this month’s total rice stock inventory, 32.97 percent were with the households, 29.56 percent in commercial warehouses, and 37.47 percent were in NFA depositories. The latter comprised 82.47 percent of imported rice.
- The total rice inventory for this month would be sufficient for 61 days. Stocks in NFA depositories would be enough for 23 days, those in the households for 20 days, and those in commercial warehouses for 18 days.
CORN
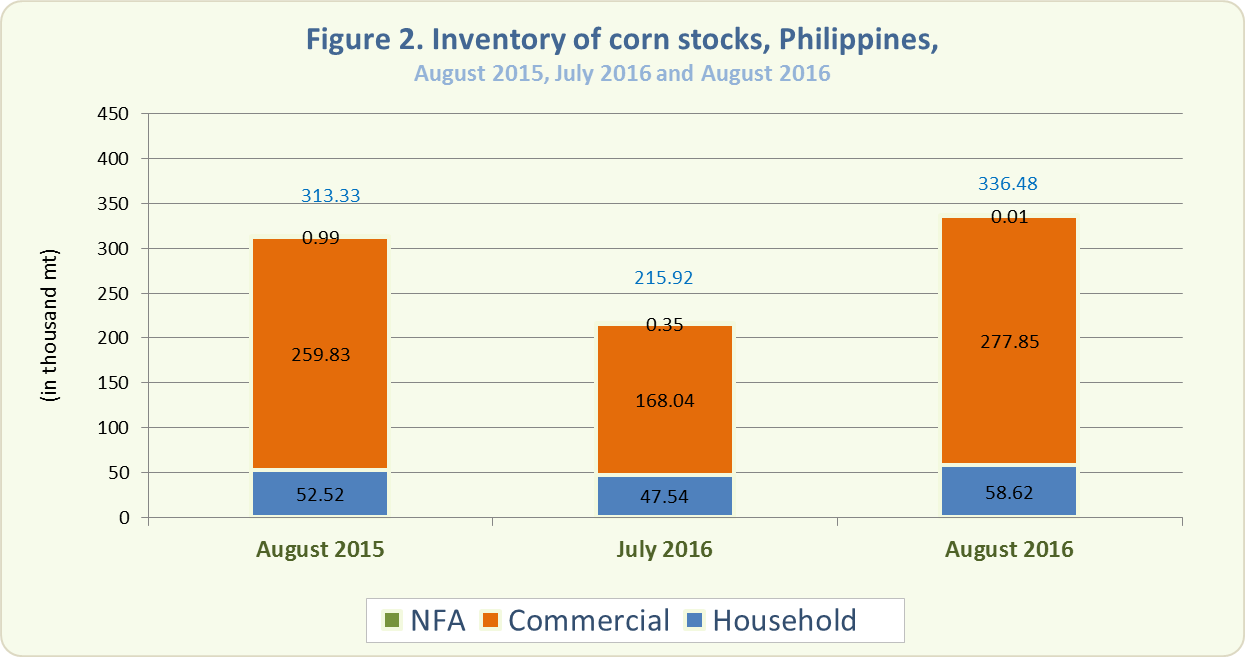
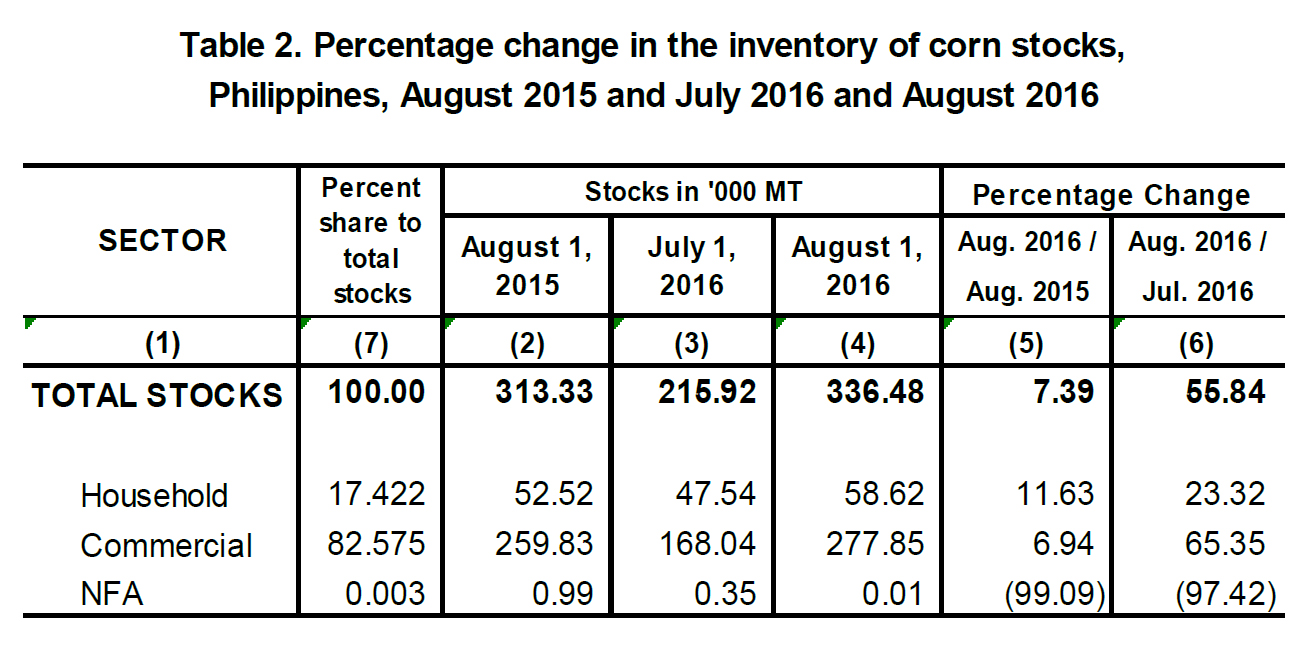
- The total corn stock inventory as of August 1, 2016 was 336.48 thousand metric tons (Figure 2). This was 7.39 percent higher than last year’s record of 313.33 thousand metric tons and 55.84 percent higher than last month’s level of 215.92 thousand metric tons (Table 2).
- Year-on-year, corn stocks in the households and in commercial warehouses grew by 11.63 percent and 6.94 percent, respectively. However, stocks in NFA depositories dropped by 99.09 percent (Table 2).
- Month-on-month, corn stocks in the households and in commercial warehouses increased by 23.32 percent and 65.35 percent, respectively. However, stocks in NFA depositories decreased by 97.42 percent (Table 2).
- Around 82.58 percent of this month’s total corn stock inventory were in commercial warehouses, 17.42 percent were with the households, and 0.003 percent in NFA depositories.
Technical Notes
Monthly rice and corn stocks inventory are generated from three sectors, namely: household, commercial, and National Food Authority (NFA). The household stocks are taken from the Palay and Corn Stocks Survey (PCSS1) of the PSA, which covers farming and non-farming households nationwide. The commercial stocks are sourced from registered grains businessmen through the Commercial Stocks Survey (CSS), conducted by the NFA, the results of which are submitted to PSA. NFA stocks are monitored from their warehouses/depositories.
| Attachment | Size |
|---|---|
|
|
438.65 KB |