
A. Quantity
1. Quantity of domestic trade declined
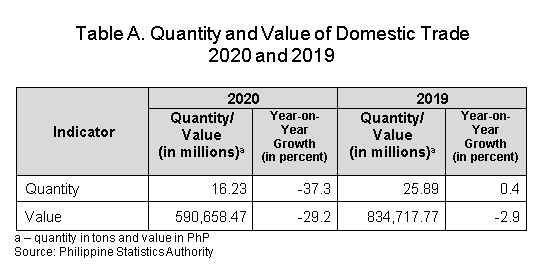
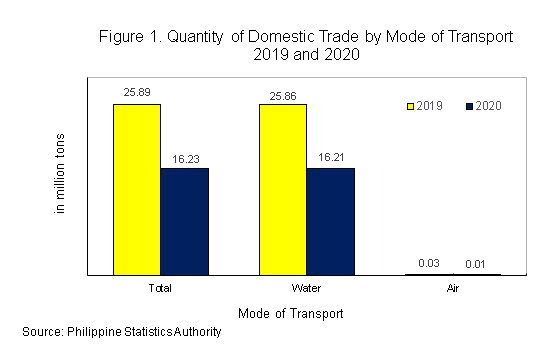
The total quantity of domestic trade in 2020 was recorded at 16.23 million tons. This represents an annual decrement of -37.3 percent. In 2019, the annual increase was 0.4 percent. Almost all (99.9%) of the commodities were traded through water (coastwise) while the rest were traded through air. (Figure 1 and Table A)
2. Food and live animals led in terms of quantity of domestic trade
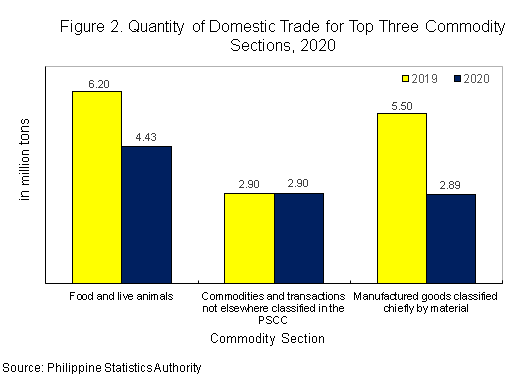
By commodity section, food and live animals topped in terms of quantity of domestic trade in 2020 with 4.43 million tons or a share of 27.3 percent to the total. This was followed by commodities and transactions not elsewhere classified with 2.90 million tons (17.9%) and manufactured goods classified chiefly by material with 2.89 million tons (17.8%). (Figure 2 and Table 1)
3. Central Visayas accounted for the highest quantity of traded commodities
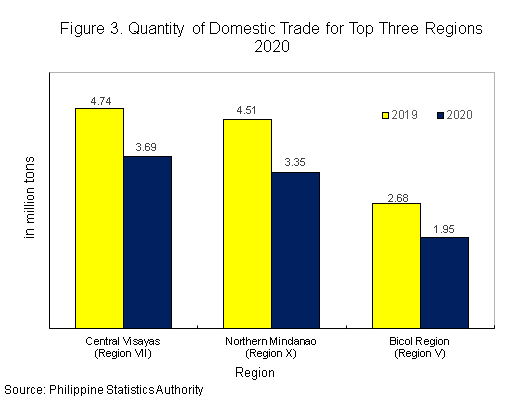
By region, Central Visayas (Region VII) recorded the highest quantity of traded commodities with 3.69 million tons or 22.8 percent share to the total in 2020. This was followed by Northern Mindanao (Region X) with a quantity of 3.35 million tons (20.6%) and Bicol Region (Region V) with 1.95 million tons (12.0%). (Figure 3 and Table 2)
B. Value
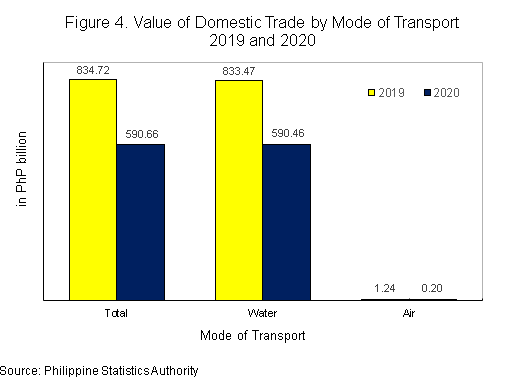
1. Value of domestic trade dropped
Domestic trade value is the outflow value which refers to the value of commodities that goes out from a specified region/province to another region/province.
The total value of domestic trade in 2020 amounted to PhP 590.66 billion. This indicates a contraction of -29.2 percent from the PhP 834.72 billion value of domestic trade in 2019.
By mode of transport, the total value of traded commodities through water accounted for almost all (99.97%) of the total commodities that flow within the country, while the remaining were traded through air. (Figure 4 and Table 1)
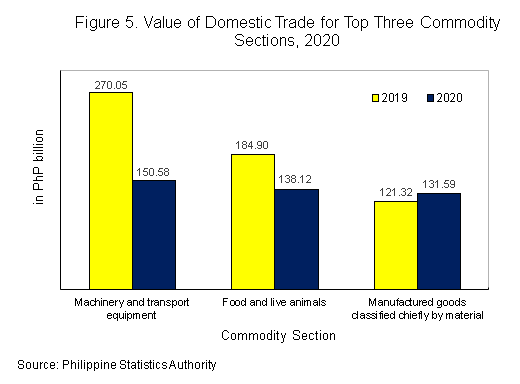
2. Machinery and transport registered the highest value of traded commodities
Machinery and transport equipment topped in terms of the value of traded commodities with PhP 150.58 billion or 25.5 percent share to the total. This was followed by food and live animals valued at PhP 138.12 billion (23.4%) and manufactured goods classified chiefly by material which amounted to PhP 131.59 billion (22.3%). (Figure 5 and Table 1)
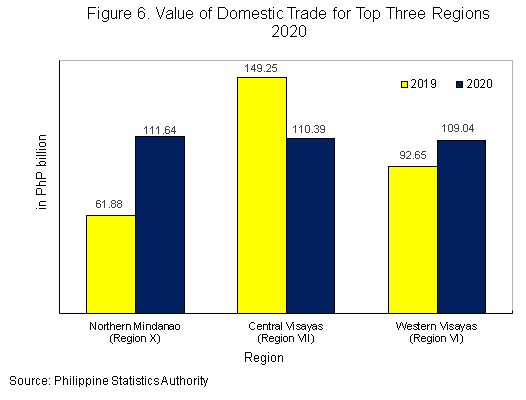
3. Northern Mindanao recorded the highest value of traded commodities
Among the regions, Northern Mindanao (Region X) ranked first with a total value of traded commodities of PhP 111.64 billion or 18.9 percent share to the total in 2020. Central Visayas (Region VII) came next with traded commodities amounting to PhP 110.39 billion (18.7%), followed by Western Visayas (Region VI) with PhP 109.04 billion (18.5%). (Figure 6 and Table 2)
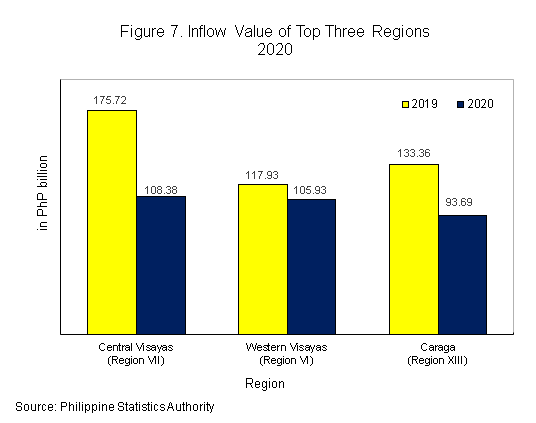
4. Central Visayas led in terms of inflow value
Inflow refers to the value of commodities that enters a specified region/province from other regions/provinces.
By region, Central Visayas (Region VII) posted the highest inflow value of domestic trade of PhP 108.38 billion or 18.3 percent share to the total in 2020. This was followed by Western Visayas (Region VI) with inflow value of PhP 105.93 billion (17.9%) and Caraga (Region XIII) with PhP 93.69 billion (15.9%). On the other hand, Cagayan Valley (Region II) had the lowest inflow value which amounted to PhP 3.05 million. (Figure 7 and Table 3)
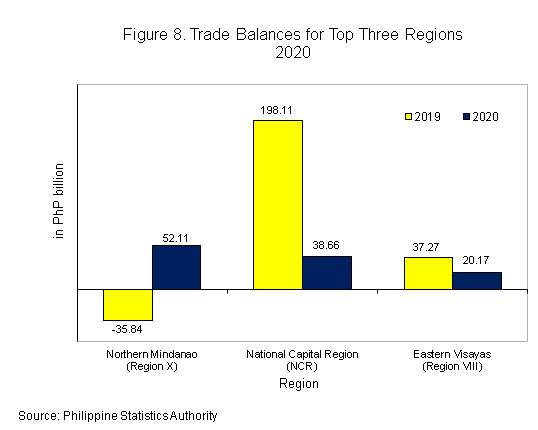
5. Northern Mindanao recorded the highest trade balance
The trade balance is the difference between the outflow value and inflow value.
The top three regions with favorable (positive) domestic trade balances in 2020 were the following:
a. Northern Mindanao (Region X), PhP 52.11 billion;
b. National Capital Region (NCR), PhP 38.66 billion; and
c. Eastern Visayas (Region VIII), PhP 20.17 billion.
On the other hand, the top three regions with unfavorable (negative) trade balances in 2020 were the following:
a. Caraga (Region XIII), PhP -76.54 billion;
b. Zamboanga Peninsula (Region IX), PhP -18.75 billion; and
c. CALABARZON (Region IV-A), PhP -16.72 billion. (Figure 8 and Table 3)
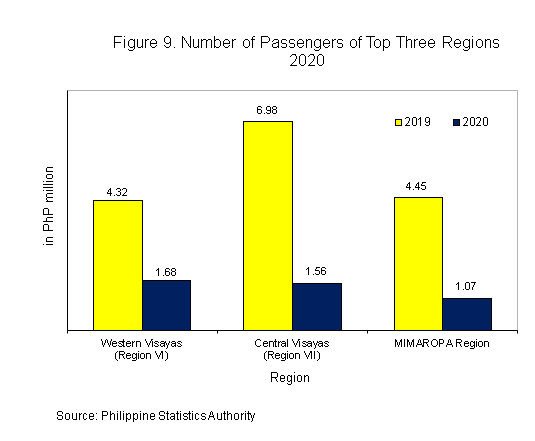
6. Total number of passengers dropped
The total number of passengers in 2020 based on received records was recorded at 7.28 million, all were transported via water (coastwise). This indicates a contraction of -74.1 percent from the 28.13 million passengers in 2019.
Western Visayas (Region VI) recorded the highest number of passengers in 2020 of 1.68 million. This was followed by Central Visayas (Region VII) with 1.56 million passengers and MIMAROPA Region with 1.07 million passengers. (Figure 9 and Table 4)
DENNIS S. MAPA, Ph.D.
Undersecretary
National Statistician and Civil Registrar General
EXPLANATORY NOTES
Overview
Commodity flow or domestic trade statistics is a compilation of data on commodities carried through air, rail, and water transport systems within a given country. However, in the Philippines, the Philippine Statistics Authority (PSA) compiles domestic trade carried through air and water only.
Data on the inflow and outflow of commodities in the different regions of the country are used to construct inter-regional and inter-industry relation tables. These serve as bases in the formulation and implementation of various regional development programs like countryside development and port planning.
The 1993 Philippine Standard Commodity Classification (PSCC), Revision 2 is used to classify the commodities at the 5-digit level (item) for coastwise statistics and 3-digit level (group) for air statistics.
Scope and Coverage
Domestic trade statistics contained in this report pertain to the flow of goods through airports and seaports in the country, whether for government or private use, or commercial purposes. It covers air trade and coastwise trade.
Goods and/or commodities that are excluded in the compilation of domestic data are the following:
a. Goods transported by vessels of the Philippine Navy;
b. Fishing ports;
c. Fish and other marine products landed directly from the sea;
d. Logistic goods intended for the vessel and the crew;
e. Cadaver; and
f. Vessels not carrying any cargo/passenger, wherein the vessel master indicates "NIL CARGO/ PASSENGER" in the coasting manifest or passenger documents.
Sources of Data
The source documents for the coastwise trade statistics are the coasting manifests and coastwise passenger manifests from major ports and other active seaports listed by the Philippine Ports Authority (PPA) all over the country. Air waybills, on the other hand, is the source document for air trade statistics issued by Philippine Airlines to every consignee.
Processing
All copies of documents are compiled and processed by the Provincial Statistical Offices (PSO) of PSA. The PSO submits monthly data files to the Central Office (CO) on or before the 30th day of the month.
Final data review of the data files, generation of statistical tables, and preparation of Special Releases are done at the CO, particularly in the Trade Statistics Division of the Economic Sector Statistics Service.
Dissemination
Annual Special Release on domestic trade statistics is published on the PSA website four months after the reference year. Quarterly releases are also published 60 days after the reference quarter.
Detailed data on domestic trade statistics are available at the TSD with telephone number (02) 8376-19-75 and email address tsd.staff@psa.gov.ph.
| Attachment | Size |
|---|---|
|
|
5.2 MB |
|
|
53.43 KB |