I. Introduction
The Seasonally Adjusted National Accounts (SANA) of the Philippines was first designated for generation and release in 1994 through the National Statistical Coordination Board (NSCB) Resolution No. 6, Series of 1994. By the virtue of Republic Act No. 10625, the Philippine Statistics Authority (PSA) was created to be the central statistical authority of the Philippine government on primary data collection. With this, the designation for generation and release of the SANA was later on adopted through the PSA Resolution No. 1, Series of 2017.
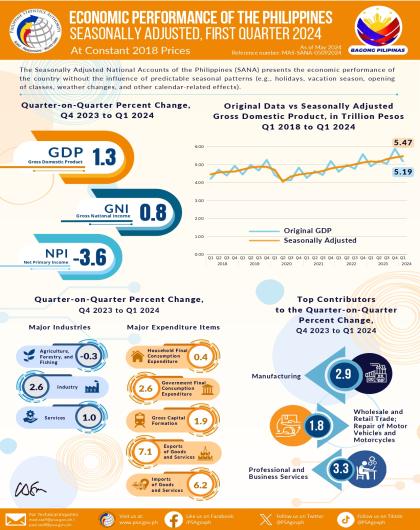
Through the Macroeconomic Accounts Service, the PSA, regularly releases the quarterly Gross Domestic Product (GDP) with the quarterly Seasonally Adjusted National Accounts (SANA) of the Philippines. The SANA presents the economic performance of the country without the influence of predictable seasonal patterns. It is a tool to identify the underlying trends revealing the true behavior of the series, compares quarter-on-quarter changes, and analyzes the seasonal effects in the series. It also provides early signals to the economic planners through quarter-on-quarter changes that will serve as a guide for better plans and decisions in maintaining the economic stability of the country.
The publication includes the Seasonally Adjusted GDP compiled at the production side and expenditure side. The GDP production and GDP expenditure and its components are compiled and presented by major industries and by major expenditure items including its details. The Seasonally Adjusted Net Primary Income and Gross National Income are also included.
II. Data and Data Sources
| Data | Source Agency/ Data Source | Schedule of Release/ Data Availability |
| Philippine Statistics Authority (PSA) | Every 6 years |
| PSA | Quarterly; 30 days after the reference quarter |
| PSA | Monthly; 35 days after the reference month |
| PSA | Triennial (every 3 years) |
| PSA | Monthly; 60 days after the reference month for the first two months; and 40 days for the third month of the reference quarter |
| PSA | Monthly; 40 days after the reference month |
| PSA | Monthly; 5 days after the reference month |
| PSA | Monthly; 45 days after the reference month |
| PSA | Monthly; 15 days after the reference month |
| PSA | Monthly; 30 days after the reference month |
| PSA | Monthly; 30 days after the reference month |
| PSA | Monthly |
| PSA | Annual |
| PSA | Monthly; 40 days after the reference month |
| PSA | Quarterly; 39 days after the reference quarter |
| PSA | Monthly; 40 days after the reference month |
| Department of Budget and Management (DBM) | Annual; Available at the beginning of the reference year |
| DBM | Annual; Available at the beginning of the reference year |
| DBM | Annual; Available at the beginning of the reference year |
| DBM | Quarterly; 30 days after the reference quarter |
| Commission on Audit | Annual; 9 months after the reference year |
| Public Private Partnership Center | Quarterly; 40 days after the reference quarter |
| Sugar Regulatory Administration (SRA) | Quarterly |
| SRA | Quarterly |
| Department of Science and Technology | Every 2 years |
| Department of Energy (DOE) | Monthly; 30-40 days after the reference month |
| DOE | Monthly; 30-40 days after the reference month |
| DOE | Monthly; 30 days after the reference month |
| DOE | Monthly; 30-40 days after the reference month |
| DOE | Monthly; 30-40 days after the reference month |
| DOE | Monthly; 30 days after the reference month |
| DOE | Annual; 3 months after the reference year |
| Mines and Geosciences Bureau | Monthly; 30 days after the reference month |
| National Grid Corporation of the Philippines | Quarterly; 40 days after the reference quarter |
| Meralco | Quarterly; 40-45 days after the reference quarter |
| Energy Development Corporation | Quarterly; 40-45 days after the reference quarter |
| Metropolitan | Quarterly; 40-45 days after the reference quarter |
| Bangko Sentral ng Pilipinas (BSP) | 45-50 days after the reference period |
| BSP | Monthly; 90 days after the reference month |
| BSP | Daily |
| BSP | Quarterly |
| BSP | Quarterly |
| Insurance Commission | 50-60 days after the reference period |
| Department of Transportation | Quarterly; 30 - 45 days after the reference quarter |
| Light Rail Transit Authority | Quarterly; 30 - 45 days after the reference quarter |
| Metro Pacific Investments Corporation | Quarterly; 30-40 days after the reference quarter |
| Philippine National Railways | Quarterly; 30-45 days after the reference quarter |
| Civil Aeronautics Board | Quarterly; 45-47 days after the reference quarter |
| Philippine Airlines (PAL) | Quarterly; 30-40 days after the reference quarter |
| PAL | Quarterly; 30-40 days after the reference quarter |
| Cebu Pacific, Inc. (Cebu Pac) | Quarterly; 30-35 days after the reference quarter |
| Cebu Pac | Quarterly; 30-40 days after the reference quarter |
| Philippine Ports Authority (PPA) | Quarterly; 25-30 days after the reference quarter |
| PPA | Quarterly; 25-30 days after the reference quarter |
| PPA | Quarterly; 25-30 days after the reference quarter |
| Department of Finance (DOF) | Quarterly; 90 days after the reference quarter |
| DOF | Quarterly |
| National Economic Development Authority | Quarterly |
| National Disaster Risk Reduction and Management Council | Quarterly; 30 days after the reference quarter |
| Department of Public Works and Highways | |
| Department of Public Works and Highways | Quarterly |
| Department of Tourism | Monthly; 60 days after the reference month |
| Tourism Infrastructure and Enterprise Zone Authority | Quarterly; 30 days after the reference quarter |
| Philippine Overseas Employment Administration | Monthly; 30 days after the reference month |
| Federation of cattle Raisers Associations of the Phils | Quarterly |
| Fertilizer and Pesticide Authority | Weekly |
| Philippine Carabao Center | Quarterly |
| Food and Agriculture Organization | Quarterly |
| Philippine Stock Exchange | Quarterly; 40-45 days after the reference quarter |
| World Bank | Monthly; 15-20 days after the reference month |
| US Bureau of Labor Statistics | Monthly; 15-20 days after the reference month |
III. Methodology
III.1. Basic Framework
The Philippine Statistics Authority currently uses the internationally recommended seasonal adjustment method which is the X-13ARIMA-SEATS, a seasonal adjustment software program developed and maintained at the U.S. Census Bureau.
The X-13ARIMA-SEATS
The SEATS (Signal Extraction in ARIMA Time Series) seasonal adjustment method available in X-13ARIMA-SEATS uses parameter estimates from autoregressive integrated moving average (ARIMA) models to filter the series and derive the seasonal factors and other components.
The decomposition model for the series may be multiplicative or additive. The multiplicative model assumes dependence between the components therefore monthly seasonal factors for the multiplicative model are ratios with all positive values. Meanwhile, additive decomposition assumes independence of the components, thus seasonal factors may represent positive or negative deviations from the original series. The seasonally adjusted series may exhibit negative values depending on the resulting decomposition of the trend-cycle, seasonal, and irregular component.
Indirect Method for Seasonal Adjustment
In the Seasonally Adjusted National Accounts, the quarterly GDP is generated using Indirect Approach or by seasonally adjusting the 80 sub-industries and summing the seasonally adjusted components to produce indirect seasonal adjustment aggregates. Hence, the seasonally adjusted GDP is derived at the production side.
Moreover, the expenditure items are also seasonally adjusted independently and aggregated to major expenditure categories.
The seasonally adjusted Gross National Income is also derived by adding the seasonally adjusted GDP and Net Primary Income.
Quality Measures
Decomposition of the (preadjusted) series should be conducted using either the moving average X-11 method or the model-based SEATS method. The X-13ARIMA-SEATS program, which implements both X-11 and SEATS, is the recommended procedure for seasonal adjustment in the Quarterly National Accounts.
To examine the reliability of the estimates, the Quality Statistic (Q-statistic) is measured for each adjusted series.
IV. Concepts and Definition of Terms
A Time Series is a set of observations on a variable measured or recorded chronologically with equal intervals.
Seasonality (seasonal component) is a regular fluctuation with similar patterns and magnitude that repeatedly occur within a calendar year and normally observed for high frequency data such as monthly and quarterly series.
Seasonal adjustment is a statistical technique to remove the effects of seasonal calendar influences operating on a time series.
V. Dissemination of Results
The Seasonally Adjusted National Accounts is included in the PSA System of Designated Statistics, indicated to be released 40 days after the reference period, except Q4, which is to be released 30 days after the reference period. The following schedules are the releases of SANA based on the Advance Release Calendar of PSA:
| SANA Report | Schedule of Release |
| Quarter 4 of the Previous Year | January of the Current Year |
| Quarter 1 of the Current Year | May of the Current Year |
| Quarter 2 of the Current Year | August of the Current Year |
| Quarter 3 of the Current Year | November of the Current Year |
The web release materials include press release, statistical tables, infographics, publication report, and social cards.
VI. Citation
Philippine Statistics Authority. (2023). Technical Notes on the Seasonally Adjusted National Accounts of the Philippines. https://psa.gov.ph/statistics/technical-notes
VII. Contact Information
Mr. Marck C. Pascasio
Chief Statistical Specialist)
Expenditure and Integrated Accounts Division
(02) 8376-1982
m.pascasio@psa.gov.ph
For data request, you may contact:
Knowledge Management and Communications Division
(02) 8462-6600 loc. 820
info@psa.gov.ph | kmcd.staff@psa.gov.ph