1. What is PPA and why is it important?
  • Provincial Product Accounting (PPA) is an accounting framework, which is aligned with the Philippine System of National Accounts (PSNA), that aims to present a comprehensive picture of the provincial and Highly Urbanized City (HUC) economies.  

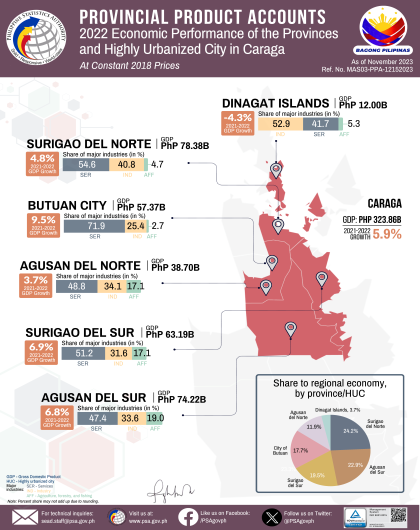
  • Through the PPA, the Gross Domestic Product (GDP) or the economic performance of the provinces and HUCs are estimated.

  • This will serve as an important tool in economic planning and policy formulation at the subregional levels to supplement the GDP at the national and regional levels or the Gross Regional Domestic Product (GRDP)

  • By providing a more appropriate measure and assessment of a province’s economic performance, the PPA is viewed to strengthen the planning and decision-making of provincial policymakers and other stakeholders.

2. How is GDP of the province/HUC computed?
  • The GDP at the provincial and HUC level is computed by Production Approach.

  • That is, GDP of the province/HUC is measured from the perspective of the producers of goods and services.  It covers the value of goods and services produced in the province/HUC during the reference period.
    In this approach, GDP measures the contribution of the 16 production industries, namely:

- Agriculture, forestry and fishing;
- Mining and quarrying;
- Manufacturing;
- Electricity, steam, water, and waste management;
- Construction;
- Wholesale and retail trade; repair of motor vehicles and motorcycles;
- Transportation and storage;
- Accommodation and food service activities;
- Information and communication;
- Financial and insurance activities;
- Real estate activities;
- Professional, and business services;
- Public administration and defense; compulsory social activities;
- Education;
- Human health and social work activities; and
- Other services.

  • Descriptions and details of these industries can be found in the Philippine Standard Industrial Classification (PSIC)

3. What have we done so far with the Provincial Product Accounts?
ActivitiesObjectives
  • Briefing and consultative workshop with the stakeholders in the regions and provinces
  • Gather data users, data producers, and other stakeholders in the regions and provinces.

  • Understanding the concepts and overview of the SNA and provincial accounting

  • Preliminary data inventory and gather stakeholder’s perception on their province or HUC’s economy

  • Workshop/Training for PSA RSSO and PSO Staff from Data to Benchmark and Non-benchmark Accounts Estimation
  • Training of technical staff of PSA Regional and Provincial Offices

- Basic concepts of national accounting

- Data needs by industry

- Translating data to accounts

- Filling data gaps

- How to analyze national accounts

  • Data Assessment Workshop with the Pilot Regions
  • Evaluation of data collection methods and administrative forms and discuss data availability and data gaps by province by industry

  • Consultation and Validation of Estimates with the Stakeholders in the Pilot Regions and Provinces
  • Filling in data gaps

  • Presentation of initial results

  • Validation of results

  • Dissemination Forum
  • Presentation of final results to major stakeholders including partner agencies, LGUs, media, academe, and other stakeholders

4. What are your plans for the PPA compilation?

It is envisioned that the PPA will be institutionalized in all regions in the country, covering all provinces and Highly Urbanized Cities (HUCs) by 2025. New group of pilot regions will be added every year to compile the PPA. These regions are listed in the table below.

YearPilot RegionsTotal Regions/Provinces covered
2021MIMAROPA, Region VII and Region X3 Regions, 14 Provinces, 6 HUCs
2022CAR, Region IV-A, Region VI, Region VIII, Region XI, Region XII9 Regions, 46 Provinces, 13 HUCs
2023Region I, Region II, Region III, Region V, Region IX, Region XIII and BARMM16 Regions, 82 Provinces, 17 HUCs
2024NCR17 Regions, 82 Provinces, 17 HUCs, 17 NCR Districts including the Municipality of Pateros
2025 and beyond All regions and HUCs
5. How to analyze PPA?

The GDP of the provinces/HUCs are analyzed according to the following indicators:

IndicatorsExplanation
Levels (at current prices)
  • Value of additional goods and services produced by each industry or the province/HUC as a whole during the period valued at current market prices.

Levels (at constant 2018 prices)
  • Value of additional goods and services produced by each industry or the province/HUC as a whole during the period valued at the base year 2018 prices.

  • This is derived to serve as a basis of real economic growth of the province/HUC.

  • The levels valued at constant prices removed the effect of the movement of prices during the period, thus, more reliable to determine the real measure of economic growth during the period.

Growth rates (%)
  • Analyzed based on the constant prices to show the movement of the economy relative to the previous period. That is, if the economy grows faster (accelerated) or slower (decelerated), or declines (contracted) compared to the previous period.

Percent share
  • Share of the component relative to the total, e.g.

- share of industries to total GDP of the province/HUC;

- share of provincial/HUC to total regional GDP (GRDP)

Contribution to growth (percentage point/s)
  • Impact of the component relative to the growth of the total or the importance of the component to the total e.g.

- contribution of industry to total provincial/HUC GDP growth rates at constant prices

- contribution of the province/HUC to total GRDP growth rate at constant prices

  • This represents the combined effect of the size of the component (percent share) and the movement (growth rates)

Implicit Price Index (IPIN)
  • The ratio between the levels at current prices and the constant prices

  • Represents the aggregate measure of the movement of pricesof production in the economy relative to the base year. That is, a value higher than 100 indicates prices are higher than the base while a value less than 100 indicates otherwise.

  • On the production side, the IPIN was derived based on two components:

- price movement indicators for production of output, e.g., farmgate prices, producer prices;

- aggregate measure of prices for the inputs used in the production process, e.g., the combination of prices of petroleum, electricity, rentals, etc.

Per Capita levels (at current prices)
  • Levels at current prices divided by the population

  • The estimated average contribution of each individual to the total at current prices, e.g., GDP per capita by province/HUC

Per Capita levels (at constant prices)
  • Levels at constant prices divided by the population

  • The estimated average contribution of each individual to the total at constant prices, e.g., GDP per capita by province/HUC

  • This is derived to serve as a basis of real per capita growth rate

6. What are the considerations in the choice of 2018 as the base year?
  • The choice of a more updated base year improves the measure of economic growth. The measure becomes more accurate if the base year is not too far back.

  • The main criterion was the availability of comprehensive data from censuses and surveys including administrative data to serve as bases for the compilation of the benchmark levels.

  • Availability of data for the base year became an important consideration which includes the following:

- 2018 Census of Philippine Business and Industry (CPBI);
- 2018 Family Income and Expenditure Survey (FIES);
- 2018 Updated List of Establishments;
- 2018 Input-Output Survey of Philippine Business and Industry (IOSPBI);
- 2018 Labor Force Survey (LFS);
- 2018 Reports of the Commission of Audit (COA) for Government operations
- 2018 Revised and rebased Value of Production for Agricultural Commodities;
- 2018 Financial Statements of National Government and Local Government Units including Government-Owned and Controlled Corporations (GOCCs);
- 2018 Private Financial Statements;
- 2018 Re-referenced prices/price indices e.g., consumer prices, producer prices, retail prices, wholesale prices, construction materials prices, farm prices, international prices, world prices, etc.
- 2018 Exports and Imports Data (updated and re-run series)

7. What are the major data sources in PPA?
  • Data are sourced from both survey and administrative sources.

  • Major sources for the benchmark estimates include: Census of Philippine Business Industry (CPBI), Updated list of establishments (ULE), Family Income and Expenditure Survey (FIES)

  • Figure 1 shows the list of major data sources for PPA compilation.


8. How do you ensure the accuracy and reliability of the data?
  • The national accounts compilation follows a Framework – an internationally agreed framework on the System of National Accounts. The latest one is the 2008 SNA. This comprises a comprehensive, consistent, and integrated set of accounts that record economic activities within a given period.

  • The PSNA follows this Framework in terms of concepts, classification of economic activities, scope and coverage, and other statistical and accounting principles.

  • The SNA also serves as a framework for identifying data gaps/weaknesses as well as inconsistencies in data.

9. Who are the major users of the PPA and what are its uses and applications?
  • In general, the PPA is a tool or means to strengthen the decision-making, planning, program and policy formulation in the local level. The PPA are used by the:

- Provincial/Municipal Planning Development Office (i.e., for budget, programming and setting);
- Local government executives (i.e., governors, mayors);
- Researchers/academe which evaluates, analyzes, and monitors existing programs and policies at the local level;
- Sectoral agencies, e.g., Department of Agriculture, Department of Trade and Industry, etc.

10. What is the difference between Agricultural Statistics (AgStat) and Gross Value Added of Agriculture, Forestry and Fishing (AFF)
  • The value of agricultural statistics is the gross output of the agriculture sector. It is reported as volume prices and value of production by commodity.

  • Meanwhile, Gross Value Added in the agriculture industry represents the contribution of the industry to the GDP by taking away the intermediate consumption or the inputs used during the production process.

  • By taking out the intermediate consumption, GVA represents the unduplicated value of Agriculture as an industry or a newly created goods and services.

11. What is the difference between different price indices and the Implicit Price Index (IPIN) in the national accounts?
  • Price indices such as the Consumer Price Index (CPI), Wholesale and Retail Price Indices, and Producer Price Index (PPI) measure changes in the price level of a fixed market basket of goods and services. For the CPI, the market basket is composed of goods and services purchased by households. For PPI, it measures the average changes in prices received by domestic producers for their output.

  • The Implicit Price Index (IPIN), which can also be called as GDP Price Index, is a measure of the aggregate movement of prices of all goods and services produced in the economy in a given period and is not based on a fixed basket of goods.

  • The users should carefully look at what each price index represents to guide in the analyses.

12. Are tourism activities included in the PPA?
  • Tourism activities are included in the accounting of the GDP of the provinces/HUCs. There are a handful of industries in tourism such as the Transportation industry, Accommodation and Food Service Activities, and Other Services.

  • For more information on tourism, the Philippine Statistics Authority also publishes the Tourism Satellite Accounts at the national level and an initial pilot compilation for regions in Luzon and Visayas.

  • PTSA is a framework used to measure the contribution of tourism to the Philippine economy.

13. How are exports related to GDP?
  • By definition, GDP means that all production activities happening in the province/HUC are accounted for. Exports on the other hand are produced goods and services in the province/HUC for consumption outside the economy, be it in the international market or for consumption of other provinces or regions.

14. Are investment activities included in the PPA?
  • Investments include capital formation in construction, durable equipment, breeding stocks and orchard development, and intellectual property products.

  • The production of these products is included in PPA through construction, manufacturing, agriculture, and services.

15. Is the contribution of Small and Medium Enterprises (SMEs) included in PPA?

The contribution of SMEs is implicitly accounted in the estimation of PPA. These are captured in the establishment-based surveys conducted by PSA which are inputs during the estimation. In addition, the FIES provides information on household economic activities.

16. Are we including the informal activities in the PPA estimates?
  • Yes. In the estimation of the PPA estimates, the informal activities are accounted. Using the household-based surveys of the Family Income and Expenditure Survey (FIES) these activities are incorporated i.e., street peddling, shoe shining, tailoring, own-account worker, etc. 
  • Questions about income are included in these surveys hence, implicitly, illegal trades i.e., drugs, gambling, kidnapping, and prostitution among others are indirectly considered in the regional estimates. However, details on income by type of illegal activities cannot be determined. 
  • Operationally, these are termed “unorganized activities” in the Philippine System of National Accounts (PSNA).
17. What are the differences between PPA and income derived from FIES?
  • PPA covers the monetary value of all final goods and services produced in the province or HUC within the period.

  • FIES covers the income of residents, regardless of where and how the income was earned:

- Primary income: salaries and wages, commissions, tips, bonuses, family and clothing allowances, transportation and representation allowances, honoraria, and other forms of compensation; and net receipts derived from the operation of family-operated enterprises or activities, and practice of a profession or trade. 
- Income from other sources: imputed rental values of owner-occupied dwelling units, interests, rentals including landowner's share of agricultural products, pensions, support, and value of food and non-food items received as gifts by the family (as well as the imputed value of services rendered free of charge to the family). Also included as part of family income are receipts from family sustenance activities which are not considered family-operated enterprises.

18. What is the relation between PPA and poverty statistics?
  • We usually think that economic growth is related to poverty reduction. It is expected that sustained growth could result in better income and lower poverty in the provinces in the long run. In the short run, however, high growths may not translate to lower poverty incidences. GDP and poverty incidence measure different aspects of society.

  • GDP measures economic output while poverty describes welfare and living standards. Sustained economic growth would reduce poverty and improve income levels among the poorest remains a challenge to both policymakers and planners, and only with quality statistics that poverty programs can be effectively implemented.