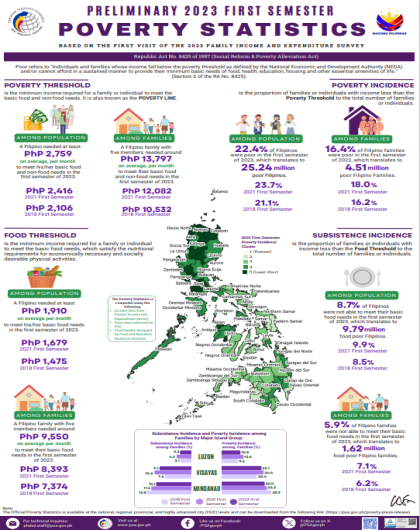
Preliminary 2023 First Semester Official Poverty Statistics
TECHNICAL NOTES ON THE OFFICIAL POVERTY ESTIMATION METHODOLOGY
I. REFINEMENTS IN THE OFFICIAL POVERTY ESTIMATION METHODOLOGY
The first official methodology for the poverty assessment in the Philippines was adopted in 1987. Three major refinements in the official methodology for measuring poverty have been made – in 1992, 2003/2005/2006 and 20 11.
One major feature of the first refinement in 1992 was the exclusion of alcohol, tobacco, recreation, durable furniture and equipment as well as other miscellaneous expenditures in the list of basic non-food requirements considered in the determination of the poverty line/threshold. Poverty line/threshold refers to the minimum income/expenditure required to meet the basic food and non-food requirements.
In 2003, another improvement was introduced in recognition of the need for poverty estimates with lower levels of disaggregation, specifically at the provincial level. Using the same regional food bundles in the 1987 and 1992 methodologies developed by the Food and Nutrition Research Institute (FNRI), provincial food thresholds were generated using actual provincial prices collected by then National Statistics Office, which is now part of the Philippine Statistics Authority (PSA).
The latest refinements in the official poverty estimation methodology were approved through the PSA Board Resolution No. 1, Series of 2017-171, Approving the Refinements in the Official Poverty Estimation Methodology, to address some issues/concerns raised on the estimation of food and poverty thresholds, incidence and other measures of poverty, the relevance of official poverty statistics and the comparability of poverty estimates across space and over time. The refinements were based on the recommendations of the Technical Committee on Poverty Statistics (TC PovStat), the group designated to develop/formulate the official poverty estimation methodology. This methodology has been used since its approval in 2011.
One of the major issues addressed in the latest methodology is the comparability of the poverty estimates across space and over time. It has been argued by many poverty analysts that it is important that the yardsticks be consistent across provinces for the estimates to be valid in targeting government beneficiaries. Part of the PSA Board Resolution that approved the methodology is the provision that the methodology shall be reviewed every ten (10) years to ensure relevance and accuracy. Hence, the TC PovStat, through the coordination of the PSA, shall start the review/development
II. COMPILATION METHODOLOGY
A. Unit of Measure
1. Food threshold – in current pesos (usually, per capita or per person per year)
2. Subsistence incidence – in percent for a reference year
3. Poverty threshold – in current pesos (usually, per capita or per person per year)
4. Poverty incidence – in percent for a reference year
B. Coverage
1. Food threshold – national, regional and provincial (with urban-rural areas)
2. Subsistence incidence – national, regional, provincial, HUC
3. Poverty threshold – national, regional and provincial (with urban-rural areas)
4. Poverty incidence - national, regional, provincial, HUC
5. Other measures of poverty (poverty gap, income gap, severity of poverty) - national, regional, provincial, HUC
C. Estimation and Compilation Methodology
1. Estimation of Food Threshold
a) The use of a national reference food bundle as starting point – to enhance comparability across space.
b) The national reference food bundle was converted to province-specific food bundles, which were used to estimate the provincial food thresholds. These provincial food bundles were formulated by nutritionists from the Food and Nutrition Research Institute and were subjected to the Test of Revealed Preferences such that the food bundle of a province will have the cheapest cost in comparison with the bundles of other provinces. The provincial food bundles have the following characteristics:
• Nutritionally adequate, i.e., it satisfies the 100% Recommended Energy and Nutrient Intakes (RENI) for energy and protein and 80% RENI for other vitamins and minerals;
• Food items in the food bundle are locally available and eaten in the area (in the province);
• Least cost in the province; and
• Visualizable (i.e., can be cooked together and fit for human consumption).
c) Sources of data:
• Provincial food bundles developed by FNRI
• Retail price surveys for agricultural and non-agricultural commodities, by province, PSA
• Farm prices survey (for agricultural commodities), by province, PSA
• Proportion of food bought and own-produced components: Food Consumption Survey, FNRI
d) General Procedures:
• Each of the ingredients in the food bundle is priced using the available price data
• The urban and rural food thresholds for each of the provinces, which have bought and own-produced components, are computed.
• The provincial urban/rural annual per capita food threshold/line is computed as:
FT = (cost per capita of the one-day food bundle) x (30.4 days/month)
x 12 months
2. Estimation of Subsistence Incidence
• Given the provincial urban-rural food threshold, the subsistence incidence is computed as:
where:
![]()
F = weighted total number of families (individuals) with annual per capita income less than the provincial urban-rural annual per capita food threshold/line
n = weighted total number of families (individuals) in the province
3. Estimation of Poverty Thresholds
a) As common practice in most countries, the non-food component is measured indirectly due to the difficulty of determining the required bundle for the non-food items.
b) To ensure comparability across space and over time, the ratio of food expenditures (FE) to total basic expenditures (TBE) of a reference family (families whose per capita income is around the food threshold) is held constant for a certain period. The average of the nationally determined FE/TBE ratio from the FIES in 2000, 2003, 2006 and 2009, which is equivalent to 0.6983, has been used since 2009 and will still be used until 2021.
c) Sources of data:
Family Income and Expenditure Survey
d) General Procedures:
The urban/rural provincial poverty threshold is computed by dividing the food threshold with the FE/TBE ratio.
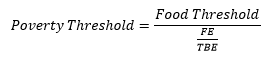
where:
FE/TBE=0.6983
FE = actual food expenditure of families within the +/- ten percentile band of the subsistence incidence among families
TBE = total basic expenditure of families within the +/- ten percentile band of the subsistence incidence among families.
TBE is an aggregate of expenditures on
food;
clothing and footwear;
fuel; light and water;
housing maintenance and other minor repairs;
rental of occupied dwelling units;
medical care;
education;
transportation and communication;
non-durable furnishing;
household operations; and
personal care and effects
4. Estimation of Poverty Incidence
• Given the provincial urban-rural poverty threshold, the poverty incidence is computed as:
![]()
where:
Q = weighted total number of families (individuals) with annual per capita income less than the annual per capita poverty threshold/line
n = weighted total number of families (individuals)
5. Estimation of other measures of poverty such as Income Gap (I), Poverty Gap (PG) and Severity of Poverty (SP)
Income Gap
- the weighted average income shortfall (expressed in proportion to the poverty threshold) of families/individuals with income below the provincial urban-rural poverty threshold.
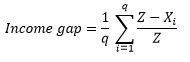
where:
Z = provincial urban-rural per capita poverty threshold/line
X_i = per capita income of the ith family
q = number of families below the poverty threshold
Poverty Gap
- the weighted total income shortfall (expressed in proportion to the poverty threshold) of families/ individuals with income below the poverty threshold divided by the weighted total number of families/ individuals
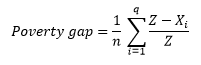
where:
Z = provincial urban-rural per capita poverty threshold/line
X_i = per capita income of the ith family
q = number of families below the poverty threshold
n = total number of families
Note: The difference between the income gap and the poverty gap is the use of number of poor families/ individuals as denominator for the income gap. For the poverty gap, the total number of families/individuals is used.
Severity Gap
- the weighted total of the squared income shortfall (expressed in proportion to the poverty threshold) of families/ individuals with income below the poverty threshold, divided by the weighted total number of families/ individuals
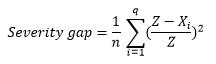
where:
Z = per capita poverty threshold/line
X_i = per capita income of the ith family
q = weighted total number of families below the poverty threshold
n = weighted total number of families
6. Measures of Precision
a. The official poverty statistics shall be released with measures of precision such as standard errors, confidence intervals and coefficients of variation.
b. Ranking of provinces shall not be released due to overlapping confidence intervals. Clustering of provinces based on the poverty measures, such as poverty incidence among families, shall be done instead.