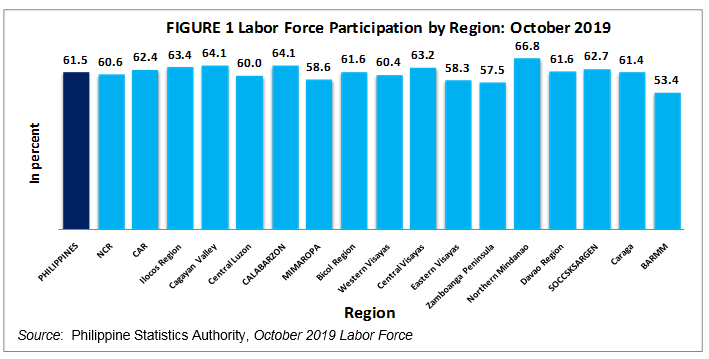
More than 60 percent of the population 15 years old and over are in the labor force
Of the estimated
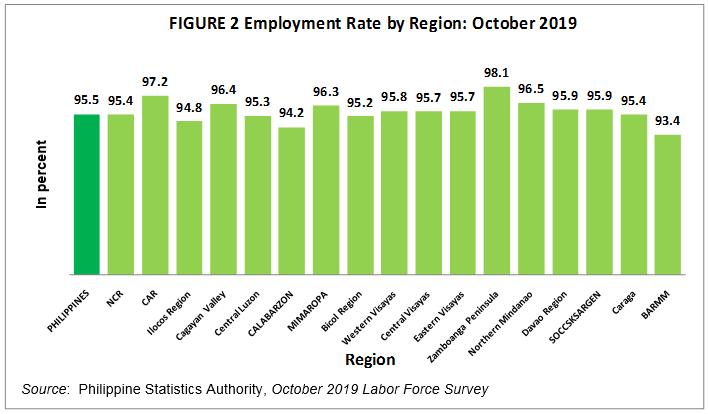
Employment rate registers at 95.5 percent
The total number of employed persons in
Region IX (Zamboanga Peninsula) had the highest employment rate with
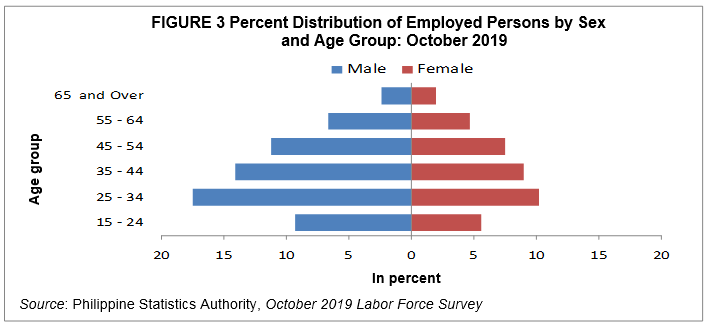
More males are employed than females
More than sixty percent (61.3%) of the estimated 43.1 million employed persons in
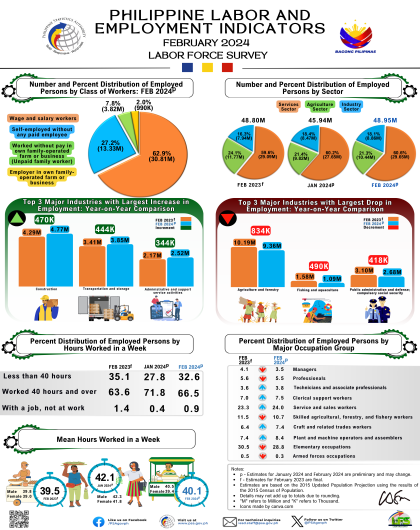
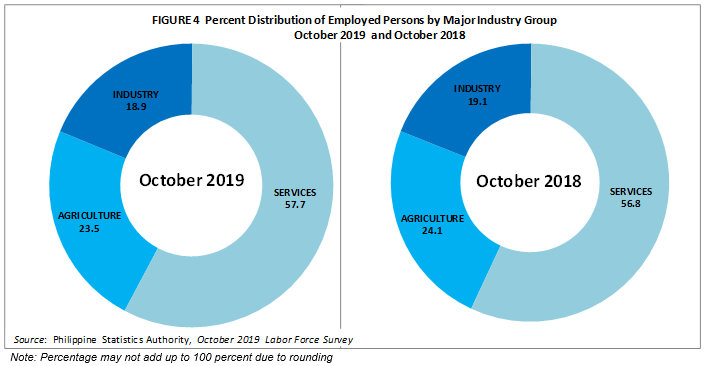
More than half of employed persons are in the services sector
Employed persons in the services sector remained the highest group estimated at
The share of the industry sector to total employment posted a decrease of 0.2 percentage points, from a contribution of
Among workers in the services sector, those engaged in wholesale and retail trade; repair of motor vehicles and motorcycles made up the largest percentage with
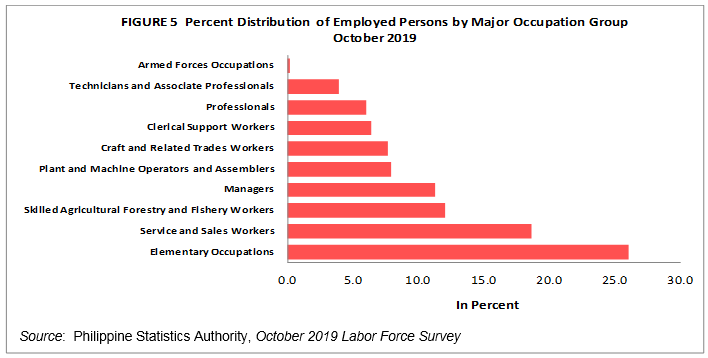
More than one-fourth of employed persons are in elementary occupations
Across occupation groups, workers in elementary occupations made up the largest percentage of
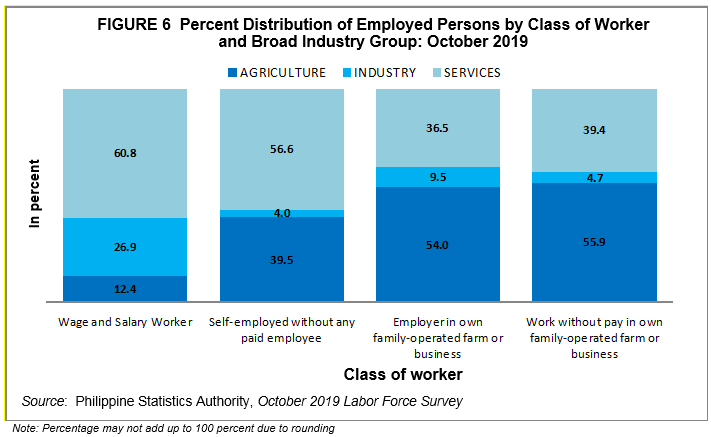
Majority of employed persons are wage and salary workers
Employed persons were categorized as wage and salary workers, self-employed without any paid employee, employer in own family-operated farm or business and unpaid family workers.
Wage and salary workers are those who work for private households, private establishments, government and government-controlled corporations and those who work with pay in own family-operated farm or business. In
Classified according to broad industry group,
Majority of employed persons work full-time
Employed workers are classified as either full-time or part-time workers. Full-time workers are those who work for
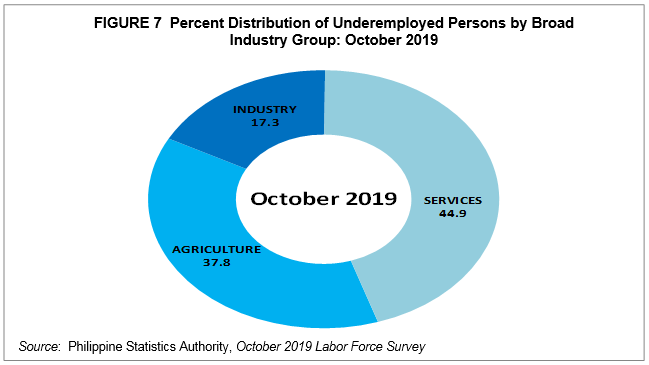
Underemployment rate is registered at 13.0 percent
Underemployed persons were estimated at
Among the broad industry group, underemployed persons were highest in the services sector at
Visibly underemployed, or those persons who had been working for less than
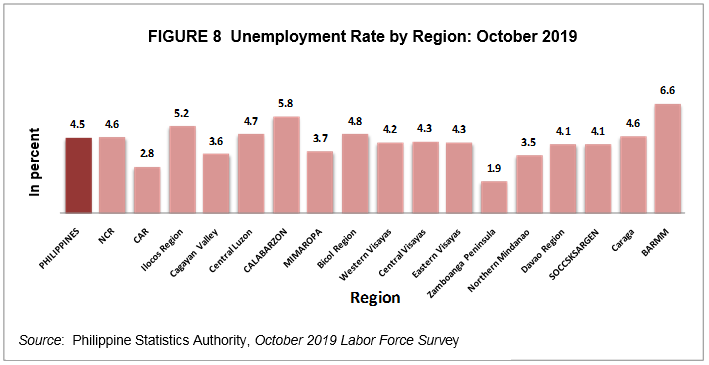
Unemployment rate is recorded at 4.5 percent
Of the total
The regions with unemployment rates higher than the national figure of
Unemployed persons were highest in
Across educational groups,
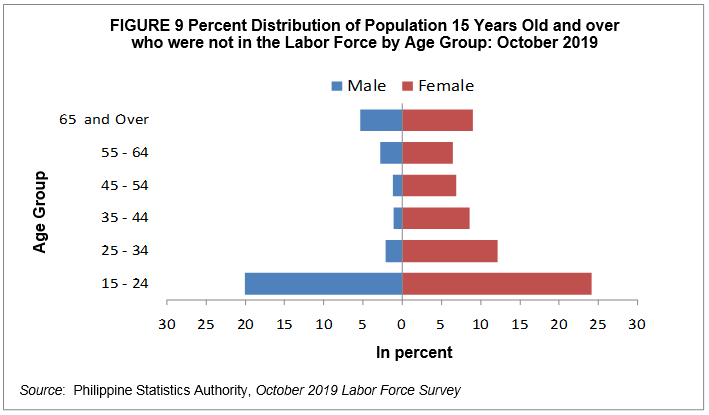
Majority of persons not in the labor force are women
Thirty-eight percent of the
By age group,
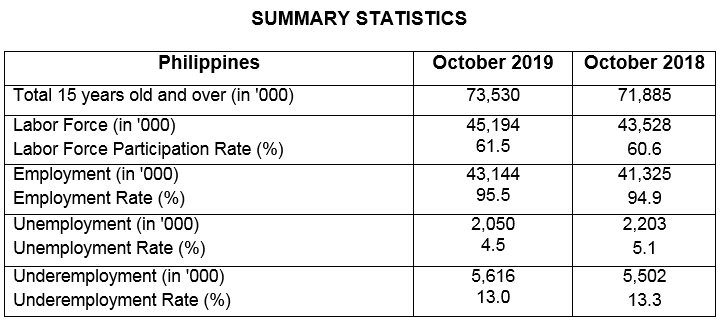
- The labor force population in October 2019 was estimated at
45.2 million. This translates to a labor force participation rate (LFPR) of61.5 percent. - Total employed persons were approximately
43.1 million, resulting to a national employment rate of95.5 percent. - More than half (57.7%) of the total employed were in the services sector,
23.5 percent were in the agriculture sector, and18.9 percent were in the industry sector. - Workers in elementary occupations made up the largest proportion of employed persons as they comprised
26.0 percent of the total employed population. - The total unemployed persons was 2.1 million which translates to an unemployment rate of
4.5 percent. - Underemployment rate was estimated at 13.0 percent.
(Sgd.) CLAIRE DENNIS S. MAPA, Ph.D.
Undersecretary
National Statistician and Civil Registrar General
TECHNICAL NOTES
The Labor Force Survey (LFS) is a nationwide quarterly survey conducted by the Philippine Statistics Authority (PSA) during the months of January, April, July, and October. For this release, the data being presented are based on the final results of the
The reference period used in the survey is the past seven (7) days preceding the date of interview of the enumerator.
The concepts and definitions used in the survey can be found in PSA Integrated Survey of Households (ISH) Bulletins. Some are given below:
a. Labor Force – refers to the population 15 years old and over who contribute to the production of goods and services in the country. It comprises the employed and unemployed.
b. Employed – refers to persons in the labor force who are reported either as at work or with a job or business although not at work. Persons at work are those who did some work, even for an hour during the reference period.
c. Unemployed – refers to persons in the labor force who are reported as:
1. without work; and
2. currently available for work; and
3. seeking work or not seeking work due to the following reasons:
i. belief that no work is available, or
ii. awaiting results of previous job application, or
iii. because of temporary illness or disability, or
iv. bad weather, or
v. waiting for rehire or job recall.
d. Underemployed – refers to employed persons who express the desire to have additional hours of work in their present job or an additional job, or a new job with longer working hours.
e. Labor Force Participation Rate (LFPR) – refers to the proportion of total labor force to the total household population 15 years old and over.
f. Employment Rate – refers to the proportion of employed persons to the total labor force.
g. Unemployment Rate – refers to the proportion of unemployed persons to the total labor force.
h. Underemployment Rate – refers to the proportion of underemployed persons to total employed persons.
TECHNICAL NOTES (concluded)
- Starting January 2012 LFS, the codes for industry adopted the 2009 Philippine Standard Industrial Classification (PSIC). Prior to this, codes for industry used the 1994 PSIC.
- Question on vocational course was introduced in the January 2012 Labor Force Survey (LFS) questionnaire.
- Starting April 2016 round, the LFS adopted the 2013 Master Sample Design, with a sample size of approximately 45,000 households.
- The 2012 Philippine Standard Occupational Classification (PSOC) was adopted starting April 2016. The 1992 PSOC had been used prior to April 2016.
- Starting with the April 2016 LFS round, the population projections based on the 2010 Census of Population and Housing (2010 CPH) was adopted to generate the labor force statistics.
- Overseas Filipino Workers are not considered part of the labor force in the Philippines. Hence, in the LFS, data on economic characteristics of household members who are overseas workers are not collected. In LFS reports, they are excluded in the estimation of the size of working population, that is, population aged 15 years and older, and in the estimation of the labor force.