
The 2021/2022 Integrated Survey on Labor and Employment covers formal establishments employing at least 20 workers. This module provided information on the occupational accident, occupational injuries, occupational diseases, and commuting accident occurred in the workplace.
1. Occupational Accident and Occupational Injuries
1.1. Work-related accidents declined by 36.3 percent in 2021
a. In 2021, of the total 36,342 establishments employing 20 or more workers, 9.1 percent or 3,322 establishments reported to have occupational accidents. This is a decrease from the 10.9 percent or 4,186 establishments with occupational accidents out of the 38,305 total establishments in 2019. (Table 1)
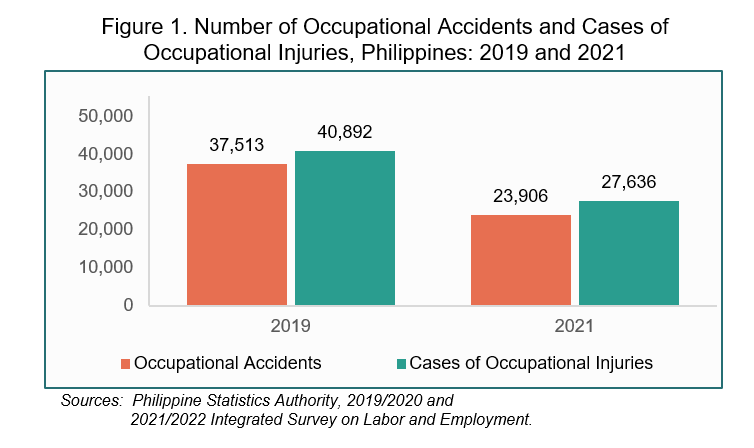
b. Occurrences of occupational accidents were reported to be at 23,906 in 2021 which is a 36.3 percent decrease from the recorded 37,513 occurrences of work-related accidents in 2019. (Figure 1 and Table 1)
c. As a result of occupational accidents, a total of 27,636 cases of occupational injuries was recorded across the industries and regions in 2021, representing a decrease of 32.4 percent from the 40,892 cases in 2019. (Figure 1 and Table 1)
d. Among the cases of occupational injuries, there were only 169 (0.6%) fatal cases with workdays lost, while 11,907 (43.1%) were non-fatal cases with workdays lost or cases that resulted in absence from work. More than half or 15,560 (56.3%) of the reported injuries in the workplace were cases without workdays lost, or those cases that required first-aid or medical treatment only on the day of the accident, and the employees were able to resume to work one day after the accident. (Table 1)
e. By major industry group, the highest share of occupational injuries with workdays lost was observed in Manufacturing, which accounted for 41.7 percent of the 12,076 total cases. This was followed by Agriculture, Forestry and Fishing with 12.4 percent and Administrative and Support Service Activities with 11.7 percent. (Table 2)
f. By region, National Capital Region (NCR) reported the highest share with 25.0 percent or 3,018 cases of work-related injuries with workdays lost. This was followed by Region III - Central Luzon with 14.3 percent and Region XI - Davao Region with 10.7 percent. (Table 3)
1.2. Measures of Safety Performance of Occupational Injuries
a. The country’s safety performance in the workplace is assessed through the computation of frequency, incidence, and severity rates of occupational injuries. The overall frequency rate of occupational injuries was recorded at 0.97 in 2021, which shows a decrease from 1.26 in 2019. This implies that only one case of occupational injury with workdays lost was reported per 1,000,000 employee-hours of exposure.
b. Further, the overall incidence rate in 2021 was registered at 2.30, which also decreased from the recorded incidence rate of 3.07 in 2019. The incidence rate indicates that there were about two cases of occupational injuries with workdays lost per 1,000 workers in 2021.
c. The overall severity rate was posted at 5.33, which means that there were about five workdays lost in cases of occupational injuries resulting in temporary incapacity per 1,000,000 employee-hours of exposure. (Table 4)
1.3. Cases of Occupational Injuries with Workdays Lost by Classification
1.3.1. Type of Injury
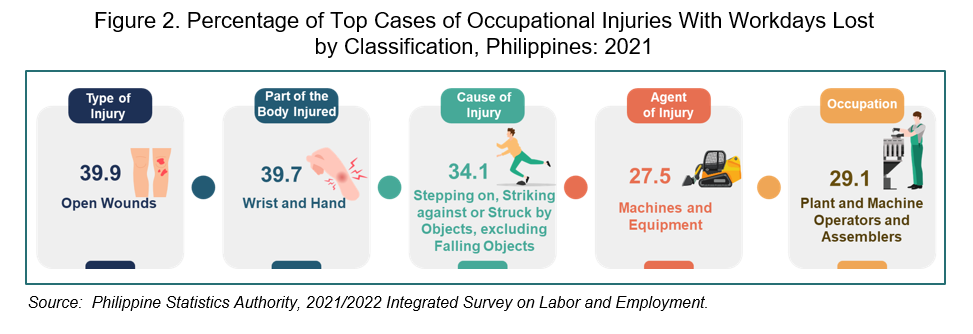
Open wounds were reported as the most common type of occupational injuries, contributing 39.9 percent of the total 12,076 cases of occupational injuries with workdays lost. Superficial injuries ranked second with 19.0 percent, followed by dislocations, sprains and strains with 9.0 percent. (Figure 2 and Table 5)
1.3.2. Part of Body Injured
Wrist and hand were the most injured body parts of workers with 39.7 percent of the total cases of occupational injuries with workdays lost. Other parts physically injured due to work-related accidents were lower extremities with 15.3 percent and head with 11.9 percent. (Figure 2 and Table 5)
1.3.3. Cause of Injury
The leading cause of work-related injury in the workplace was stepping on, striking against or struck by objects, excluding falling objects with a share of 34.1 percent of the total cases with workdays lost. This was followed by caught by or in between objects with 23.6 percent and falls of persons with 11.6 percent. (Figure 2 and Table 5)
1.3.4. Agent of Injury
Machines and equipment were reported as the top agent of injury resulting to 27.5 percent of absences from work. Other common agents of injury consist of materials and objects with 23.7 percent and hand tools with 18.8 percent. (Figure 2 and Table 5)
1.3.5. Major Occupation Group
Plant and machine operators and assemblers recorded at 29.1 percent was the occupation with the highest risk of involvement to occupational injuries with workdays lost. This was followed by elementary occupations with 24.8 percent. Likewise, service and sales workers were also prone to risk, which contributed 14.3 percent of the total work-related injuries. (Figure 2 and Table 5)
2. Occupational Diseases
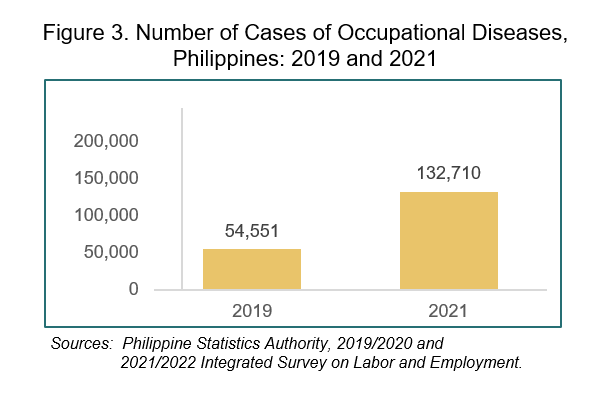
a. A total of 132,710 occurrences of occupational diseases in establishments employing 20 or more workers was recorded in 2021, which indicates an increase of 143.3 percent from the recorded 54,551 cases in 2019. (Figure 3)
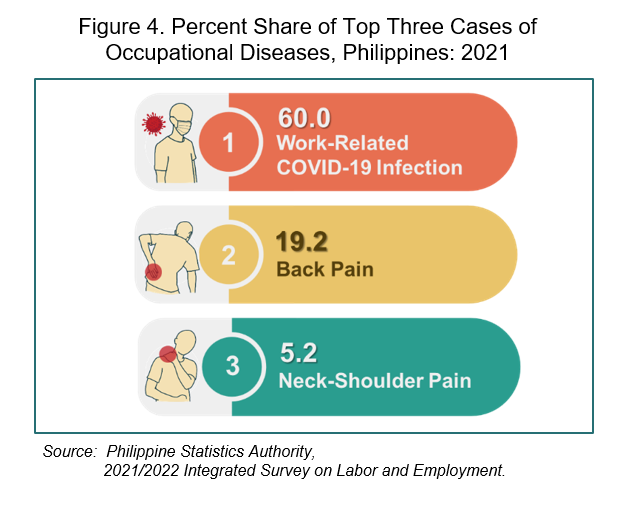
b. Among the work-related diseases suffered by workers, more than half (60.0%) of the total reported cases were Work-Related Coronavirus disease 2019 (COVID-19) Infection with the following conditions: (a) there must be a direct connection between the offending agent or event and the worker based on epidemiologic criteria and occupational risk; (b) the tasks assigned to the worker would require frequent face-to-face and close proximity interactions with the public or with confirmed cases for healthcare workers; (c) transmission occurred in the workplace; or (d) transmission occurred while commuting to and from work.
c. Other top diseases include work-related musculoskeletal disorders, such as back pain with 19.2 percent and neck-shoulder pain with 5.2 percent. (Figure 4 and Table 6)
d. About 1.2 percent of the total occupational diseases were cases of work-related mental health conditions which refers to a neurologic or psychiatric condition characterized by the existence of a recognizable, clinically significant disturbance in an individual’s cognition that may be caused or aggravated by working conditions and assessed or diagnosed based on scientifically accepted medical nomenclature and best available scientific and medical evidence. (Table 6)
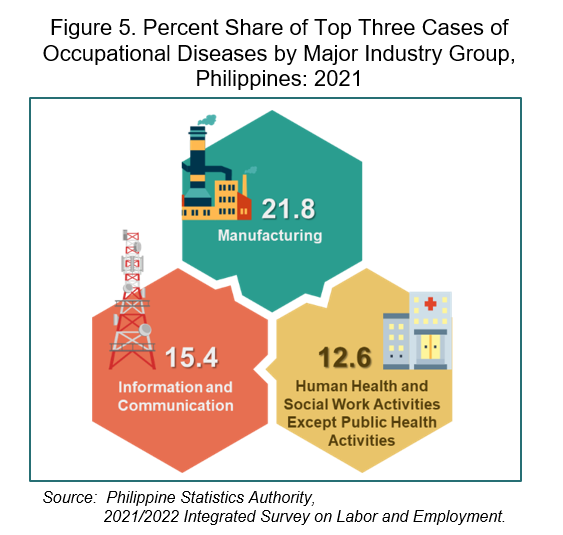
e. By major industry group, workers engaged in Manufacturing had the highest share with 21.8 percent (28,947 cases) of the total cases of work-related diseases. This was followed by Information and Communications with 15.4 percent (20,413 cases) and Human Health and Social Work Activities Except Public Health Activities with 12.6 percent (16,751 cases). (Figure 5 and Table 7)
f. Across regions, more than half (52.5%) of the total cases of occupational diseases were reported in NCR. Occupational disease cases were also observed in Region IVA - CALABARZON at 14.9 percent and Region III - Central Luzon at 7.5 percent. The rest of the regions reported less than 4.0 percent shares. (Table 8)
3. Commuting Accidents
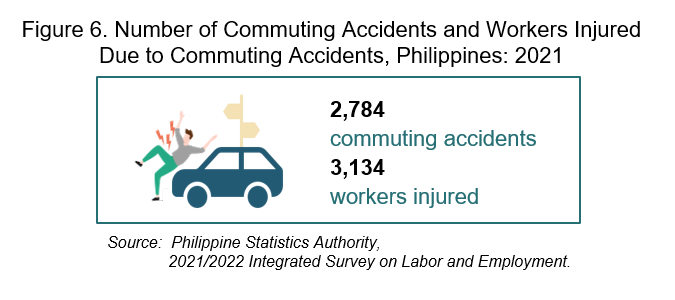
A total of 2,784 commuting accidents occurred in the establishments in 2021. These commuting accidents happened during the habitual routes of workers to or from their place of work, place of work-related training, place where the worker usually takes meals, or the place where workers usually receive remuneration. Consequently, a total of 3,134 workers were injured during the time of the commuting accidents. (Figure 6)
CLAIRE DENNIS S. MAPA, PhD
Undersecretary
National Statistician and Civil Registrar General
See more at the Integrated Survey on Labor and Employment landing page.
