(Click the link to view region highlights)
REGION:
Philippines
NCR - National Capital Region
CAR - Cordillera Administrative Region
Region I - Ilocos Region
Region II - Cagayan Valley
Region III - Central Luzon
Region IV-A - CALABARZON
MIMAROPA REGION
Region V - Bicol Region
Region VI - Western Visayas
Region VII - Central Visayas
Region VIII - Eastern Visayas
Region IX - Zamboanga Peninsula
Region X - Northern Mindanao
Region XI - Davao Region
Region XII - SOCCSKSARGEN
Region XIII - Caraga
BARMM - Bangsamoro Autonomous Region in Muslim Mindanao
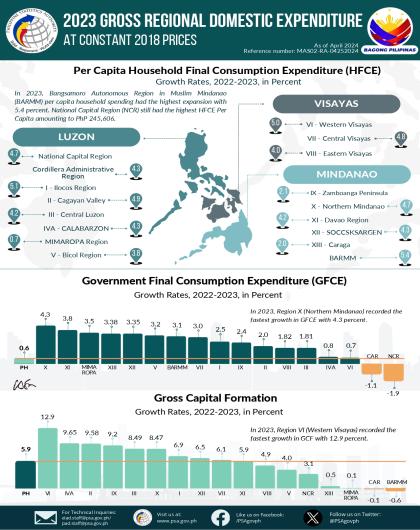
All Economies of 17 Regions Continue to Record Positive Growths in 2023; [back to top]
Central Visayas was the Fastest Growing Region at 7.3 Percent
All economies of 17 regions continued to record positive growths in 2023. Central Visayas posted the fastest growth at 7.3 percent in 2023. Western Visayas ranked second at 7.2 percent, followed by Ilocos Region at 7.1 percent. These three regions exhibited higher growths than the national level growth rate.
Other five (5) regions with growths faster than the national level were: Cordillera Administrative Region (CAR), 6.9 percent; Davao Region, 6.7 percent; Eastern Visayas, 6.4 percent; Cagayan Valley, 6.2 percent; and Central Luzon, 6.1 percent. (Figure 1)
Figure 1. Performance of Regional Economies, Growth Rates, 2022-2023
At Constant 2018 Prices (in Percent) 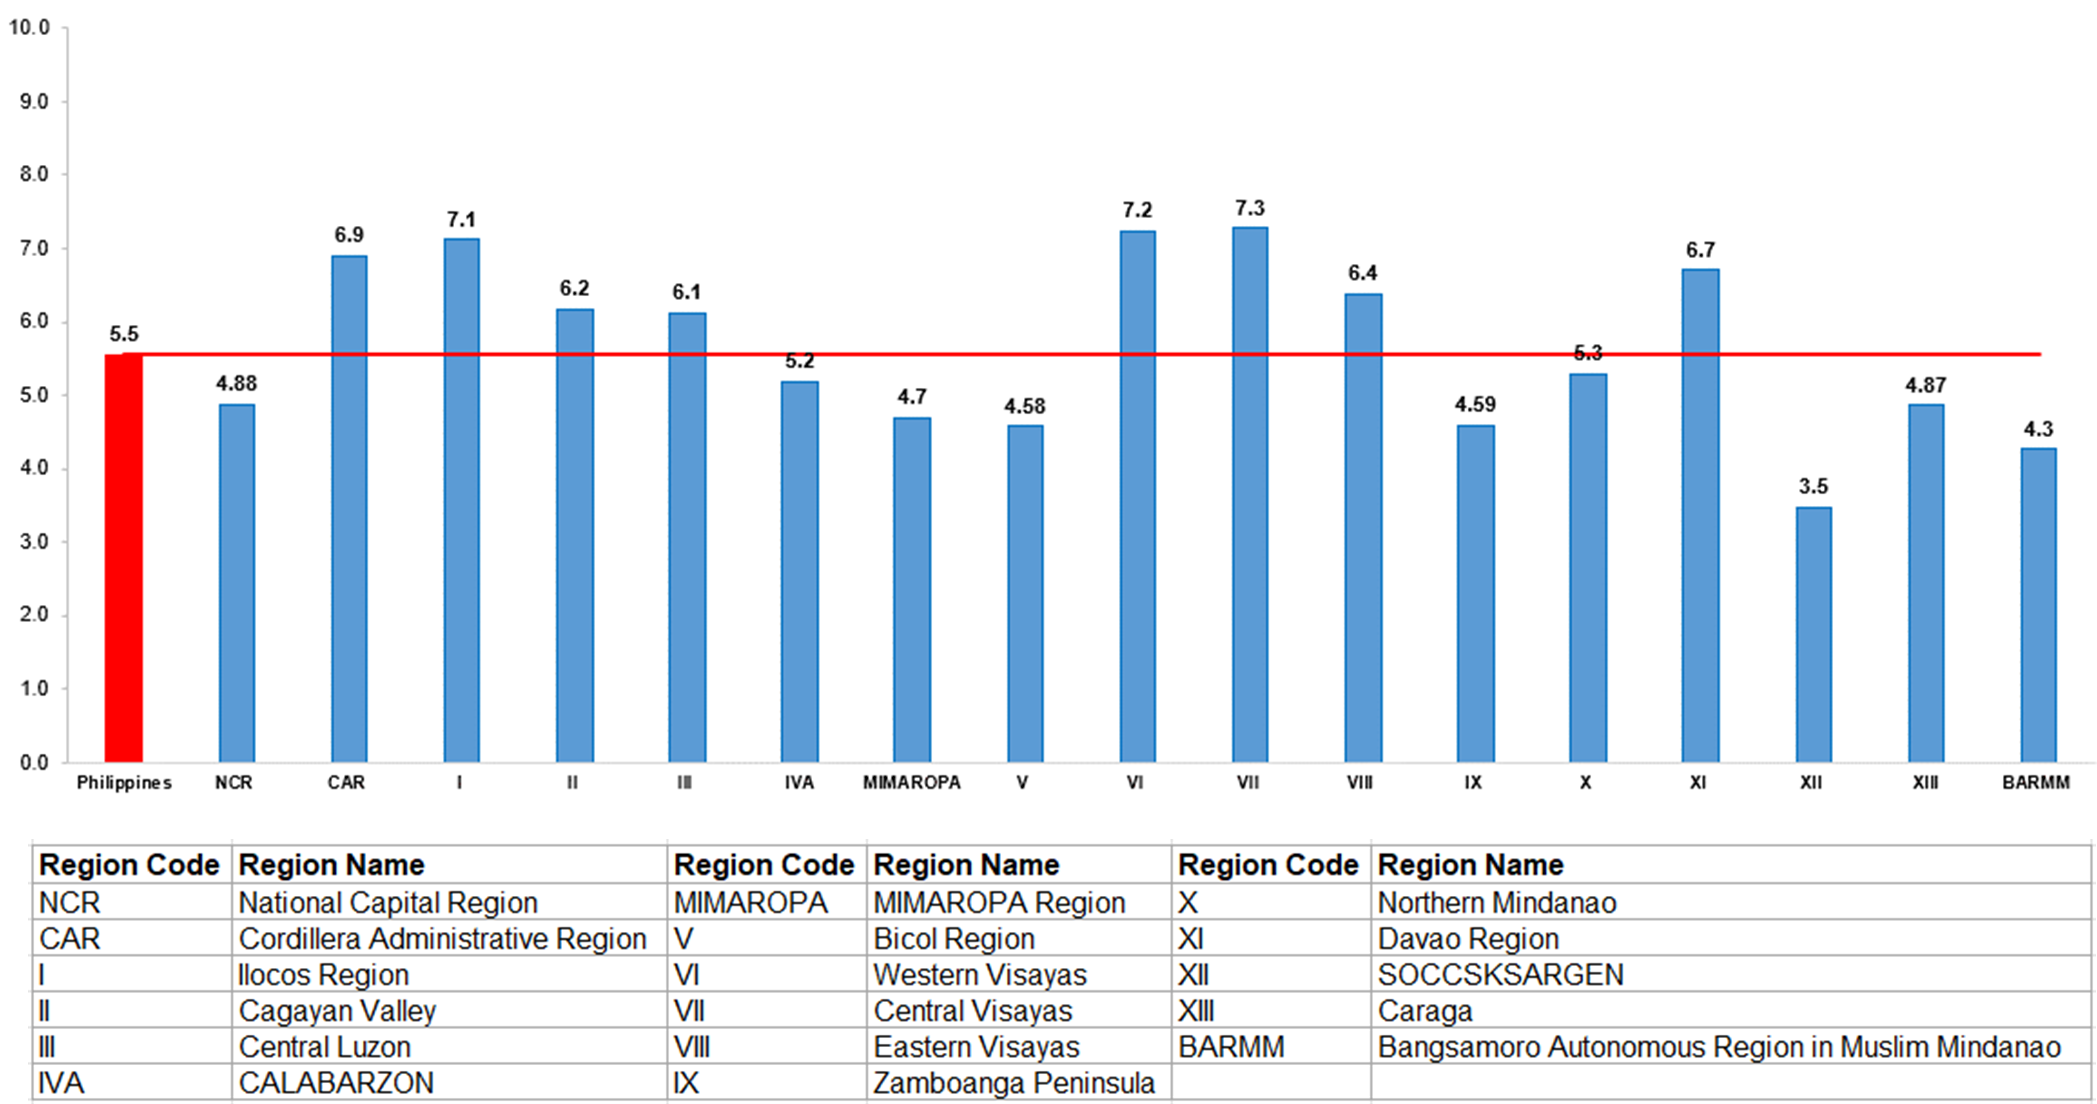
Source: Philippine Statistics Authority
At the national level, the Gross Domestic Product (GDP) grew by 5.5 percent in 2023, a slow down from the 7.6 percent growth in 2022, with all 16 major industries recording positive growths. The top industries with highest growths were: Accommodation and food service activities, 23.2 percent; Other services (e.g. Arts, culture and recreational activities, personal services, etc.), 20.8 percent; and Transportation and storage, 13.0 percent. (Figure 2)
Figure 2. GDP by Industry, Growth Rates, 2022-2023
At Constant 2018 Prices, (in Percent)
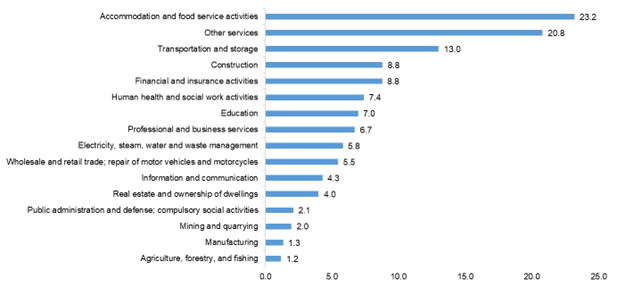
Source: Philippine Statistics Authority
At the expenditure side, the expenditure items with highest growths were: Gross capital formation, 5.9 percent; Household final consumption expenditure, 5.6 percent; and Exports of goods and services to the rest of the world, 1.4 percent. (Figure 3)
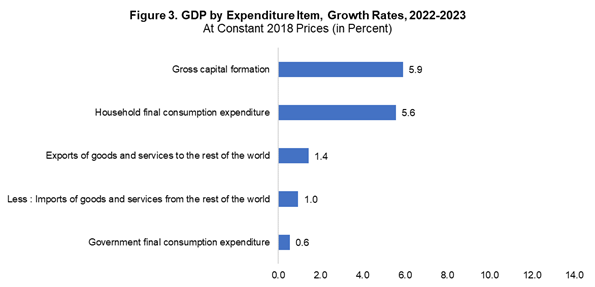
Source: Philippine Statistics Authority
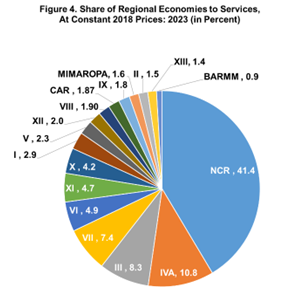
In terms of regional performance for Services in 2023, the National Capital Region (NCR) registered the biggest share at 41.4 percent. This was followed by CALABARZON and Central Luzon at 10.8 percent and 8.3 percent, respectively. (Figure 4)
Source: Philippine Statistics Authority
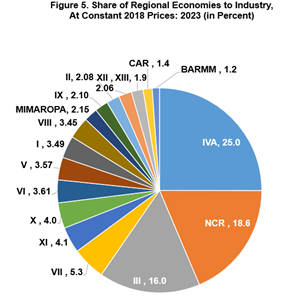
On the share of each region to the whole Industry, CALABARZON constituted the largest share at 25.0 percent, followed by NCR, 18.6 percent; and Central Luzon, 16.0 percent. (Figure 5)
Source: Philippine Statistics Authority
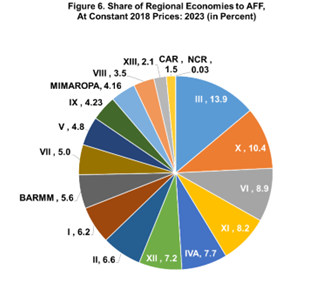
For Agriculture, Forestry and Fishing (AFF), Central Luzon topped the share at 13.9 percent, followed by Northern Mindanao and Western Visayas at 10.4 percent and 8.9 percent, respectively. (Figure 6)
Source: Philippine Statistics Authority
Household spending in 2023 increased for all regions with Bangsamoro Autonomous Region in Muslim Mindanao (BARMM) posting the highest growth rate at 7.5 percent. This was followed by CALABARZON, 6.0 percent; and Central Visayas, 5.9 percent. (Figure 7)
Figure 7. Household Final Consumption Expenditure, Growth Rates, 2022-2023
At Constant 2018 Prices, (in Percent) 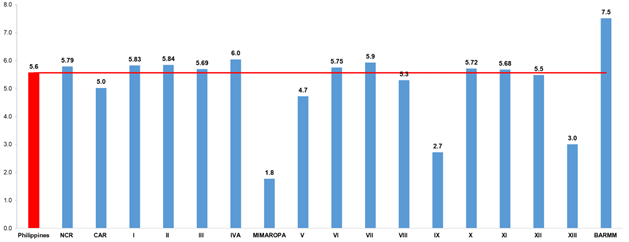
Source: Philippine Statistics Authority
On government spending, Northern Mindanao topped among the regions at 4.3 percent, followed by Davao Region at 3.8 percent, MIMAROPA Region at 3.5 percent, and Caraga and SOCCSKSARGEN at 3.38 percent and at 3.35 percent, respectively. (Figure 8)
Figure 8. Government Final Consumption Expenditure, Growth Rates, 2022-2023
At Constant 2018 Prices, (in Percent) 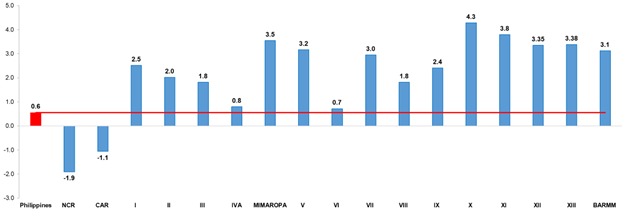
Source: Philippine Statistics Authority
Gross Capital Formation in Western Visayas posted the fastest growth at 12.9 percent, followed by CALABARZON at 9.65 percent, and Cagayan Valley at 9.58 percent. (Figure 9)
Figure 9. Gross Capital Formation, Growth Rates, 2022-2023
At Constant 2018 Prices, (in Percent) 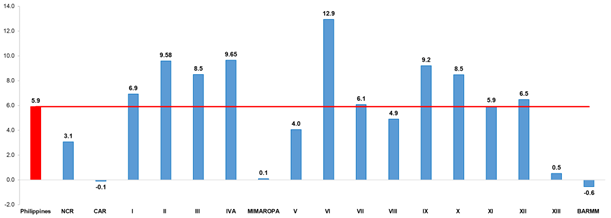
Source: Philippine Statistics Authority
At the national level, per capita GDP growth rate in 2023 was registered at 4.3 percent. Western Visayas topped the regional economies with 6.5 percent per capita growth rate. This was followed by Ilocos Region at 6.4 percent, Central Visayas at 6.15 percent, and Cordillera Administrative Region at 6.14 percent. (Figure 10)
Figure 10. Per Capita GDP by Region, Growth Rates, 2022-2023
At Constant 2018 Prices, (in Percent) 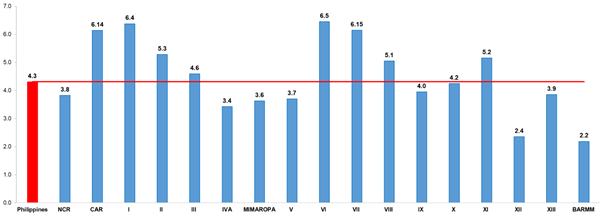
Source: Philippine Statistics Authority
The 2023 Regional Accounts of the Philippines (RAP) is consistent with the revised annual estimates released on 04 April 2024. Complete time series tables, charts, and data visuals on the RAP can be accessed at https://psa.gov.ph/statistics/regional-accounts.
NCR - NATIONAL CAPITAL REGION[back to top]
NCR’s economy increases by 4.9 percent in 2023
The economy of NCR grew by 4.9 percent in 2023, slower than the 7.2 percent growth in 2022. The top three industries that recorded the fastest growth were the following: Other services, 20.6 percent; Accommodation and food service activities, 19.4 percent; and Human health and social work activities, 9.5 percent. Meanwhile, Public administration and defense; Compulsory social activities posted a decline of 1.1 percent in 2023. (Figure 11)
Figure 11. National Capital Region, Growth Rates by Industry: 2022-2023
At Constant 2018 Prices, in Percent 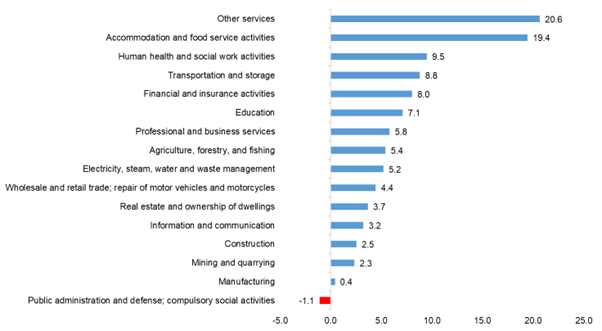
Source: Philippine Statistics Authority
Services accounted for 82.7 percent of the region’s total Gross Regional Domestic Product (GRDP) in 2023. It was followed by Industry with a 17.3 percent share. Meanwhile, Agriculture, forestry, and fishing (AFF) shared 0.007 percent of NCR's economy.
NCR contributed 1.5 percentage points to the total 5.5 percent growth in the country’s economy in 2023 and accounted for 31.2 percent of the total Philippine Gross Domestic Product (GDP), the highest among regions.
Household spending in NCR grows by 5.8 percent in 2023
NCR’s Household final consumption expenditure (HFCE) sustained its positive growth by posting 5.8 percent in 2023, from the 10.2 percent growth in 2022. Export of goods and services to rest of the world (ROW), Imports of goods and services from ROW, and Gross capital formation, grew at slower paces in 2023 at 4.3 percent from 16.0 percent, 3.8 percent from 10.7 percent, and 3.1 percent from 9.2 percent, respectively. On the other hand, Government final consumption expenditure declined by 1.9 percent from the 7.6 percent growth registered in 2022. (Figure 12)
Figure 12. National Capital Region, Growth Rates by Expenditure Type: 2022-2023
At Constant 2018 Prices, in Percent
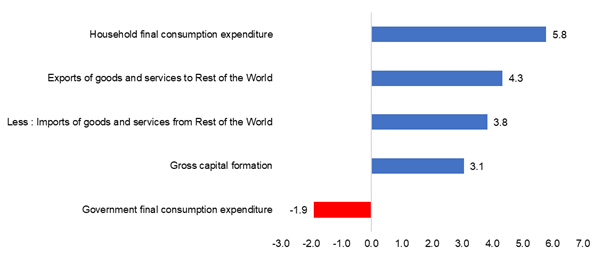
Source: Philippine Statistics Authority
The per capita HFCE of the region was recorded at PhP 245,606 in 2023, higher than the national level per capita HFCE of PhP 136,247. (Figure 13)
Figure 13. Philippines and National Capital Region,
Per Capita Household Final Consumption Expenditure: 2023
At Constant 2018 Prices, in pesos 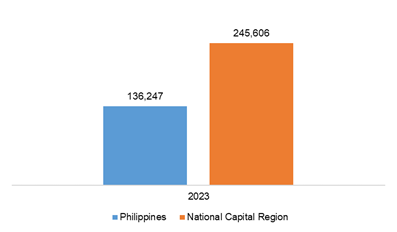
Source: Philippine Statistics Authority
CAR - CORDILLERA ADMINISTRATIVE REGION [back to top]
Cordillera’s economy grows by 6.9 percent in 2023
The economy of the Cordillera Administrative Region (CAR) expanded by 6.9 percent, which valued at PhP 361.08 billion in 2023 from PhP 337.75 billion in 2022. The fastest growths were observed in Accommodation and food service activities with 31.0 percent; Other services with 30.6 percent; and Transportation and storage with 25.7 percent. Meanwhile, Mining and quarrying; Agriculture, forestry, and fishing; and Public administration and defense; compulsory social activities contracted by 1.7 percent, 1.3 percent, and 0.8 percent, respectively. (Figure 14)
The biggest contributors to the growth of CAR’s economy were Accommodation and food service activities with 1.5 percentage points and Wholesale and retail trade; repair of motor vehicles and motorcycles with 1.4 percentage points.
Figure 14. Cordillera Administrative Region, Growth Rates by Industry: 2022-2023
At Constant 2018 Prices, in Percent 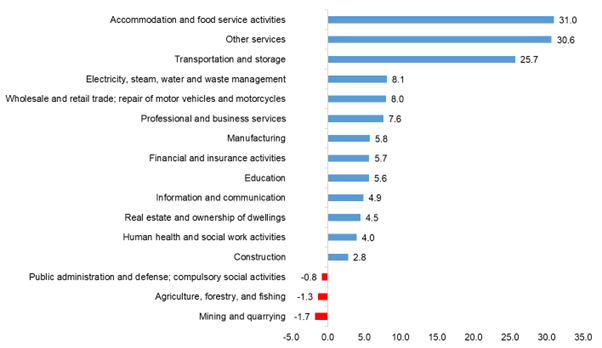
Source: Philippine Statistics Authority
Services accounted for more than half of the region’s total economy with 68.1 percent share followed by Industry with 24.2 percent share, and AFF with 7.7 percent share.
Of the 5.5 percent economic expansion of the country in 2023, CAR remained to be one of the least contributors with 0.1 percentage point. CAR’s economy accounted for 1.7 percent of the national GDP.
CAR Imports of goods and services from ROW expands in 2023
CAR’s Imports of goods and services from ROW expanded by 23.9 percent in 2023 from the 88.3 percent upturn in 2022. This was the fastest growing expenditure item in the region followed by Exports of goods and services to ROW with 23.6 percent. Household final consumption expenditure likewise expanded with 5.0 percent growth during the period. On the other hand, Government final consumption expenditure and Gross capital formation posted declines of 1.1 percent and 0.1 percent, respectively. (Figure 15)
Figure 15. Cordillera Administrative Region, Growth Rates by Expenditure Type: 2022-2023
At Constant 2018 Prices, in Percent 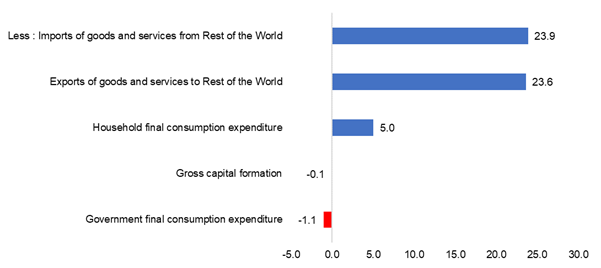
Source: Philippine Statistics Authority
The per capita HFCE of CAR was estimated at PhP 139,681 in 2023. This was an increase from the previous year’s per capita HFCE of PhP 133,960. The per capita HFCE of CAR in 2023 was higher than the national per capita HFCE by 2.5 percent. CAR was among the four regions that surpassed the national per capita HFCE in 2023. (Figure 16)
Figure 16. Philippines and Cordillera Administrative Region,
Per Capita Household Final Consumption Expenditure: 2023
At Constant 2018 Prices, in Pesos 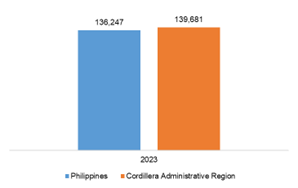
Source: Philippine Statistics Authority
REGION I - ILOCOS REGION [back to top]
Ilocos Region’s economy accelerates by 7.1 percent in 2023
The economy of Ilocos Region accelerated by 7.1 percent in 2023 amounting to PhP 701.47 billion, from the PhP 654.84 billion of the previous year. The region was the third fastest growing economy among the 17 regions in the country in 2023.
The top three industries with the highest growths were: Accommodation and food service activities with 21.6 percent, Transportation and storage with 17.6 percent, and Other services with 15.4 percent. All industries registered growth rates in 2023 except for mining and quarrying which posted a decline of 0.1 percent. (Figure 17)
Figure 17. Ilocos Region, Growth Rates by Industry: 2022-2023
At Constant 2018 Prices, in Percent 
Source: Philippine Statistics Authority
Among the major industries, Services contributed 4.4 percentage points to the total 7.1 percent growth in the region’s economy in 2023. This was followed by Industry with 2.1 percentage points, and AFF with 0.6 percentage point.
Of the 5.5 percent growth in the economy of the country, Ilocos Region contributed 0.2 percentage point, accounting for 3.3 percent share to the total GDP.
Ilocos Region’s Household final consumption expenditure expands by 5.8 percent
All major expenditure items registered growth. Among the major expenditure items, Imports of goods and services from ROW recorded the fastest growth with 29.7 percent. This was followed by Exports of goods and services to ROW with 27.5 percent; Gross capital formation with 6.9 percent; Household final consumption expenditure with 5.8 percent; and Government final consumption expenditure with 2.5 percent. (Figure 18)
Figure 18. Ilocos Region, Growth Rates by Expenditure Item: 2022-2023
At Constant 2018 Prices, in Percent 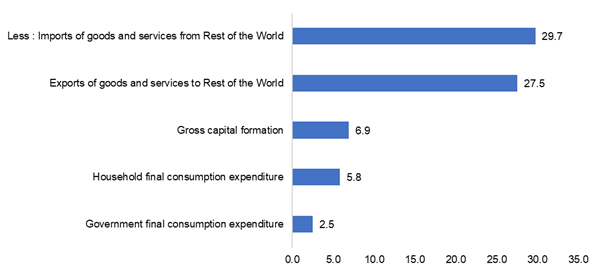
Source: Philippine Statistics Authority
The per capita HFCE of Ilocos Region in 2023 was estimated at PhP 122,907, lower than the national level at PhP 136,247. (Figure 19)
Figure 19. Per Capita Household Final Consumption Expenditure
Philippines and Ilocos Region: 2023, at Constant 2018 Prices, in Pesos 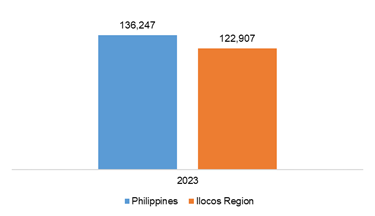
Source: Philippine Statistics Authority
REGION II - CAGAYAN VALLEY [back to top]
Construction drives Cagayan Valley’s 6.2 percent economic growth in 2023
Cagayan Valley’s economy grew by 6.2 percent in 2023, equivalent to an increase of around PhP 26.03 billion to the region’s total GRDP, from PhP 421.05 billion in 2022 to PhP 447.07 billion in 2023. The increase was mainly driven by Construction which expanded by 14.5 percent.
Among the 16 industries, the top industry that recorded the fastest growth was Accommodation and food service activities with 19.0 percent. This was followed by Other services, 18.5 percent; Construction, 14.5 percent; Professional and business services, 10.7 percent, and Transportation and storage, 10.5 percent. All remaining industries also posted growth in 2023. (Figure 20)
In terms of major industries, Services contributed the largest share to the region’s economy by 44.7 percent. Moreover, Industry and AFF shared 28.5 percent, and 26.8 percent, respectively.
Figure 20. Cagayan Valley, Growth Rates by Industry: 2022-2023
At Constant 2018 Prices, in Percent 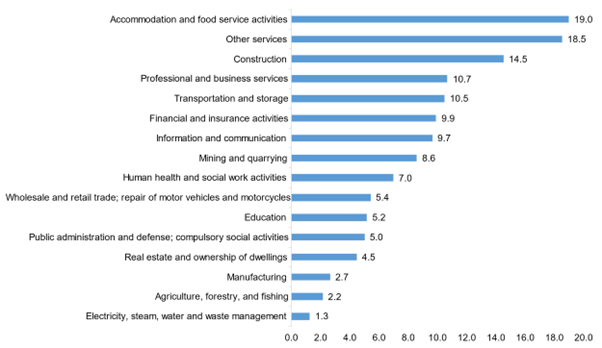
Source: Philippine Statistics Authority
Of the 5.5 percent economic growth in the country, Cagayan Valley contributed 0.1 percentage point, accounting for 2.1 percent share of the total GDP.
Cagayan Valley’s Exports of goods and services to ROW records the highest growth
At the expenditure side, Exports of goods and services to ROW grew the fastest at 32.8 percent, followed by Imports of goods and services from ROW at 10.0 percent, and Gross capital formation at 9.6 percent. Furthermore, Cagayan Valley’s Household final consumption expenditure, which had the largest share of the region’s Gross Regional Domestic Expenditure (GRDE), grew by 5.8 percent in 2023. (Figure 21)
Figure 21. Cagayan Valley, Growth Rates by Expenditure Type: 2022-2023
At Constant 2018 Prices, in Percent 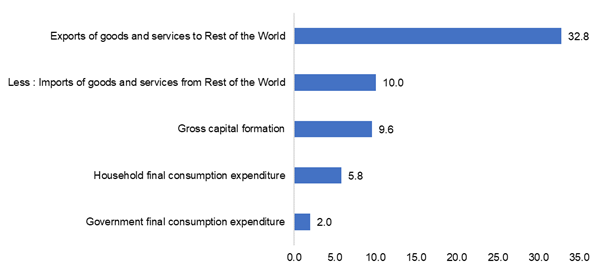
Source: Philippine Statistics Authority
The per capita HFCE increased by 4.9 percent in 2023. The per capita HFCE in the region was recorded at PhP 100,810, lower than the national level per capita HFCE of PhP 136,247. (Figure 22)
Figure 22. Philippines and Cagayan Valley,
Per Capita Household Final Consumption Expenditure: 2023
At Constant 2018 Prices, in pesos 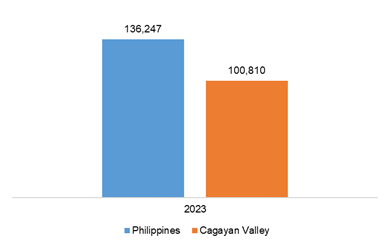
Source: Philippine Statistics Authority
REGION III - CENTRAL LUZON [back to top]
Central Luzon’s economy posts 6.1 percent growth in 2023
The economy of Central Luzon grew at a slower pace by 6.1 percent in 2023 from 8.1 percent in 2022. The top industries with the fastest growth rates were Mining and quarrying with 27.8 percent; Accommodation and food service activities with 27.4 percent; and Other services with 23.3 percent. On the other hand, Public administration and defense; compulsory social activities declined by 4.3 percent in 2023 from a growth of 6.5 percent in 2022. (Figure 23)
Figure 23. Central Luzon, Growth Rates by Industry: 2022 - 2023
At Constant 2018 Prices, in Percent 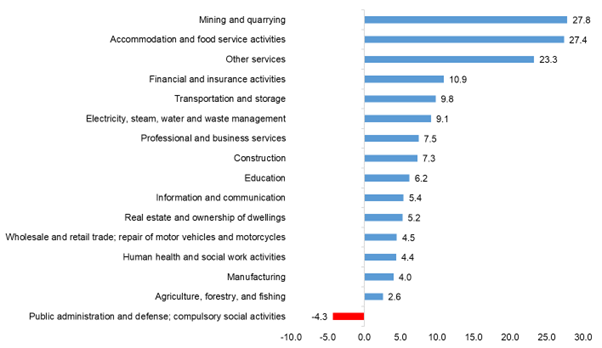
Source: Philippine Statistics Authority
Services accounted for 46.9 percent of the region’s total economy in 2023, followed by Industry with 42.3 percent and AFF with 10.8 percent.
Services slowed down to 7.5 percent in 2023 from 8.9 percent in 2022. This was attributed mainly to the decline of the Public administration and defense; compulsory social activities industry.
Of the 5.5 percent economic growth in the country, Central Luzon was the third largest contributor to the increase with 0.7 percentage point, accounting for 11.0 percent of the total GDP.
Central Luzon’s Household final consumption expenditure expands by 5.7 percent in 2023
Central Luzon's Household final consumption expenditure increased by 5.7 percent in 2023. Gross capital formation also improved by 8.5 percent at a slower rate from 12.4 percent in 2022. Similarly, government spending slowed down to 1.8 percent from 4.5 percent in 2022. Total Exports of goods and services to ROW slowed down to 1.5 percent in 2023 from 17.2 percent in 2022. On the other hand, total Imports of goods and services from ROW registered a decline of 4.8 percent in 2023. (Figure 24)
Figure 24. Central Luzon, Growth Rates by Expenditure Type: 2022 - 2023
At Constant 2018 Prices, in Percent 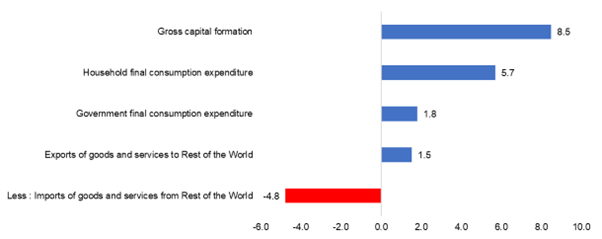
Source: Philippine Statistics Authority
The per capita HFCE in Central Luzon was estimated at PhP 157,109 which grew by 4.2 percent in 2023 from PhP 150,809 in 2022. This was higher by 15.3 percent than the national level which was estimated at PhP 136,247. (Figure 25)
Figure 25. Philippines and Central Luzon,
Per Capita Household Final Consumption Expenditure: 2023
At Constant 2018 Prices, in pesos 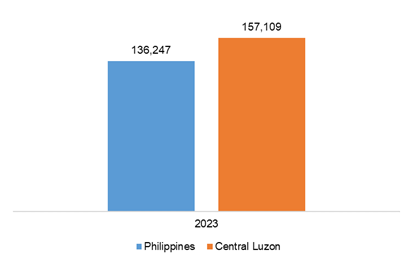
Source: Philippine Statistics Authority
REGION IVA - CALABARZON [back to top]
CALABARZON’s economy grows by 5.2 percent in 2023
The economy of CALABARZON grew by 5.2 percent in 2023. This was slower than the 7.8 percent growth recorded in 2022. In terms of levels, CALABARZON’s economy continued to increase to PhP 3.10 trillion in 2023 from PhP 2.94 trillion in 2022 and PhP 2.73 trillion in 2021.
The top three fastest growing industries were: Other Services which include Arts, culture and recreational activities, personal services among others with 22.9 percent; Accommodation and food service activities with 19.5 percent, and Construction with 14.8 percent. Conversely, Mining and quarrying declined by 0.3 percent, the only industry which recorded a decline in 2023. (Figure 26)
Figure 26. CALABARZON, Growth Rates by Industry: 2022 - 2023
At Constant 2018 Prices, in percent 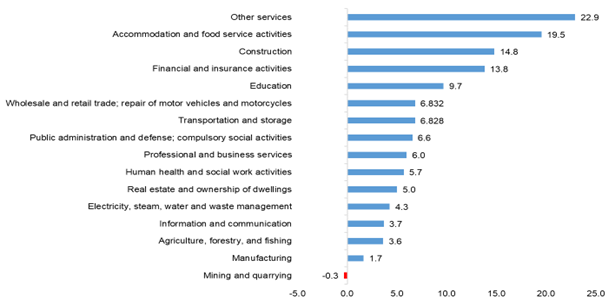
Source: Philippine Statistics Authority
The main contributor to CALABARZON’s economy was Wholesale and retail trade; repair of motor vehicles and motorcycles which contributed 0.9 percentage point to the regional growth, posting a 6.8 percent growth. This was followed by Manufacturing which grew by 1.7 percent, and Financial and insurance activities with 13.8 percent growth.
CALABARZON was the only predominantly Industrial region in the country. Among the major economic sectors of the region, Industry had the largest share with 49.6 percent. This was followed by Services with 46.0 percent share and AFF with 4.5 percent share.
Of the 5.5 percent growth in Philippines’ GDP in 2023, CALABARZON contributed 0.8 percentage point, the second highest among the 17 regions. Moreover, the region also ranked second in terms of share, accounting for 14.7 percent of the total GDP.
CALABARZON’s Gross capital formation records highest growth in the region
Among the major expenditure items, Gross capital formation recorded the highest growth of 9.6 percent but slower than the 17.3 percent growth in 2022. It was followed by Household final consumption expenditure at 6.0 percent and Government final consumption expenditure at 0.8 percent, both of which were also slower compared to the growths in 2022. In contrast, Imports of goods and services from ROW and Exports of goods and services to ROW declined by 2.4 percent and 8.7 percent, respectively. (Figure 27)
Figure 27. CALABARZON, Growth Rates by Expenditure Type: 2022 - 2023
At Constant 2018 Prices, in Percent 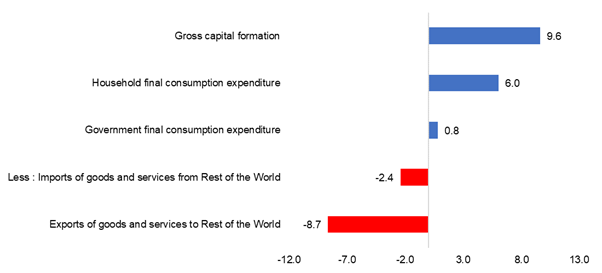
Source: Philippine Statistics Authority
The per capita HFCE in the region was estimated at PhP 152,754 which grew by 4.3 percent, from PhP 146,502 in 2022. It was higher by 12.1 percent than the national level which was estimated at PhP 136,247. (Figure 28)
Figure 28. Philippines and CALABARZON,
Per Capita Household Final Consumption Expenditure: 2023
At Constant 2018 Prices, in pesos 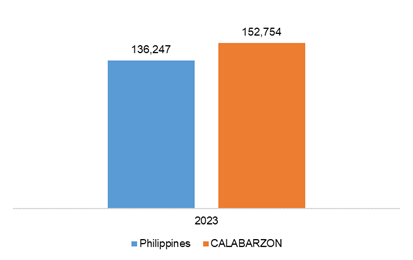
Source: Philippine Statistics Authority
MIMAROPA REGION [back to top]
MIMAROPA Region’s economy continues to surpass its pre-pandemic level with 4.7 percent growth in 2023
The economy of MIMAROPA Region was estimated at PhP 411.43 billion in 2023 from PhP 392.97 billion in 2022. Also, the region continued to surpass its pre-pandemic economic performance, with a margin of PhP 24.65 billion compared with the 2019 level. The industries with the fastest growth rates were: Accommodation and food service activities with 30.9 percent; Other services with 16.0 percent; and Public administration and defense; compulsory social activities with 13.8 percent, which was also the fastest growth among the 17 regions. (Figure 29)
MIMAROPA region’s Services grew by 8.8 percent in 2023, the third fastest growth among the regions in the country. AFF of the region which recorded the second fastest growth among the 17 regions, grew by 6.2 percent in 2023 from a 2.4 percent decline in 2022. Meanwhile, the region’s total Industry posted a 1.8 percent decline in 2023 due to reduction in Mining and quarrying by 18.0 percent, and Manufacturing by 4.9 percent. Yet, despite the decline, MIMAROPA region had the third largest share of the total Mining and quarrying in the country.
Figure 29. MIMAROPA, Growth Rates by Industry: 2022 - 2023
At Constant 2018 Prices, in Percent 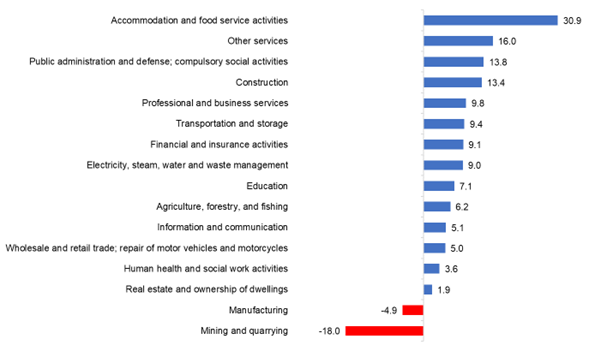
Source: Philippine Statistics Authority
Among the major industries, Services accounted for the biggest share of 49.8 percent, followed by Industry with 31.9 percent share and AFF with 18.2 percent share.
MIMAROPA Region’s Exports of goods and services to ROW accelerates by 37.4 percent in 2023
MIMAROPA Region’s Exports of goods and services to ROW accounted for the fastest growth among the expenditure items with 37.4 percent. This was followed by Government final consumption expenditure with 3.5 percent, which also recorded as the third fastest growth among the regions in the country.
Household spending or Household final consumption expenditure, which shared 85.8 percent to the regional economy, slowed down to 1.8 percent growth in 2023 from 8.2 percent increase in 2022. (Figure 30)
Figure 30. MIMAROPA, Growth Rates by Expenditure Item: 2022 - 2023
At Constant 2018 Prices, in Percent 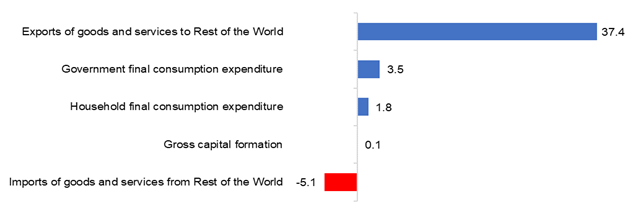
Source: Philippine Statistics Authority
The per capita HFCE in the region grew by 0.7 percent in 2023. The recorded per capita HFCE, at constant 2018 prices, in the region was at PhP 107,607, about 21.0 percent lower than the national level which amounted to PhP 136,247. (Figure 31)
Figure 31. Philippines and MIMAROPA,
Per Capita Household Final Consumption Expenditure: 2023
At Constant 2018 Prices, in Pesos 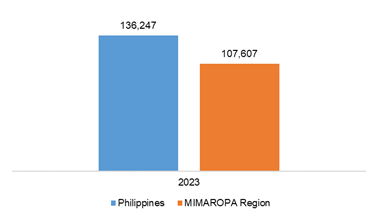
Source: Philippine Statistics Authority
REGION V - BICOL REGION [back to top]
Bicol Region’s economy grows by 4.6 percent in 2023
The economic growth of Bicol Region decelerated to 4.6 percent in 2023 compared with the 8.0 percent increase in 2022. The top three fastest growing industries were: Transportation and storage with 21.0 percent; Other services with 19.6 percent; and Accommodation and food service activities with 18.1 percent. (Figure 32)
Figure 32. Bicol Region, Growth Rates by Industry: 2022 - 2023
At Constant 2018 Prices, in Percent 
Source: Philippine Statistics Authority
Services remained to account for the largest share in the region’s economy in 2023 at 49.9 percent, followed by Industry with 35.9 percent and AFF with 14.2 percent share.
Among the major economic industries, Services posted growth of 8.0 percent and Industry by 4.4 percent. Meanwhile, the AFF declined by 5.4 percent in 2023 from 2.5 percent growth in 2022.
Of the 5.5 percent economic growth of the country, Bicol Region contributed 0.1 percentage point.
Bicol Region’s Imports of goods and services from ROW grows by 29.9 percent in 2023
By expenditure item, Imports of goods and services from ROW posted the fastest growth at 29.9 percent in 2023 from 17.7 percent in 2022. This was followed by Exports of goods and services to ROW at 21.1 percent and Household final consumption expenditure at 4.7 percent. (Figure 33)
Figure 33. Bicol Region, Growth Rates by Expenditure Type: 2022 - 2023
At Constant 2018 Prices, in Percent 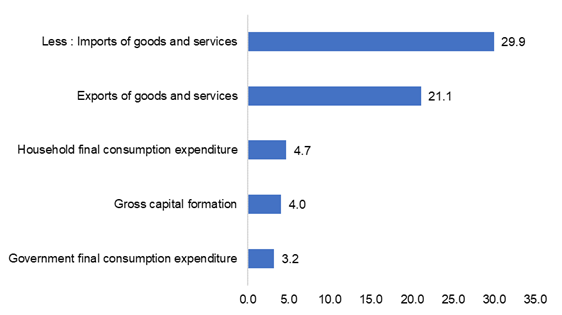
Source: Philippine Statistics Authority
Per capita HFCE was higher by 3.8 percent in 2023. The per capita HFCE in the region was recorded at PhP 100,695 in 2023 which was lower than the national per capita level of PhP 136,247. (Figure 34)
Figure 34. Philippines and Bicol Region,
Per Capita Household Final Consumption Expenditure: 2023
At Constant 2018 Prices, in pesos 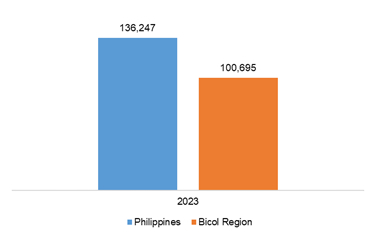
Source: Philippine Statistics Authority
REGION VI - WESTERN VISAYAS [back to top]
Western Visayas grows by 7.2 percent in 2023; hits one trillion pesos in economic value
The economy of Western Visayas grew by 7.2 percent in 2023, bringing the total value of the economy at PhP 1.024 trillion. The 2023 growth was slower than the 9.3 percent growth recorded in 2022. The growth was fueled by the positive performances of all industries, except for AFF which registered a contraction of 3.7 percent. The following industries posted double-digit growths in 2023: Accommodation and food service, 37.0 percent, Other services, 24.6 percent, Transportation and storage, 16.9 percent, Construction, 15.8 percent, Public administration and defense, compulsory social activities, 11.2 percent, Financial and insurance activities, 10.2 percent, and Electricity, steam, water and waste management, 10.1 percent. (Figure 35)
Figure 35. Western Visayas, Growth Rates by Industry: 2022-2023
At Constant 2018 Prices, in percent 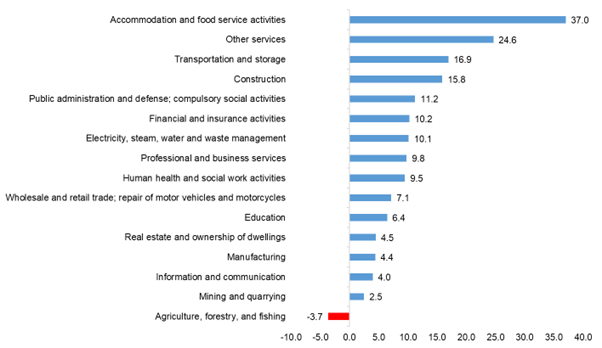
Source: Philippine Statistics Authority
Among the three major industries, Services accounted for the largest share of the region’s economy at 62.7 percent. This was followed by Industry with 21.6 percent, and AFF with 15.7 percent.
Moreover, Western Visayas shared 4.9 percent to the national GDP, making it the fifth largest economy among the 17 regions in the country.
Western Visayas’ household spending grows by 5.8 percent in 2023
Household spending or Household final consumption expenditure grew by 5.8 percent in 2023, which shared 93.8 percent of the regional economy. Exports of goods and services to ROW grew the fastest at 13.2 percent, followed by Gross capital formation which grew by 12.9 percent, while Government spending or Government final consumption expenditure increased by 0.7 percent. Only Imports of goods and services from ROW declined by 10.0 percent. (Figure 36)
Figure 36. Western Visayas, Growth Rates by Expenditure Type: 2022-2023
At Constant 2018 Prices, in Percent 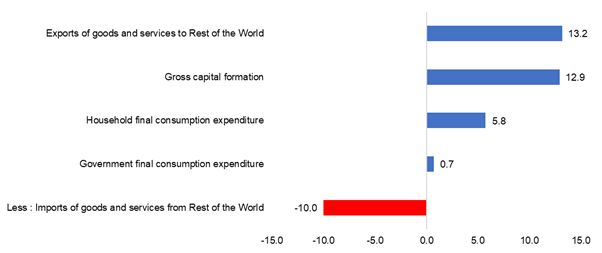
Source: Philippine Statistics Authority
The household spending of each individual in the region increased by 5.0 percent in 2023. The per capita HFCE of Western Visayas was recorded at PhP 118,749, lower than the PhP 136,247 national per capita level. (Figure 37)
Figure 37. Philippines and Western Visayas,
Per Capita Household Final Consumption Expenditure: 2023
At Constant 2018 Prices, in pesos 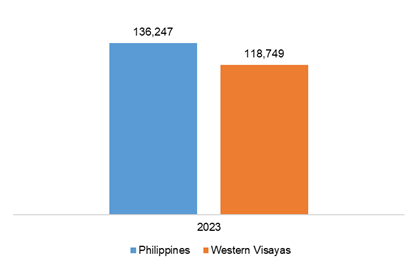
Source: Philippine Statistics Authority
REGION VII - CENTRAL VISAYAS [back to top]
Central Visayas is the fastest growing regional economy in the country in 2023 with 7.3 percent growth
The economy of Central Visayas grew by 7.3 percent in 2023, the fastest among all regions in the country during the period. The main contributors to the 2023 growth were: Wholesale and retail trade; repair of motor vehicles and motorcycles, 5.5 percent growth; Transportation and storage, 24.9 percent; and Accommodation and food service activities, 32.3 percent.
Among the 16 industries, Accommodation and food service activities posted the fastest growth with 32.3 percent. This was followed by Transportation and storage with 24.9 percent and Other services with 18.0 percent. (Figure 38)
Figure 38. Central Visayas, Growth Rates by Industry: 2022-2023
At Constant 2018 Prices, in percent 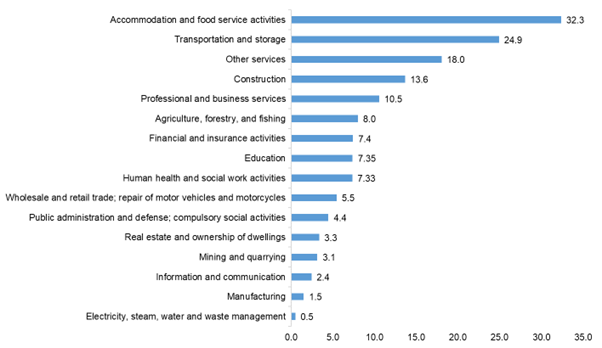
Source: Philippine Statistics Authority
Among the three major sectors, Services accounted the largest share of the region’s total GRDP in 2023 with 70.0 percent share. This was followed by Industry with
23.4 percent share, and AFF with 6.6 percent share.
In 2023, the growth of AFF rebounded to 8.0 percent from a decline of 4.7 percent in 2022. Industry and Services grew by 4.1 percent and 8.3 percent, respectively.
Of the 5.5 percent growth in the country’s economic performance, Central Visayas contributed 0.5 percentage point and remained to be the fourth largest economy with 6.6 percent share to the total GDP in 2023.
Central Visayas’ Exports of goods and services to ROW registers the fastest growth in 2023
In 2023, all major expenditure items posted growth. Exports of goods and services to ROW had the fastest growth with 14.6 percent, posting the highest contribution to the growth of the regional economy from the demand side. This was followed by Gross capital formation with 6.1 percent growth. (Figure 39)
Figure 39. Central Visayas, Growth Rates by Expenditure Type: 2022-2023
At Constant 2018 Prices, in percent 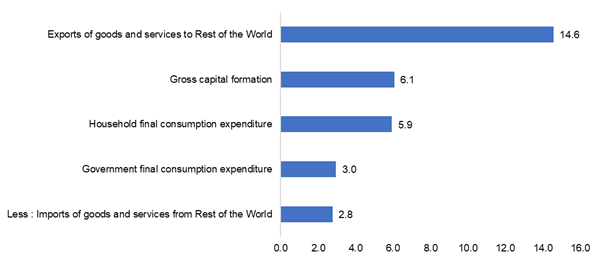
Source: Philippine Statistics Authority
Per capita HFCE increased by 4.8 percent in 2023, a slower rate from 6.9 percent in 2022. The per capita HFCE in the region was recorded at PhP 119,371, which was lower than the national per capita amounting to PhP 136,247. (Figure 40)
Figure 40. Philippines and Central Visayas,
Per Capita Household Final Consumption Expenditure: 2023
At Constant 2018 Prices, in pesos 
Source: Philippine Statistics Authority
REGION VIII - EASTERN VISAYAS [back to top]
Eastern Visayas’ economy grows by 6.4 percent in 2023
Eastern Visayas’ economy grew by 6.4 percent in 2023. The economic growth was driven by the positive performance of the three major industries and all its sub-industries in 2023. (Figure 41)
Figure 41. Eastern Visayas, Growth Rates by Industry: 2022 to 2023
At Constant 2018 Prices, in percent 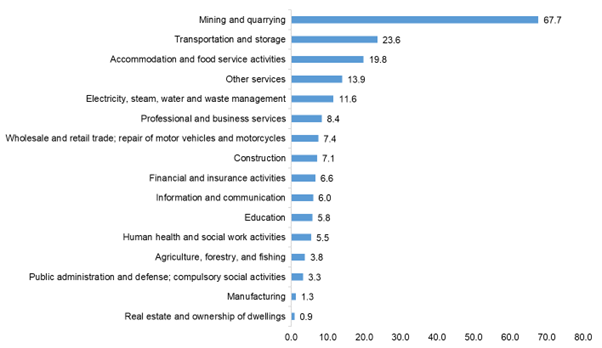
Source: Philippine Statistics Authority
Services and Industry contributed 3.6 percentage points and 2.4 percentage points, respectively to the region’s 6.4 percent growth in 2023. AFF shared 0.5 percentage point.
Services shared 47.7 percent of the region’s economy, followed closely by Industry at 40.4 percent. AFF had the smallest share at 11.9 percent.
Eastern Visayas, which shared 2.5 percent of the Philippine economy, contributed 0.2 percentage point to the 5.5 percent economic growth in 2023.
Eastern Visayas’ Exports of goods and services to ROW posts 7.8 percent growth in 2023
Eastern Visayas region recorded a 7.8 percent growth in Exports of goods and services to ROW from a decline of 5.8 percent in 2022. All the expenditure items posted growth in 2023. Exports of goods to ROW consist of sales, barter, gifts, or grants of goods from residents to non-residents, while Exports of services to ROW refer to transactions/purchases of services by residents to non-residents. (Figure 42)
Figure 42. Eastern Visayas, Growth Rates by Expenditure Type: 2022 to 2023
At Constant 2018 Prices, in Percent 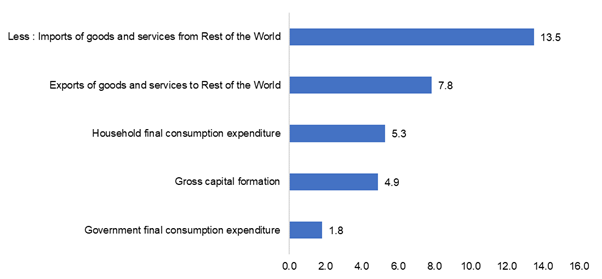
Source: Philippine Statistics Authority
The per capita HFCE of the region was estimated at PhP 93,268 in 2023. This was higher than the previous year’s per capita household spending amounting to PhP 89,694. The region’s per capita HFCE was lower than the national level estimated at PhP 136,247. (Figure 43)
Figure 43. Philippines and Eastern Visayas,
Per Capita Household Final Consumption Expenditure: 2023
At Constant 2018 Prices, in pesos 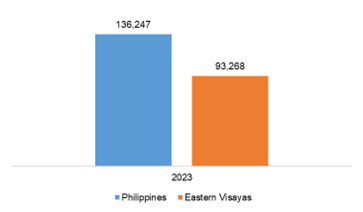
Source: Philippine Statistics Authority
REGION IX - ZAMBOANGA PENINSULA [back to top]
Zamboanga Peninsula’s economy grows by 4.6 percent in 2023
Zamboanga Peninsula’s economy grew by 4.6 percent in 2023, slower than the recorded economic growth of 7.5 percent in 2022. The growth in the region’s economy in 2023 was attributed to the expansion of all industries except for Manufacturing.
The fastest growth was registered in Other Services with 24.4 percent, followed by Construction with 17.2 percent, and Transportation and storage with 16.5 percent. (Figure 44)
Figure 44. Zamboanga Peninsula, Growth Rates by Industry: 2022-2023
At Constant 2018 Prices, in percent 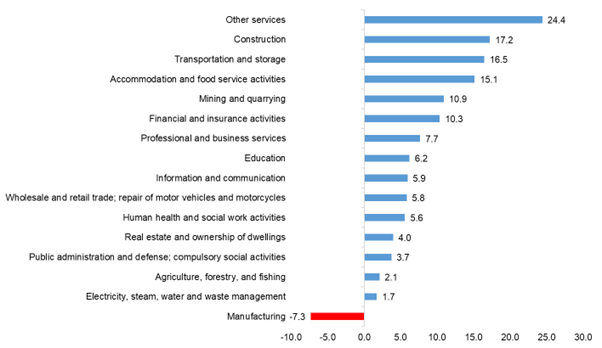
Source: Philippine Statistics Authority
Among the three major industries, Services accounted for 54.1 percent share to the total regional economy. This was followed by Industry with 28.8 percent share, and AFF with 17.1 percent share.
Services increased by 7.0 percent in 2023, a slower growth from the 10.3 percent in 2022. This was attributed to the growth observed in all its sub-industries. Wholesale and retail trade; repair of motor vehicles and motorcycles, with 22.9 percent share to the regional economy, grew by 5.8 percent in 2023, a slower growth from the 10.6 percent in 2022.
Of the 5.5 percent economic growth of the country in 2023, Zamboanga Peninsula contributed 0.1 percentage point, accounting for 2.1 percent share to the national GDP.
Zamboanga Peninsula’s Exports of goods and services to ROW posts the highest growth in the region
At the expenditure side, Exports of goods and services to ROW had the fastest growth with 15.2 percent in 2023. This was followed by Gross capital formation which accelerated to 9.2 percent in 2023 from 5.4 percent growth in 2022.
Household final consumption expenditure and Government final consumption expenditure decelerated to 2.7 percent and 2.4 percent in 2023, respectively from 9.6 percent and 3.5 percent, respectively, in 2022. On the other hand, Imports of goods and services from ROW contracted by 8.4 percent in 2023. (Figure 45)
Figure 45. Zamboanga Peninsula, Growth Rates by Expenditure Type: 2022-2023
At Constant 2018 Prices, in percent 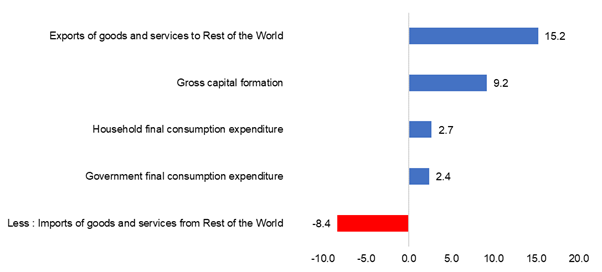
Source: Philippine Statistics Authority
The per capita HFCE of Zamboanga Peninsula grew by 2.1 percent in 2023. It was estimated at PhP 87,195 in 2023, lower than the national level which amounted to PhP 136,247. (Figure 46)
Figure 46. Philippines and Zamboanga Peninsula,
Per Capita Household Final Consumption Expenditure: 2023
At Constant 2018 Prices, in Pesos 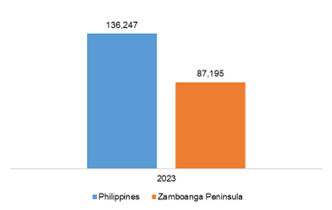
Source: Philippine Statistics Authority
REGION X - NORTHERN MINDANAO [back to top]
Northern Mindanao economy up by 5.3 percent
The economy of Region X grew by 5.3 percent in 2023, a slowdown from the 7.2 percent growth recorded in the previous year. This was mainly attributed to slower growth across all major industries. The region was ranked as the ninth fastest-growing regional economy.
The industries with the fastest growth rates were Transportation and storage, which grew by 21.0 percent, Accommodation and food service activities, which grew by 17.8 percent, and Public administration and defense; compulsory social activities, which expanded by 12.4 percent. (Figure 47)
Figure 47. Northern Mindanao, Growth Rates by Industry: 2022-2023
At Constant 2018 Prices, in Percent
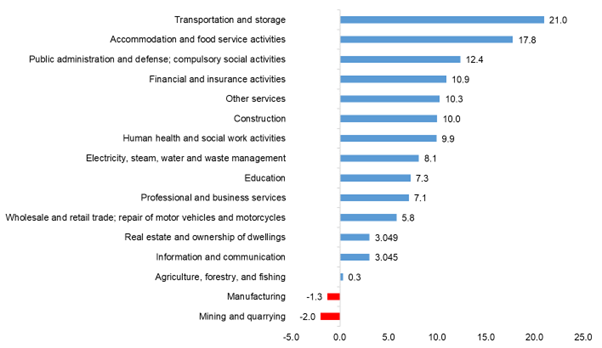
Source: Philippine Statistics Authority
The top growth driver was Wholesale and retail trade; repair of motor vehicles and motorcycles, contributing 1.6 percentage points. This was followed by Construction, contributing 0.8 percentage point, and Transportation and storage, contributing 0.6 percentage point. Together, these top three growth drivers accounted for 2.9 percentage points of the 5.3 percent regional growth. Of the country's 5.5 percent economic growth, Northern Mindanao contributed 0.2 percentage point, accounting for 4.7 percent share in the national GDP.
NorMin’s Gross capital formation posts highest growth in the region
On the demand side, the Gross capital formation of Northern Mindanao recorded the highest growth of 8.5 percent in 2023. This was followed by Household final consumption expenditure which grew by 5.7 percent. Government spending in the region also expanded by 4.3 percent. Meanwhile, Exports and Imports of goods and services to and from rest of the world declined by 1.5 percent and 5.4 percent, respectively. (Figure 48)
Figure 48. Northern Mindanao, Growth Rates by Expenditure Type: 2022-2023
At Constant 2018 Prices, in percent 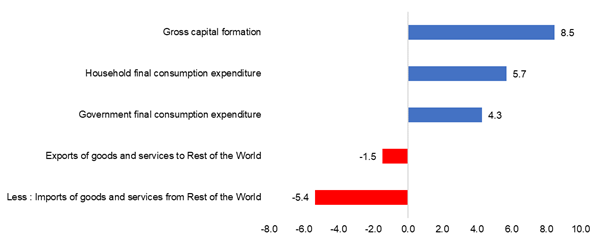
Source: Philippine Statistics Authority
Per capita HFCE increased by 4.7 percent in 2023. The per capita HFCE in the region was recorded at PhP 106,564 in 2023, lower by 21.8 percent than the national level per capita HFCE of PhP 136,247. (Figure 49)
Figure 49. Philippines and Northern Mindanao,
Per Capita Household Final Consumption Expenditure: 2023
At Constant 2018 Prices, in Pesos 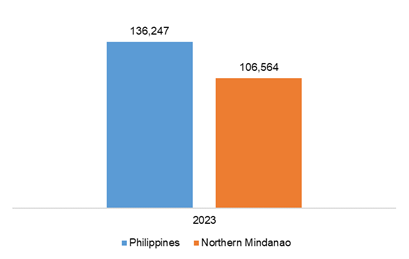
Source: Philippine Statistics Authority
REGION XI - DAVAO REGION [back to top]
Davao region’s economy posts 6.7 percent growth in 2023; enters trillion-peso economy
The economy of Davao region grew by 6.7 percent in 2023, a slower growth compared to the 8.2 percent recorded in 2022. The top three industries that recorded the fastest growths were the following: Other services, 21.5 percent growth; Accommodation and food service activities, 16.9 percent; and Transportation and storage, 13.2 percent. (Figure 50)
Figure 50. Davao Region, Growth Rates by Industry: 2022-2023
At Constant 2018 Prices, in Percent 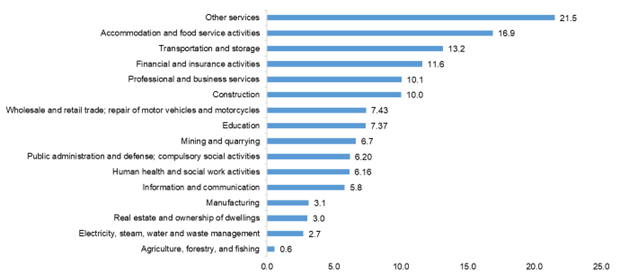
Source: Philippine Statistics Authority
With the 6.7 percent growth in 2023, Davao Region reached a trillion-peso economy, joining other big economies namely NCR, CALABARZON, Central Luzon, Central Visayas, and Western Visayas.
Services accounted for the largest share with 60.9 percent or equivalent to PhP 620.08 billion. Industry accounted for about 24.6 percent or valued at PhP 250.94 billion, while AFF contributed the least to the total economy of Region XI with 14.5 percent or valued at PhP 147.18 billion.
Exports of goods and services to ROW records the highest increase in spending in Davao Region
Among the expenditure items in 2023, Exports of goods and services to ROW recorded the highest growth in Davao Region with 12.3 percent. Gross capital formation expanded by 5.9 percent, while household spending recorded a 5.7 percent increase in 2023. Imports of goods and services from ROW grew by 4.4 percent while the region’s government spending posted an increase of 3.8 percent (Figure 51).
Figure 51. Davao Region, Growth Rates by Expenditure Type: 2022-2023
At Constant 2018 Prices, in percent 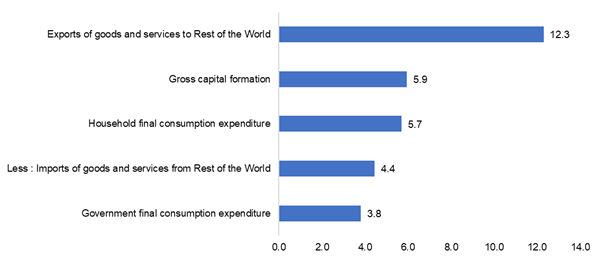
Source: Philippine Statistics Authority
With the 6.7 percent growth in 2023, Davao Region reached a trillion-peso economy, joining other big economies namely NCR, CALABARZON, Central Luzon, Central Visayas, and Western Visayas.
Services accounted for the largest share with 60.9 percent or equivalent to PhP 620.08 billion. Industry accounted for about 24.6 percent or valued at PhP 250.94 billion, while AFF contributed the least to the total economy of Region XI with 14.5 percent or valued at PhP 147.18 billion.
The per capita HFCE or the household spending of every person in the region increased by 4.2 percent from PhP 113,632 in 2022 to PhP 118,353 in 2023. This was lower than the national level per capita HFCE of PhP 136,247. (Figure 52)
Figure 52. Philippines and Davao Region,
Per Capita Household Final Consumption Expenditure: 2023
At Constant 2018 Prices, in Pesos 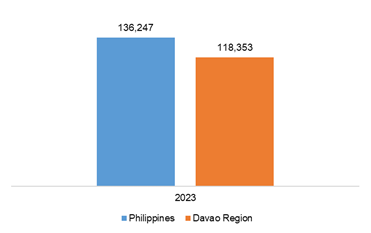
Source: Philippine Statistics Authority
REGION XII - SOCCSKSARGEN [back to top]
SOCCSKSARGEN’s economy expands by 3.5 percent in 2023
The economy of SOCCSKSARGEN grew by 3.5 percent in 2023, a slowdown from the 6.6 percent growth in 2022. The highest growth was recorded in Accommodation and food service activities with 17.2 percent. On the other hand, Manufacturing and AFF recorded contractions of 5.9 percent and 2.7 percent, respectively. (Figure 53)
Figure 53. SOCCSKSARGEN, Growth Rates by Industry: 2022-2023
At Constant 2018 Prices, in percent 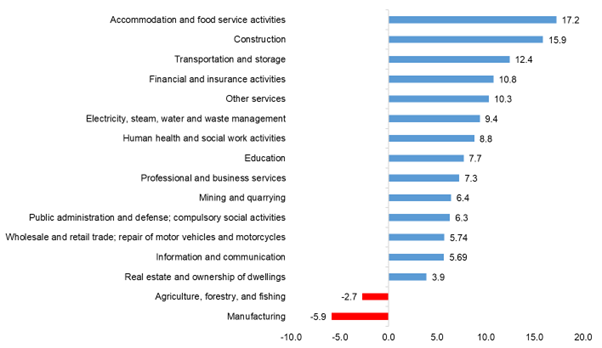
Source: Philippine Statistics Authority
Among the three major industries, Services, which contributed 51.0 percent to the regional economy, recorded the fastest growth at 7.9 percent. Industry, with 24.3 percent share, expanded by 1.3 percent, while AFF shared 24.8 percent after a 2.7 percent contraction in 2023.
Services and Industry were the biggest contributors to the region’s 3.5 percent growth in 2023 at 3.9 percentage points and 0.3 percentage point, respectively. On the other hand, AFF pulled down the growth by 0.7 percentage point.
SOCCSKSARGEN’s Gross capital formation and Household final consumption expenditure post the highest growths
SOCCSKSARGEN’s Gross capital formation posted the highest growth among the expenditure items with 6.5 percent. This was followed by Household final consumption expenditure with 5.5 percent, and Government final consumption expenditure with 3.4 percent. Meanwhile, Exports of goods and services to ROW and Imports of goods and services from ROW contracted by 18.5 percent and 4.5 percent, respectively. (Figure 54)
Figure 54. SOCCSKSARGEN, Growth Rates by Expenditure Type: 2022-2023
At Constant 2018 Prices, in percent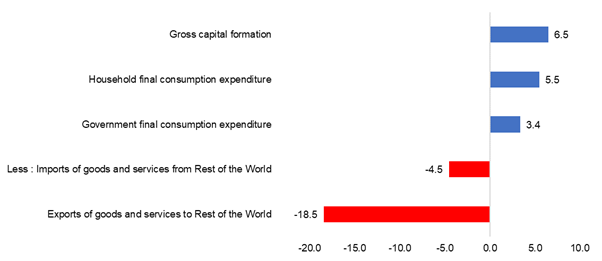
Source: Philippine Statistics Authority
The per capita HFCE of the region in 2023 was estimated at PhP 96,699, higher than the PhP 92,680 recorded in 2022. It was about PhP 39,547 lower than the national level of P136,247. (Figure 55)
Figure 55. Philippines and SOCCSKSARGEN,
Per Capita Household Final Consumption Expenditure (HFCE): 2023
At Constant 2018 Prices, in pesos 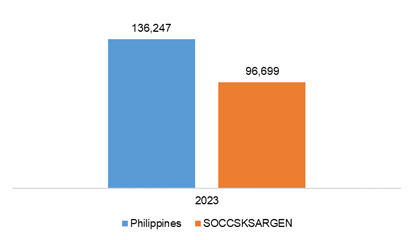
Source: Philippine Statistics Authority
REGION XIII - CARAGA [back to top]
Caraga’s economy grows by 4.9 percent in 2023
The economy of Caraga increased by 4.9 percent in 2023, slower than the 5.9 percent recorded growth rate in 2022. Among the industries, Other Services recorded the fastest growth with 25.4 percent. This was followed by Accommodation and food service activities with 14.8 percent, and Transportation and storage with 14.5 percent.
In 2023, all industries posted growth except for Manufacturing and AFF, which declined by 3.5 percent and 0.2 percent, respectively. Manufacturing accounted for the biggest share in the economy of the region at 13.8 percent. (Figure 56)
Of the 5.5 percent growth of the country in 2023, the region with a 1.6 percent share of the country's GDP contributed 0.1 percentage point.
Figure 56. Caraga Region, Growth Rates by Industry: 2022-2023
At Constant 2018 Prices, in percent 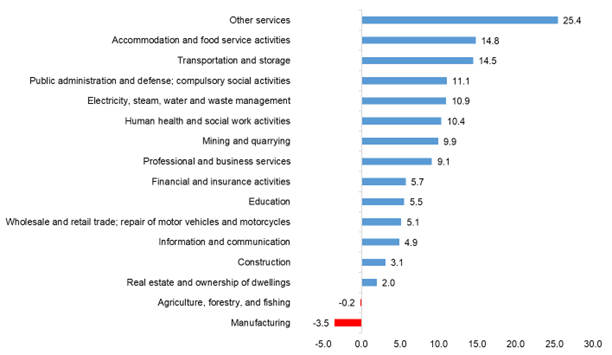
Source: Philippine Statistics Authority
Caraga’s Imports of goods and services from ROW continues to expand
Among expenditure items, the region’s Imports of goods and services from ROW continued to expand at 22.3 percent in 2023. Meanwhile, Government final consumption expenditure slightly improved to 3.4 percent, up from 2.9 percent in the previous year. Household final consumption expenditure, which accounted for 76.4 percent of the region’s economy, increased by 3.0 percent in 2023. However, it was a deceleration from the previous year of 7.4 percent growth. On the other hand, Exports of goods and services from ROW further declined by 7.1 percent in 2023, from 6.2 percent decrease in 2022. (Figure 57)
Figure 57. Caraga Region, Growth Rates by Expenditure Type: 2022-2023
At Constant 2018 Prices, in percent 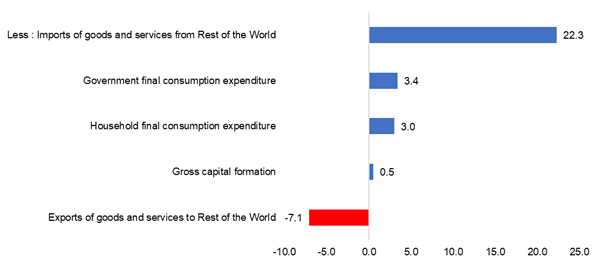
Source: Philippine Statistics Authority
The per capita HFCE of Caraga in 2023 was estimated at PhP 91,407 in 2023. It was higher than the previous year’s per capita household spending estimated at PhP 89,603. The region’s per capita was lower than that of the estimated per capita HFCE at the national level, which was estimated at PhP 136,247 in 2023. (Figure 58)
Figure 58. Philippines and Caraga,
Per Capita Household Final Consumption Expenditure: 2023
At Constant 2018 Prices, in pesos 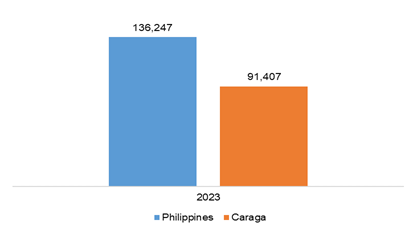
Source: Philippine Statistics Authority
BARMM - BANGSAMORO AUTONOMOUS REGION IN MUSLIM MINDANAO [back to top]
BARMM's economy grows 4.3 percent in 2023
The economic performance of the Bangsamoro Autonomous Region in Muslim Mindanao (BARMM) grew by 4.3 percent in 2023, a slower rate from the 6.6 percent growth posted the previous year. Despite the slowdown, all the industries posted positive growths. The top five fastest growing industries were: Financial and insurance activities, 15.7 percent; Mining and quarrying, 15.0 percent; Accommodation and food service activities, 11.4; Other services, 10.8 percent; and Transportation and storage, 9.6 percent. (Figure 59)
Figure 59. Bangsamoro Autonomous Region in Muslim Mindanao,
Growth Rates by Industry: 2022-2023,
At Constant 2018 Prices, in percent 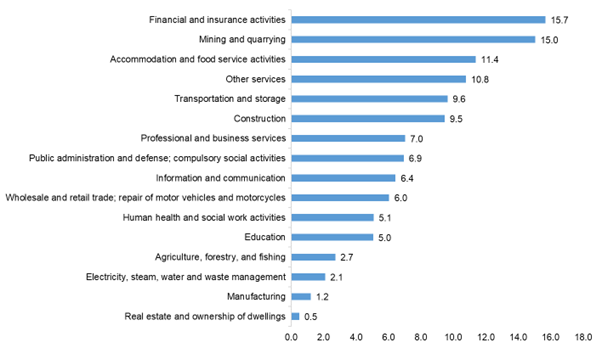
Source: Philippine Statistics Authority
Among the three major industries, Services accounted for the largest share of region’s total GRDP in 2023 at 41.0 percent, followed by AFF with 34.8 percent, and Industry with 24.1 percent.
BARMM’s Household final consumption expenditure posts the highest growth in 2023 at 7.5 percent
At the expenditure side, Household final consumption expenditure posted the highest growth among the expenditure items with 7.5 percent, followed by Government final consumption expenditure with 3.1 percent.
On the other hand, there was a decline to the following expenditure items: Gross capital formation, 0.6 percent; Export of goods and services to ROW, 8.7 percent; and Imports of goods and services from ROW, 13.9 percent. (Figure 60)
Figure 60. Bangsamoro Autonomous Region in Muslim Mindanao,
Growth Rates by Expenditure Type: 2022-2023
At Constant 2018 Prices, in percent 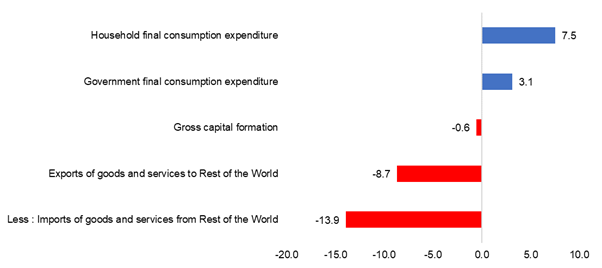
Source: Philippine Statistics Authority
In 2023, BARMM’s per capita HFCE was estimated at PhP 66,419, lower than the national level of PhP 136,247. (Figure 61)
Figure 61. Comparative Per Capita Household Final Consumption Expenditure
Philippines and Bangsamoro Autonomous Region in Muslim Mindanao: 2023
At Constant 2018 Prices, in pesos 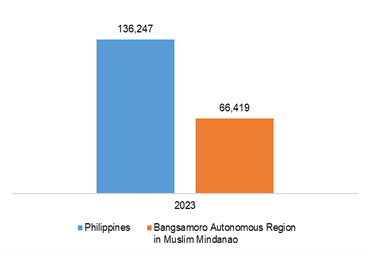
Source: Philippine Statistics Authority