
Highlights of the International Merchandise Trade Statistics of the Philippines, First Semester 2023
A. TOTAL EXTERNAL TRADE AND BALANCE OF TRADE
- Total external trade increased
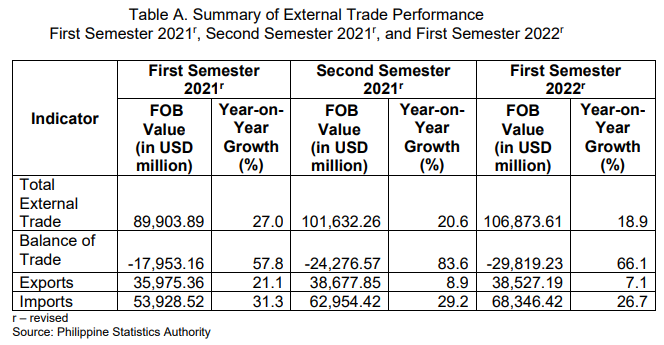
The country’s total external trade in goods increased to USD 106.87 billion in the first semester of 2022, from USD 89.90 billion in the same semester of 2021. This indicates an annual increase of 18.9 percent in the first semester of 2022. In the second semester of 2021, the total trade rose by 20.6 percent, while in the first semester of 2021, the total trade grew at an annual rate of 27.0 percent.
Of the total external trade, 64.0 percent were imported goods and the rest were exported goods. (Table A and Table 1)
- Trade deficit grew by 66.1 percent
The balance of trade in goods (BoT-G) is the difference between the value of export and import. The BoT-G in the first semester of 2022 amounted to USD -29.82 billion, indicating a trade deficit with an annual increase of 66.1 percent. In the second semester of 2021, the trade deficit rose at an annual rate of 83.6 percent, while in the first semester of 2021, the trade deficit increased by 57.8 percent. (Figure 1 and Table A)

B. EXPORTS
- Total export sales went up by 7.1 percent
The country’s total export sales in the first semester of 2022, amounting to USD 38.53 billion, reflected an annual rate of 7.1 percent from the USD 35.98 billion total export sales in the first semester of 2021. In the second semester of 2021, the total export sales went up at an annual rate of 8.9 percent. (Tables A and 2)
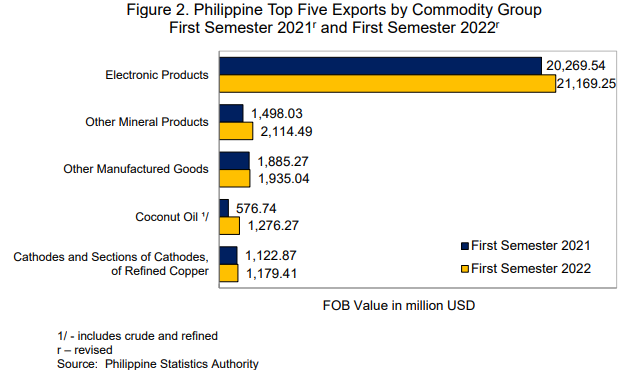
Of the top 10 major commodity groups, six recorded annual increases in terms of the value of exports. These were coconut oil (121.3%), other mineral products (41.2%), chemicals (9.7%), cathodes and sections of cathodes, of refined copper (5.0%), electronic products (4.4%), and other manufactured goods (2.6%). (Tables B and 2)

- Electronic products commodity group remained the highest on export sales
By commodity group, electronic products continued to be the country’s top export in the first semester of 2022 with total earnings of USD 21.17 billion. This amount accounted for 54.9 percent of the total exports during the period. This was followed by other mineral products with an export value of USD 2.11 billion (5.5%); and other manufactured goods, which amounted to USD 1.94 billion (5.0%). (Figure 2 and Table 2)
- Manufactured goods still comprised the biggest chunk of total exports among major types of goods
By major type of goods, exports of manufactured goods shared the biggest to the total exports in the first semester of 2022 amounting to USD 30.39 billion (78.9%). This was followed by mineral products with a share of USD 4.07 billion (10.6%) and total agro-based products which contributed USD 3.27 billion (8.5%). (Figure 3 and Table 5)

- Total export value of Personal Protective Equipment and medical supplies decreased
The total export value for Personal Protective Equipment (PPE) and medical supplies in the first semester of 2022 dropped to USD 6.44 million. This represents an annual decrease of -46.1 percent from its value of USD 11.95 million in the first semester of 2021. The annual decline in the export value for these medical items in the second semester of 2021 was recorded at -80.2 percent, while in the first semester of 2021, it went down by -82.7 percent.
The annual declines in export for surgical face mask at -53.7 percent, other face mask (non-surgical/non-medical masks including masks made of cloth) at -37.9 percent, and protective clothing at -8.9 percent contributed to the decrement of export value for PPE and medical supplies in the first semester of 2022. (Tables C and 7)

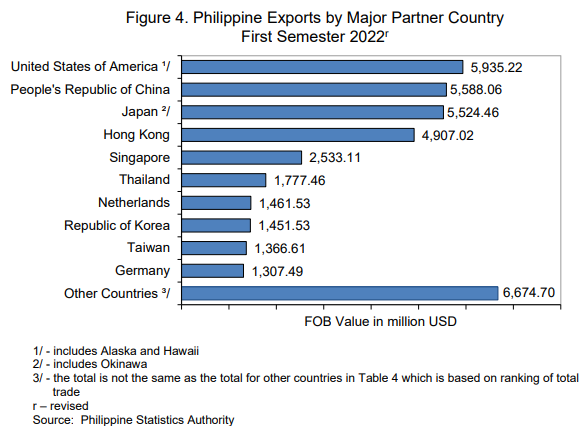
- United States of America contributed the highest export value
By major trading partner, exports to United States of America (USA) comprised the highest export value amounting to USD 5.94 billion or a share of 15.4 percent to the total exports in the first semester of 2022.
Completing the top five major export trading partners with their export values and percent shares to the total exports were:
- People’s Republic of China, USD 5.59 billion (14.5%);
- Japan, USD 5.52 billion (14.3%);
- Hong Kong, USD 4.91 billion (12.7%); and
- Singapore, USD 2.53 billion (6.6%). (Figure 4 and Table 4)
- Netherlands topped total exports among European Union member countries
Exports to European Union (EU) reached USD 4.45 billion or 11.6 percent of the total export receipts in the first semester of 2022. Revenue from exports to Netherlands had the highest share of USD 1.46 billion or 32.8 percent of the total exports to EU member countries. (Figure 5 and Table 11)

The top five exported goods to EU member countries with their export receipts and percent shares to the total EU exports were:
- electronic products, USD 2.61 billion (58.7%);
- coconut oil, USD 629.14 million (14.1%);
- other manufactured goods, USD 192.12 million (4.3%);
- machinery and transport equipment, USD 131.47 million (3.0%); and
- tuna, USD 114.74 million (2.6%). (Table 12)
- Singapore led the Association of Southeast Asian Nations member countries in terms of total exports
Total exports to Association of Southeast Asian Nations (ASEAN) member countries reached USD 6.89 billion or 17.9 percent of the country’s total exports during the first semester of 2022.
Exports to Singapore accounted for the highest share of USD 2.53 billion or 36.7 percent of the total exports to ASEAN member countries. (Figure 6 and Table 11)

The leading export commodities to ASEAN member countries and their corresponding export values and percent shares to the total ASEAN exports were:
- electronic products, USD 4.16 billion (60.4%);
- cathodes and sections of cathodes, of refined copper, USD 547.10 million (7.9%);
- other manufactured goods, USD 337.44 million (4.9%);
- other mineral products, USD 263.88 million (3.8%); and
- coconut oil, USD 244.66 million (3.5%). (Table 12)
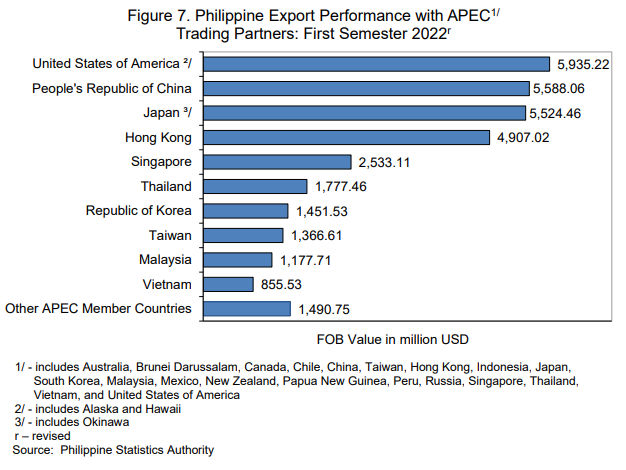
- USA topped exports among Asia-Pacific Economic Cooperation member countries
Export receipts to Asia-Pacific Economic Cooperation (APEC) member countries amounted to USD 32.61 billion or 84.60 percent of the total exports in the first semester of 2022.
Export receipts to the USA stood as the highest total export valued at USD 5.94 billion or 18.2 percent of the country’s total exports to APEC member countries. (Figure 7 and Table 14)
The top five exported goods to APEC member countries and their corresponding export sales and percent shares to the total APEC exports were:
- electronic products, USD 18.13 billion (55.6%);
- other mineral products, USD 2.05 billion (6.3%);
- other manufactured goods, USD 1.65 billion (5.0%);
- cathodes and sections of cathodes, of refined copper, USD 1.18 billion (3.6%); and
- ignition wiring sets and other wiring sets used in vehicles, USD 1.07 billion (3.3%). (Table 15)
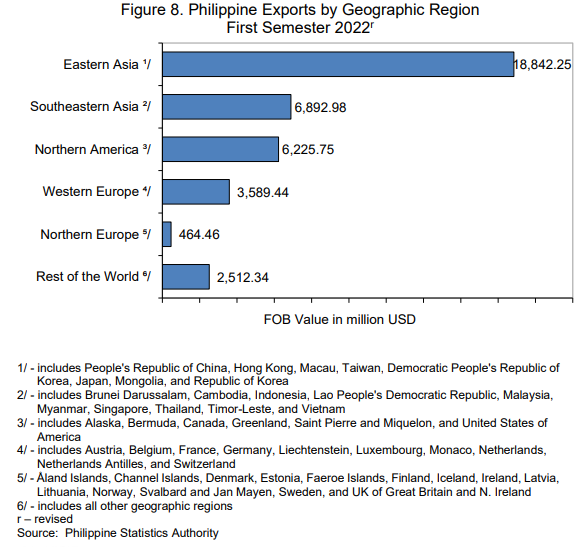
- Eastern Asia contributed the highest export value by geographic region
By geographic region, Eastern Asia comprised the highest export value amounting to USD 18.84 billion in the first semester of 2022. This was followed by Southeastern Asia with an export value of USD 6.89 billion and Northern America with USD 6.23 billion worth of export value. (Figure 8 and Table 17)
C. IMPORTS
- Import value increased
The total imported goods in the first semester of 2022, which amounted to USD 68.35 billion, increased at an annual rate of 26.7 percent. In the second semester of 2021, the annual rate rose by 29.2 percent, while in the first semester of 2021, the total import value increased by 31.3 percent. (Figure 1 and Table A)
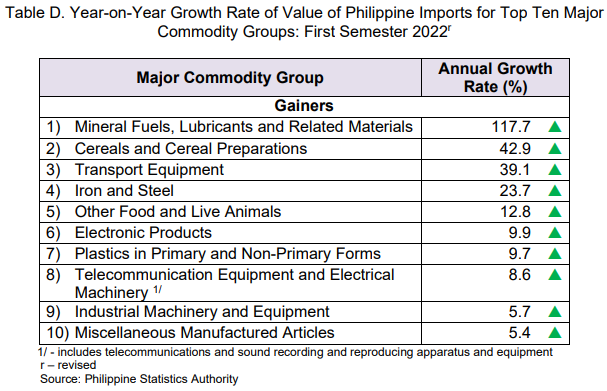
The annual growth in the value of imported goods in the first semester of 2022 was mainly due to the increases in the values of all the top 10 major commodity groups with mineral fuels, lubricants and related materials having the fastest annual growth rate of 117.7 percent. This was followed by cereals and cereal preparations, which rose by 42.9 percent annually; and transport equipment by 39.1 percent. (Tables D and 3)
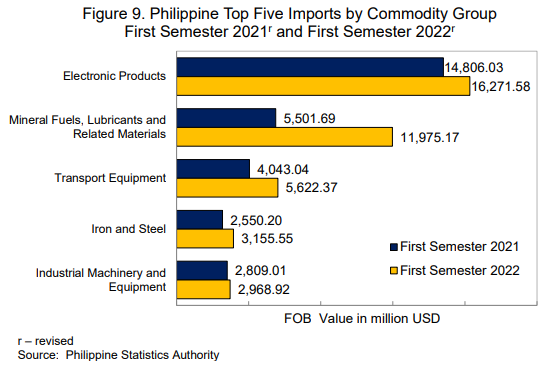
- Electronic products accounted for the highest import value among commodity groups
Most of the imported goods were electronic products with an import value of USD 16.27 billion or a share of 23.8 percent to the total imports in the first semester of 2022. This was followed by mineral fuels, lubricants and related materials, valued at USD 11.98 billion (17.5%); and transport equipment, which amounted to USD 5.62 billion (8.2%). (Figure 9 and Table 3)
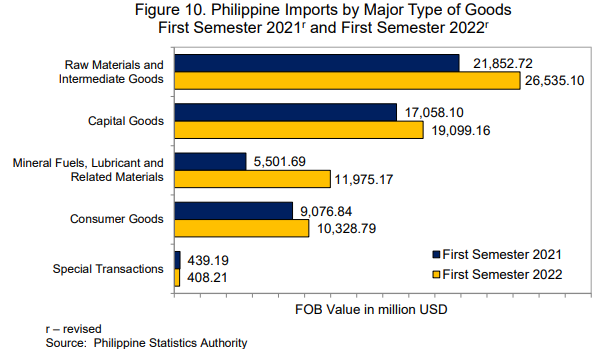
- Imports of raw materials and intermediate goods contributed the highest
By major type of goods, imports of raw materials and intermediate goods accounted for the largest share to the total imports amounting to USD 26.54 billion (38.8%) in the first semester of 2022. Imports of capital goods ranked second with a share of USD 19.10 billion (27.9%), followed by mineral fuels, lubricants and related materials with USD 11.98 billion (17.5%). (Figure 10 and Table 6)
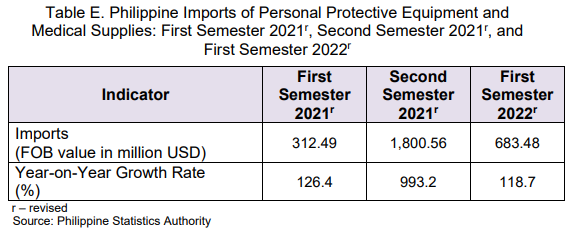
- Total import value of Personal Protective Equipment and medical supplies including COVID-19 vaccine increased
The total import value for Personal Protective Equipment (PPE) and medical supplies, including Coronavirus disease 2019 (COVID-19) vaccine, grew to USD 683.48 million in the first semester of 2022, indicating an annual increment of 118.7 percent from its value of USD 312.49 million in the first semester of 2021.
In the first semester of 2022, the total import for COVID-19 vaccine was valued at USD 566.71 million.
The annual growth rate of import value for PPE and medical supplies, including COVID-19 vaccine, was recorded at 993.2 percent in the second semester of 2021, while in the first semester of 2021, the annual increase was 126.4 percent.
The annual increments noted in COVID-19 vaccine (394.5%) and safety headgear (115.4%) have increased the total import value for PPE and medical supplies, including COVID-19 vaccine in the first semester of 2022. (Tables E and 8)
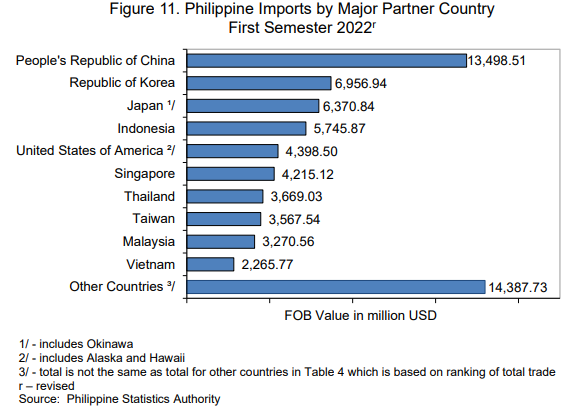
- People’s Republic of China had the highest import value
The People’s Republic of China was the country’s biggest supplier of imported goods valued at USD 13.50 billion or 19.8 percent of the total imports in the first semester of 2022.
Completing the top five major import trading partners with their corresponding import payments and percent shares to the total imports were:
- Republic of Korea, USD 6.96 billion (10.2%);
- Japan, USD 6.37 billion (9.3%);
- Indonesia, USD 5.75 billion (8.4%); and
- USA, USD 4.40 billion (6.4%). (Figure 11 and Table 4)
- Germany topped total imports among EU member countries
The total imports from EU member countries amounted to USD 4.45 billion or 6.5 percent of the total imports in the first semester of 2022. Import payments from Germany top the country’s imports from EU member countries at USD 0.96 billion or 21.6 percent. (Figure 12 and Table 11)
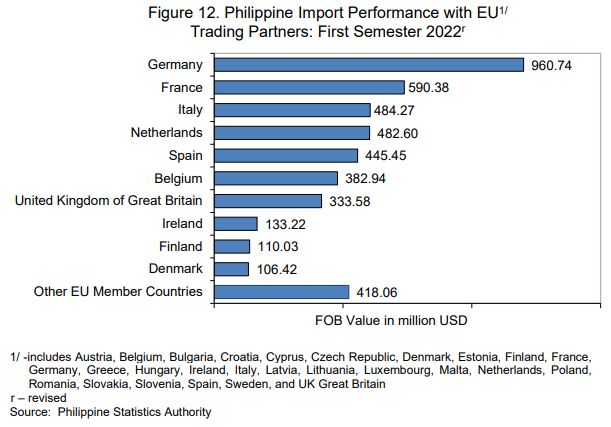
The leading imported goods from EU member countries and their corresponding import payments and percent shares to total EU imports were:
- electronic products, USD 777.63 million (17.5%);
- transport equipment, USD 649.47 million (14.6%);
- medicinal and pharmaceutical products, USD 628.16 million (14.1%);
- other food and live animals, USD 378.68 million (8.5%); and
- industrial machinery and equipment, USD 296.06 million (6.7%). (Table 13)
- Indonesia led the ASEAN member countries in terms of imports
The total imports from ASEAN member countries were worth USD 19.60 billion or 28.7 percent of the country’s total imports in the first semester of 2022.
Majority of the imports came from Indonesia, which amounted to USD 5.75 billion or 29.3 percent of the total imports from ASEAN member countries. (Figure 13 and Table 11)
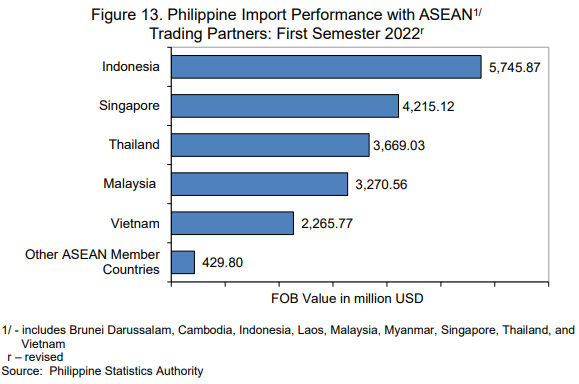
The top five imported goods from ASEAN member countries were:
- mineral fuels, lubricants and related materials, USD 4.82 billion (24.6%);
- electronic products, USD 2.96 billion (15.1%);
- transport equipment, USD 2.73 billion (13.9%);
- other food and live animals, USD 1.02 billion (5.2%); and
- animals and vegetable oils and fats, USD 850.48 million (4.3%). (Table 13)
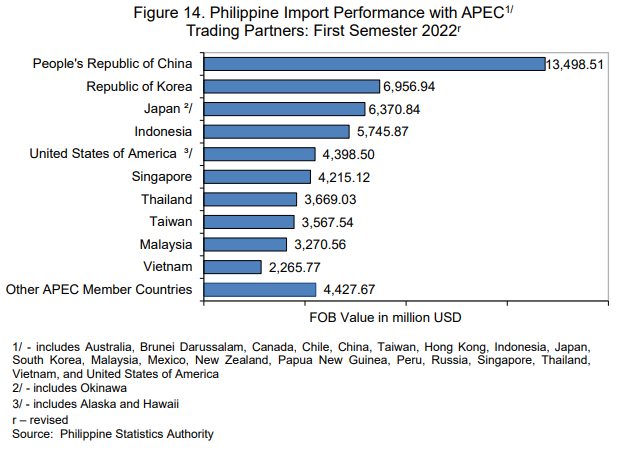
- People's Republic of China topped total imports from APEC member countries
Import payments from APEC member countries summed up to USD 58.39 billion or 85.4 percent of the total import. People’s Republic of China registered the highest import value among APEC member countries which amounted to USD 13.50 billion (19.8%). (Figure 14 and Table 14)
The top five imported goods from APEC member countries and their corresponding import payments and percent shares to total APEC imports were:
- electronic products, USD 15.29 billion (26.2%);
- mineral fuels, lubricants and related materials, USD 9.94 billion (17.0%);
- transport equipment, USD 4.44 billion (7.6%);
- iron and steel, USD 3.09 billion (5.3%); and
- industrial machinery and equipment, USD 2.58 billion (4.4%). (Table 16)
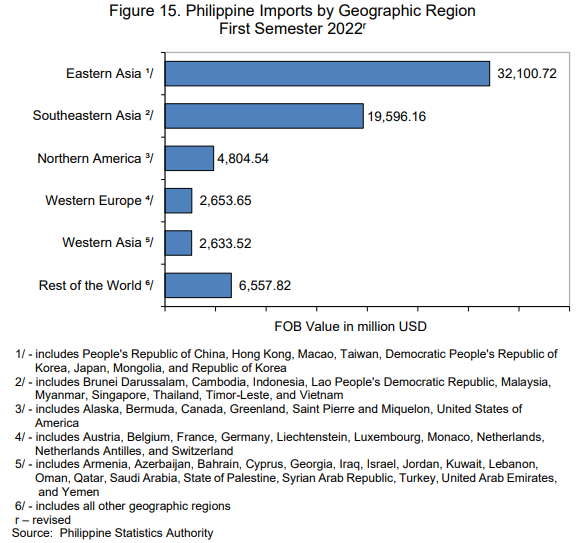
- Eastern Asia contributed the highest import value by geographic region
By geographic region, USD 32.10 billion of the country’s imports in the first semester of 2022 were from Eastern Asia. This was followed by Southeastern Asia whose import value amounted to USD 19.60 billion and Northern America valued at USD 4.80 billion. (Figure 15 and Table 17)
DENNIS S. MAPA, Ph.D.
Undersecretary
National Statistician and Civil Registrar General
Explanatory Notes
This Special Release is a summary of the monthly revised International Merchandise Trade Statistics for the first semester of 2022.
Export and import trade statistics are compiled by the Philippine Statistics Authority (PSA) from export and import documents submitted to the Bureau of Customs (BOC) by exporters and importers or their authorized representatives as required by law.
The following are documents collected, either in electronic or hard copies:
- Export Declaration (ED – DTI form);
- Informal Import Declaration and Entry (BOC Form 177); and
- Single Administrative Documents (SAD) for Export Declaration (ED) and Import Entry and Internal Revenue Declaration (IEIRD).
The electronic copies of all documents that pass through the online system are provided by BOC, Philippine Economic Zone Authority (PEZA), and Value Added Service Providers (VASPs) to PSA on a monthly basis through email and via shared Google Drive.
The electronic copies of the SAD Export Declarations (SAD-ED) from the Automated Export Documentation System (AEDS) of the BOC are being utilized to generate export statistics. The AEDS is a paperless transaction in lieu of the manual filling up of export documents.
Moreover, an electronic copy of the Import Entry and Internal Revenue Declaration (SAD-IEIRD) is utilized to capture the monthly import figures. The SAD-IEIRD is an import document submitted online either by brokers or companies. These are transactions that pass through the Automated Cargo Operating System (ACOS), now called the e2m (electronic to mobile) customs system, which is implemented through the BOC e-Customs Project.
This special release includes late entries from documents received beyond the cut-off date which is every 25th day of the month. All documents received after the cut-off date are included in the generation of the revised results.
The 2019 Philippine Standard Commodity Classification (PSCC) is used to classify the commodities at 10-digit code level for statistical purposes.
Data requests on export and import statistics can be made at the PSA, Economic Sector Statistics Service, Trade Statistics Division with telephone number (02) 8376-1975 or email address j.soliven@psa.gov.ph.