
2018 Census of Philippine Business and Industry: Construction Establishments
Number of establishments grows by 19.3 percent
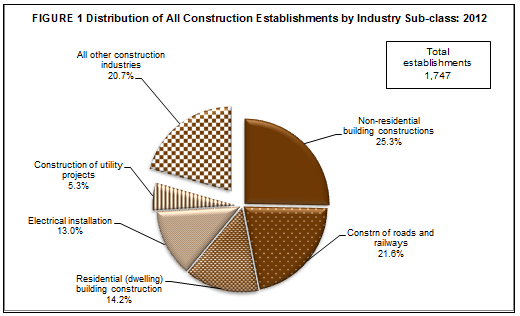
The final results of the 2012 Census of Philippine Business and Industry (CPBI) showed that there were 1,747 establishments engaged in construction in the formal sector of the economy. This number was higher by 19.3 percent from the 1,464 establishments recorded in 2010. The positive growth in the number of establishments was attributed to the three-digit increases of six industries namely: construction of other civil engineering projects (515.4%), plumbing, heat and air-conditioning installation (173.9%), construction of utility projects (155.6%), painting and related work (122.2%), non-residential building constructions (109.5%), and site preparation and demolition (100.0%).
Non-residential building constructions recorded the most number of establishments with 442 accounting for 25.3 percent of the total. This was followed closely by construction of roads and railways with 377 establishments or 21.6 percent share to total. Other industries with more than five percent share to the total number of construction establishments were as follows:
- residential (dwelling) building constructions, 248 establishments (14.2%)
- electrical installation, 227 establishments (13.0%)
- construction of utility projects, 92 establishments (5.3%)
Figure 1 shows the distribution of all construction establishments by industry sub-class in 2012.
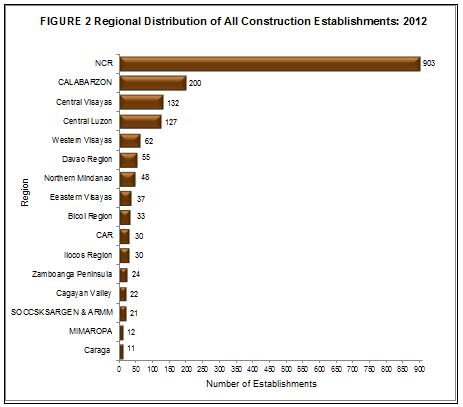
Among the country’s 17 regions, majority of construction establishments were located in the National Capital Region (NCR) with 903 establishments accounting for more than half (51.7%) of the total. Other region in the top five in terms of the number of establishments were as follows:
- CALABARZON, 200 establishments (11.4%)
- Central Visayas, 132 establishments (7.6%)
- Central Luzon, 127 establishments (7.3%)
- Western Visayas, 62 establishments (3.5%)
Figure 2 shows the regional distribution of all construction establishments in 2012.
Construction of roads and railways employs the highest number of workers
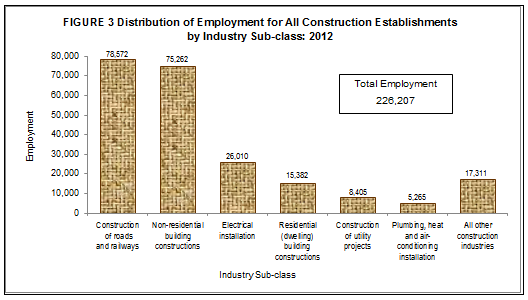
In 2012, construction establishments employed a total of 226,207, an increase of 63.1 percent from the employment figure of 138,704 recorded in 2010.
By industry, construction of roads and railways hired the most number of workers with 78,572 or 34.7 percent of the total, followed closely by non-residential building constructions with 75,262 workers or 33.3 percent. Electrical installation came next with 26,010 workers (11.5%). Residential (dwelling) building constructions, which ranked third in terms of the number of establishments, hired only 15,382 workers or 6.8 percent of the total. Figure 3 shows the distribution of employment for all construction establishments by industry sub-class in 2012.
NCR, having the most of the number of establishments, employed the bulk of workers reaching 157,314 or 69.5 percent of the total. Central Visayas with 16,876 workers (7.5%) ranked a far second. Completing the top three regions with the most number of workers is CALABARZON with 16,225 (7.2%).
The average number of workers per establishment for the sector was recorded at 129. Among industries, the average number of workers per establishment was above the national average for construction of roads and railways with 208 workers and non-residential building constructions with 170 workers.
Average annual pays is PHP220,544
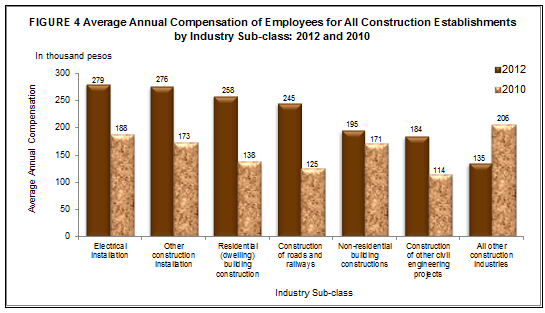
Total compensation paid in 2012 amounted to PHP49.8 billion, indicating an average annual compensation of PHP220,544 per employee. Compared to the average annual pay of PHP153,505 in 2010, average pay increased by 43.7 percent.
Employees working in electrical installation received the highest average annual compensation amounting to PHP278,520 per employee. The other industries that exceeded the national average annual compensation were:
- other construction installation, PHP275,944
- residential (dwelling) building constructions, PHP257,763
- construction of roads and railways, PHP245,143
- site preparation and demolition, PHP238,228
Figure 4 compares the average annual compensation of employees for all construction establishments by industry sub-class in 2012 and 2010.
By region, construction employees in Bicol Region received the highest average annual pay of PHP313,615. This was followed by employees in NCR and Eastern Visayas receiving an average annual compensation of PHP246,153 and PHP213,452 respectively.
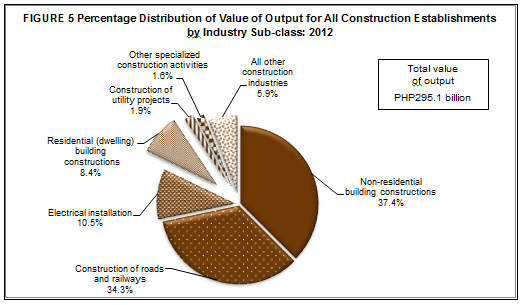
Value of output amounts to PHP295.1 billion
Total value of output generated by all construction establishments amounting to PHP295.1 billion, increased by 71.0 percent compared with PHP172.6 billion produced in 2010.
Among industries, non-residential building constructions generated the highest output value of PHP110.5 billion or 37.4 percent of the total. Construction of roads and railways and electrical installation followed with respective output share of PHP101.2 billion (34.3%) and PHP30.9 billion (10.5%). Residential (dwelling) building constructions was the fourth highest producer with PHP24.9 billion (8.5%) of the total.
Figure 5 shows the distribution of value of output for all construction establishments by industry sub-class in 2012.
Among regions, NCR shared the biggest output value amounting to PHP217.8 billion, comprising almost three-fourths (73.8%) of the total value of output. This was distantly followed by Central Visayas with an output value of PHP15.8 billion (5.3%) and CALABARZON with PHP15.7 billion (5.3%).
Total expense is PHP269.4 billion, non-residential building constructions spends the most
Total expense in 2012 incurred in construction operation amounted to PHP269.4 billion.
Among industries, non-residential building constructions incurred the highest expense amounting to PHP99.7 billion or 37.0 percent of the total. Construction of roads and railways placed second with PHP94.5 billion (35.1%). Electrical installation came next with a total expense of PHP25.7 billion (9.5%).
NCR spent the highest among the regions at PHP197.7 billion (73.4%). This was followed distantly by Central Visayas and CALABARZON spending PHP14.9 billion (5.5%) and PHP14.8 billion (5.5%), respectively.
Other construction installation industry records the highest returns
Income per expense ratio for construction establishments in 2012 was recorded at 1.12, indicating that for every peso spent PHP1.12 was realized in terms of income.
Among industries, other construction installation recorded the highest income per expense ratio of 1.51. Industries having an income-expense ratio above the national figure were as follows:
- electrical installation (1.22 income per peso expense)
- non-residential building constructions (1.13 income per peso expense)
Among regions, establishments in Zamboanga Peninsula registered the highest return at 3.30 income per peso expense. Cagayan Valley ranked second with 1.32.
Value added rises by 179.9 percent
In 2012, value added generated by all construction establishments reached PHP117.7 billion, increasing by 179.9 percent from PHP42.0 billion produced in 2010. All the construction industries recorded growth in value added except for the construction of utility projects which posted a decrease of 6.5 percent from PHP2.1 billion in 2010 to PHP1.9 billion in 2012.
Among industries, non-residential building constructions contributed the biggest share amounting to PHP45.5 billion or 38.6 percent of the total. Construction of roads and railways ranked second with PHP41.2 billion (35.0%) while electrical installation came next with PHP14.9 billion (12.7%).
By region, NCR contributed the biggest share to value added estimated at PHP92.2 billion or 78.3 percent of the total, followed by CALABARZON with PHP5.6 billion (4.8%) and Central Visayas with PHP 4.9 billion (4.2%).
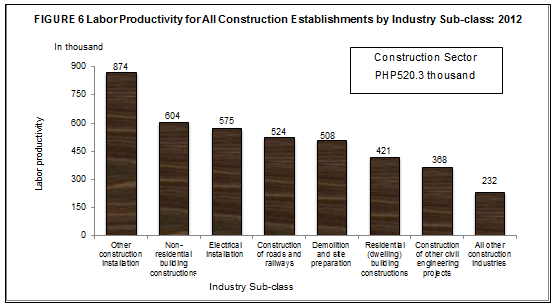
Labor productivity is PHP520.3 thousand per worker
Labor productivity, defined as value added per worker, was estimated at PHP520.3 thousand per worker, higher by 71.6 percent compared to PHP303.1 thousand recorded in 2010.
By industry, other construction installation recorded the highest labor productivity with PHP873.9 thousand per worker. Non-residential building constructions followed with PHP604.0 thousand per worker. Labor productivity of other industries exceeding the national average were electrical installation with PHP574.6 thousand per worker and construction of roads and railways with PHP523.9 thousand per worker.
Figure 6 shows the labor productivity for all construction establishments by industry sub-class in 2012.
Among regions, Zamboanga Peninsula was the most productive generating PHP1.5 billion per worker. This was followed by Bicol Region with PHP776.2 thousand per worker and CARAGA with PHP762,119.
Gross addition to tangible fixed assets reaches PHP13.1 billion
Gross addition to tangible fixed assets, defined as capital expenditures less sale of fixed assets, rose by 335.0 percent from PHP3.0 billion in 2010 to PHP13.1 billion in 2012.
Non-residential building constructions with PHP6.1 billion, accounted for almost half (46.9%) of the total gross addition to tangible fixed assets, followed by construction of roads and railways with PHP5.2 billion (39.8%). Residential (dwelling) building constructions ranked third with PHP801.4 million (6.1%)
Total subsidies received amounts to PHP10.9 million
Total subsidies provided by the government to support the business operation of construction establishments amounted to PHP10.9 million.
Construction of roads and railways received PHP7.7 million (70.8%) of the total and the remaining PHP3.2 million (29.2%) by construction of utility projects.
TECHNICAL NOTES
Introduction
This Special Release presents the final results of the 2012 Census of Philippine Business and Industry (CPBI) for the Construction Sector.
The 2012 CPBI is a forerunner of the 2006 CPBI and one of the designated statistical activities of the former National Statistics Office (NSO) now Philippine Statistics Authority (PSA). Data collected from the census provide information on the levels, structure, performance, and trends of economic activities of the country. It also serves as benchmark information in the measurement and comparison of national and regional economic growth.
The census was conducted nationwide in April 2013 with the year 2012 as the reference period of data, except for employment which is as of November 15, 2012.
The income and expense account in the Financial Statement of establishment was adopted in the design of sectoral questionnaires to capture data for the 2012 CPBI. This allowed respondents of the census an ease in accomplishing the questionnaires. Income and revenue have the same concept in recording financial transaction of establishments while expense is cost incurred by the establishment treated on a consumed basis.
Data are presented at the national, regional and industry group or 5-digit 2009 Philippine Standard Industrial Classification (PSIC).
Legal Authority
The conduct of the CPBI is governed by authority of the following legislative acts and presidential directives:
- Commonwealth Act No. 591 (An Act to Create the Bureau of the Census and Statistics to consolidate statistical activities of the government therein)
- Presidential Decree No. 418 (Reconstituting the Bureau of the Census and Statistics as a new agency to be known as the National Census and Statistics Office, under the administrative supervision of the National Economic Development Authority)
- Executive Order No. 121 (Reorganization Act of the Philippine Statistical System)
- Executive Order 352 (Designation of Statistical Activities that will generate critical data for decision-making by the Government and the Private Sector)
- Executive Order 5 (Strengthening the National Statistics Office)
Scope and Coverage
The 2012 CPBI covered establishments engaged in the formal sector of the economy classified by economic activity under the 2009 PSIC, namely:
- Agriculture, Forestry and Fishing (A)
- Mining and Quarrying (B)
- Manufacturing (C)
- Electricity, Gas, Steam, and Air Conditioning Supply (D)
- Water Supply; Sewerage, Waste Management and Remediation Activities (E)
- Construction (F)
- Wholesale and Retail Trade; Repair of Motor Vehicles and Motorcycles (G)
- Transportation and Storage (H)
- Accommodation and Food Service Activities (I)
- Information and Communication (J)
- Financial and Insurance Activities (K)
- Real Estate Activities (L)
- Professional, Scientific and Technical Activities (M)
- Administrative and Support Service Activities (N)
- Education (P)
- Human Health and Social Work Activities (Q)
- Arts, Entertainment and Recreation (R)
- Other Service Activities (S)
The census was confined to the formal sector of the economy, which consists of the following:
- All establishments with total employment (TE) of 10 and over
- All establishments with TE less than 10, except those with legal organization classified as single proprietorship and economic organization classified as single establishments.
Unit of Enumeration
The units of enumeration for the 2012 CPBI are the establishment and enterprise. However, this special release is confined to the results of construction sector with establishment as the unit of enumeration.
An establishment is defined as an economic unit under a single ownership or control which engages in one or predominantly one kind of activity at a single fixed location.
For the construction sector, the establishment is defined in operational terms to take into account the organization and record-keeping practices by making the single physical location and activity criteria more flexible, hence, the kind-of-activity unit (KAU) was used. KAU is ‘the unit that is engaged in the production of the most homogeneous group of goods and services, usually at one location, but sometimes over a wider area, for which separate records are available that can provide data concerning the production of these goods and services and the materials, labor and physical resources used in this production.”
Classification of Establishments
An establishment is categorized by its economic organization, legal organization, industrial classification, employment size, and geographic location.
Economic Organization refers to the organizational structure or role of the establishment in the organization. An establishment may be single establishment, branch, establishment and main office with branches elsewhere, main office only, and ancillary unit other than main office.
Legal Organization refers to the legal form of the economic entity which owns the establishment. An establishment may be single proprietorship, partnership, government corporation, stock corporation, non-stock corporation, and cooperative.
The industrial classification of an economic unit was determined by the activity from which it derives its major income or revenue. The 2009 PSIC was utilized to classify economic units according to their economic activities.
The size of an establishment is determined by its total employment (TE) as of specific date.
Geographic Classification. Establishments are also classified by geographic area using the Philippine Standard Geographic Code (PSGC) classification.
Methodology
All establishments in the formal sector for the Construction Sector were covered on a 100 percent or on a certainty basis because of their relatively small number.
The estimate of the total of a characteristic  in an industry domain in each geographic domain (region) is
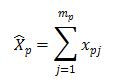
where:
p= 1, 2,..., 17 regions (geographic domains)
xpj= value of the jth establishment in an industry domain within each region
j= 1, 2, 3, …,mp establishments
mp= number of establishments in an industry domain within each region
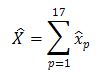
National level estimate of a characteristics by industry domain  was obtained by aggregating separately the estimates for the particular industry domain from all the regions.
Response Rate
Response rate for Construction Sector was 94.3 percent. These included receipts of "good" questionnaires, partially accomplished questionnaires, reports of closed, moved out or transferred, out of scope, refusals, duplicates, and referrals.
Reports of the remaining non-reporting establishments were imputed based on established imputation methods and from other available administrative data sources. However, reports of establishments which were found to be duplicates, out of scope and out of business in 2012 were not imputed.
Limitation of Data
Only the formal sector was covered in the survey.
Data for demolition and site preparation industries and SOCCSKSARGEN and ARMM regions were combined so as not to disclose individual establishment’s data.
Concepts and Definitions of Terms
Economic activity is the establishment’s source of income. If the establishment is engaged in several activities, its main economic activity is that which earns the biggest income or revenue.
Total employment is the number of persons who worked in for the establishment as of November 15, 2012.
Paid employees are all persons working in the establishment and receiving pay, as well as those working away from the establishment paid by and under the control of the establishment. Included are all employees on sick leave, paid vacation or holiday. Excluded are consultants, home workers, receiving pure commissions only, and workers on indefinite leave.
Compensation includes salaries and wages, separation/retirement/terminal pay, gratuities, and payments made by the employer in behalf of the employees such as contribution to SSS/GSIS, ECC, PhilHealth, Pag-ibig, etc.
Salaries and wages are payments in cash or in kind to all employees, prior to deductions for employee’s contributions to SSS/GSIS, withholding tax, etc. Included are total basic pay, overtime pay and other benefits.
Income or Revenue refers to cash received and receivables for goods/products and by-products sold and services rendered.
E-commerce refers to the selling of products or services over electronic systems such as Internet Protocol-based networks and other computer networks. Electronic Data Interchange (EDI) network, or other on-line system. Excluded are orders received from telephone, facsimile and e-mails.
Cost refers to all expenses incurred during the year whether paid or payable. Valuation is at purchaser prices including taxes and other charges, net of rebates, returns and allowances. Goods and services received by the establishment from other establishments of the same enterprise are valued as though purchased.
Expense refers to cost incurred by the establishment during the year whether paid or payable. This is treated on a consumed basis.
Intermediate expense are expenditures incurred in the production of goods such as materials and supplies purchased, fuels purchased, electricity and water purchased, and industrial services done by others plus beginning inventory of materials, supplies and fuels less ending inventory of materials, supplies and fuels.
Value added is gross output less intermediate cost. Gross output for the construction sector is value of output plus non-industrial services done for others (except rent income from land). Intermediate input is intermediate expenses plus non-industrial services done by others (except rent expense for land) and other costs.
Value of output represents the sum of the receipts from value of domestic construction put in place, net income from construction activities abroad, industrial services done for others, value of products manufactured and goods sold in the same condition as purchased less the cost of goods sold; and value of fixed assets produced on own account and change in inventories of construction-in-progress, finished products and work-in-progress.
Gross addition to tangible fixed assets is equal to capital expenditures less sale of fixed assets, including land.
Change in inventories is equivalent to the value of inventories at the end of the year less the value of inventories at the beginning of the year.
Inventories refer to the stock of goods owned by and under the control of the establishment as of a fixed date, regardless of where the stocks are located. Valuation is at current replacement cost in purchaser prices. Replacement cost is the cost of an item in terms of its present price rather than its original cost.
Subsidies are all special grants in the form of financial assistance or tax exemption or tax privilege given by the government to aid and develop an industry.