
Release Date :
RICE STOCK
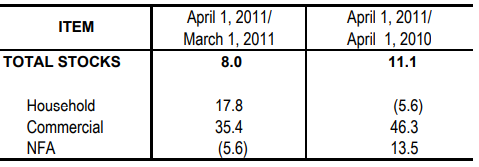
- The total rice stock inventory as of April 1, 2011 was 3.08 million metric tons (Figure 1). This was 8.0 percent higher than the previous month’s level of 2.85 million metric tons and 11.1 percent more than last year’s record of 2.77 million metric tons (Table 1).
- Relative to last month’s inventory levels, household stocks were higher by 17.8 percent, while commercial stocks grew by 35.4 percent. On the contrary, stock inventory in NFA depositories dropped by 5.6 percent.
- Against last year’s levels, stocks in the households dropped by 5.6 percent. However, stocks in the commercial sector were higher by 46.3 percent and those in NFA depositories, of which 72 percent were imported rice, were higher by 13.5 percent.
- The total volume of rice stocks as of April 1, 2011 would be good for 91 days. Stocks in NFA depositories would be good for 43 days and those in commercial warehouses for 18 days. Household stocks would last for 30 days.
- Of this month’s total rice stocks, 32.8 percent were with the households, 20.0 percent were with the commercial warehouses and 47.2 percent were with the NFA depositories.
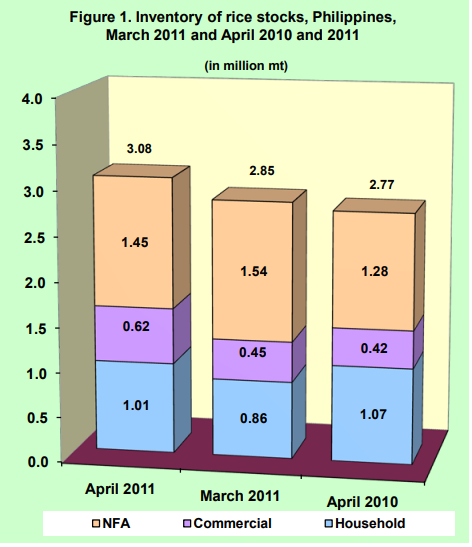
Table 1. Percentage change in the inventory of rice stocks,
Philippines, March 2011 and April 2010-2011
CORN STOCK
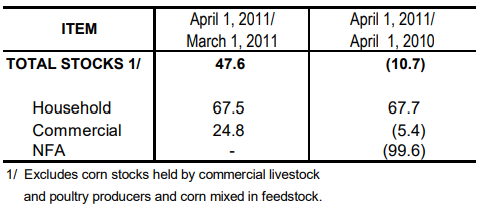
- The April 1, 2011 total corn stock inventory was 214.4 thousand metric tons (Figure 2). This was 47.6 percent higher than last month’s record of 145.3 thousand metric tons, but 10.7 percent lower than last year’s level of 240.0 thousand metric tons (Table 2).
- Compared with last month’s inventory report, household stocks increased by 67.5 percent. Similarly, commercial stocks were higher by 24.8 percent. Stocks in NFA depositories recorded no change from last month’s inventory.
- Compared to last year’s records, stocks in the households were higher by 67.7 percent. In contrast, stocks in commercial warehouses declined by 5.4 percent and in NFA depositories, by 99.6 percent.
- Around 60.7 percent of the total stocks were with the households, and 39.2 percent were with the commercial warehouses. NFA stocks accounted for 0.1 percent.
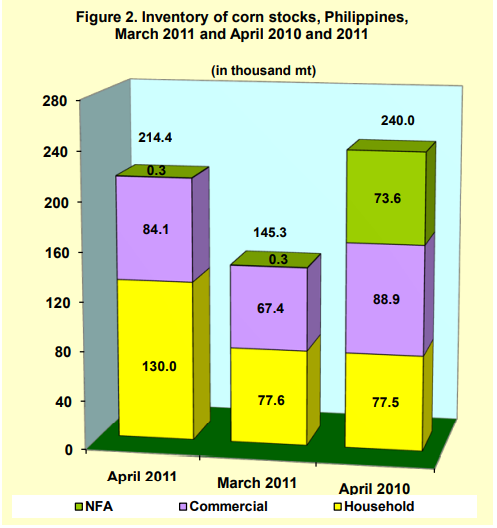
Table 2. Percentage change in the inventory of corn stocks,
Philippines, March 2011 and April 2010-2011
| Attachment | Size |
|---|---|
|
|
116.56 KB |