
A. Year-on-year Growth for December 2023
1. Value of Production Index (VaPI)
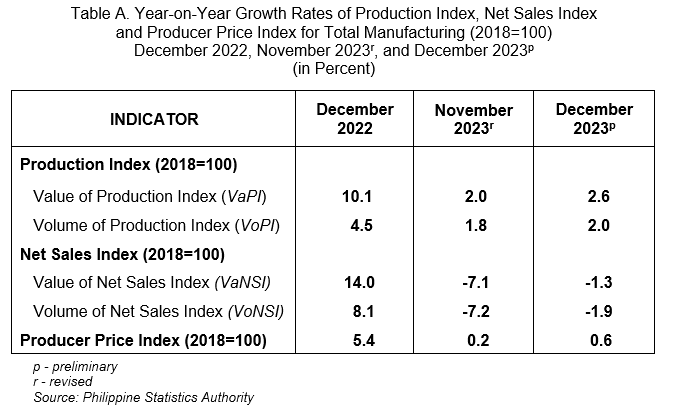
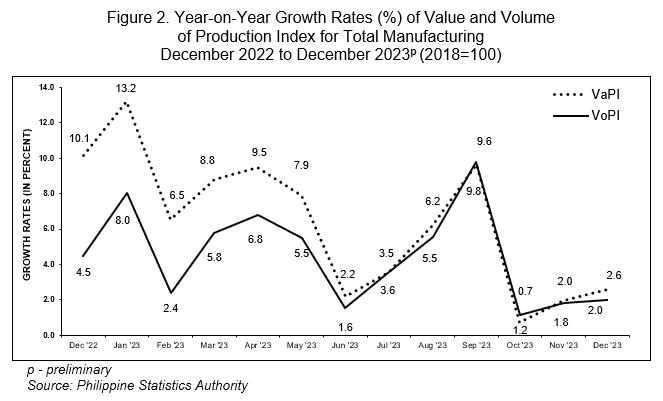
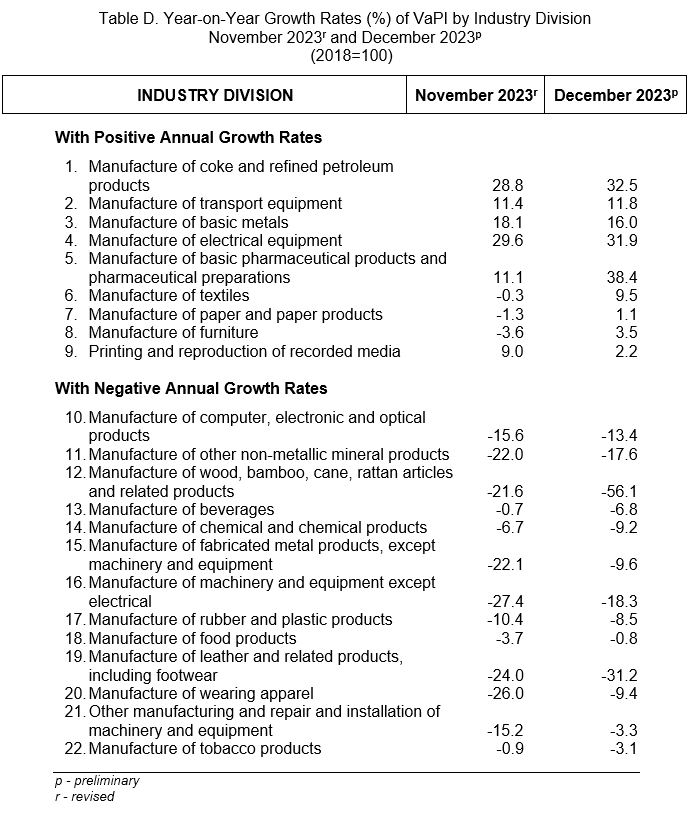
The VaPI for manufacturing continued to increase at an annual rate of 2.6 percent in December 2023. This was faster compared with its annual growth rate of 2.0 percent in the previous month. In December 2022, VaPI recorded a double-digit annual increase of 10.1 percent. (Figure 2, and Tables A and 1)
The expansion in the annual growth of the VaPI in December 2023 was mainly attributed by the slower annual decrease in the manufacture of food products at 0.8 percent in December 2023 from its annual drop of 3.7 percent in the previous month. The manufacture of food products contributed 25.9 percent to the annual uptrend of VaPI for the manufacturing section in December 2023. Out of the 22 industry divisions for the manufacturing section, manufacture of food products is the industry division with the highest weight in the computation of VaPI.
Other main contributors to the higher year-on-year growth of VaPI in December 2023 were the slower annual decreases in the manufacture of fabricated metal products, except machinery and equipment at 9.6 percent in December 2023 from a double-digit decline of 22.1 percent in the previous month, and manufacture of computer, electronic and optical products at 13.4 percent in December 2023 from 15.6 percent annual decrease in the previous month.
Of the remaining 19 industry divisions, nine exhibited annual upturns during the period. Meanwhile, 10 industry divisions posted annual reductions in December 2023. The manufacture of wood, bamboo, cane, rattan articles and related products registered the fastest annual drop of 56.1 percent during the period. (Tables C and 1)
The top three industry divisions contributing to the overall year-on-year growth of VaPI for manufacturing in December 2023 were the following:
a. Manufacture of coke and refined petroleum products;
b. Manufacture of transport equipment; and
c. Manufacture of basic metals.
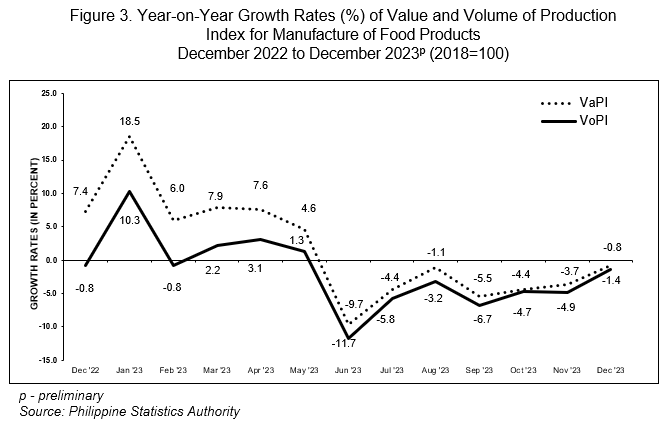
The VaPI for manufacture of food products registered an annual drop of 0.8 percent in December 2023. This was slower compared with its annual decline in November 2023 at 3.7 percent. In December 2022, VaPI for manufacture of food products recorded an annual increase of 7.4 percent. (Figure 3, and Tables 1 and 1a)
The slower year-on-year decline of VaPI for manufacture of food products in December 2023 was primarily brought about by the double-digit annual increase recorded in the manufacture of vegetable and animal oils and fats industry group at 10.1 percent in December 2023 from an annual decline of 19.8 percent in November 2023.
Other contributors to the slower year-on-year decrement of VaPI for manufacture of food products were the faster annual increase in the manufacture of prepared animal feeds at 29.0 percent from 11.1 percent in the previous month, and the slower decline in the manufacture of dairy products at 8.1 percent in December 2023 from 12.3 percent annual decrease in the previous month. (Table 1a)
2. Volume of Production Index (VoPI)
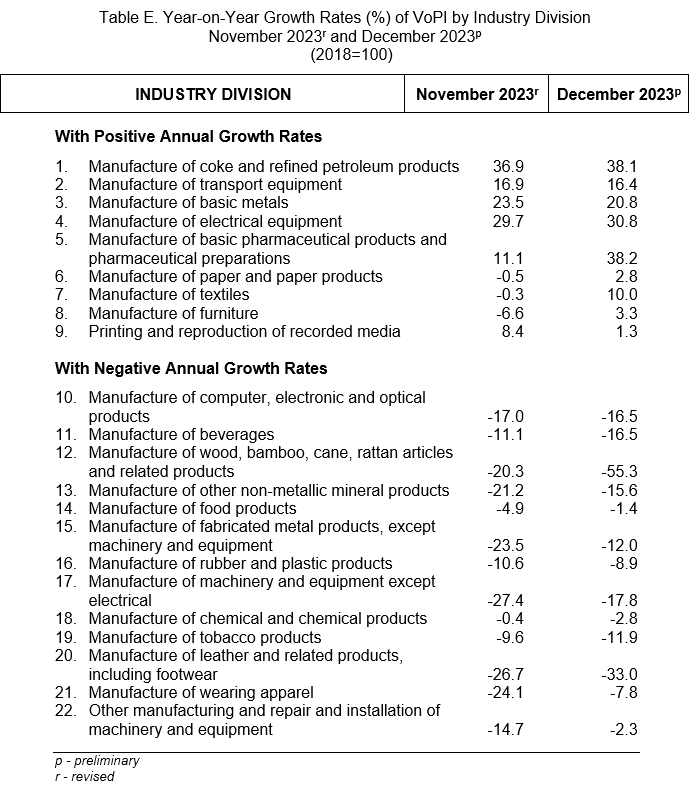
The VoPI for manufacturing registered a year-on-year increment of 2.0 percent in December 2023, which was faster than the annual growth rate of 1.8 percent in the previous month. In December 2022, VoPI recorded an annual increase of 4.5 percent. (Figure 2, and Tables A and 2)
The expansion in the annual growth of the VoPI in December 2023 was mainly brought about by the slower annual decline in the manufacture of food products at 1.4 percent in December 2023 compared with its annual drop of 4.9 percent in the previous month. The manufacture of food products contributed 34.5 percent to the uptrend of VoPI for the manufacturing section in December 2023.
Other main contributors to the higher year-on-year growth of VoPI in December 2023 were the faster annual increase observed in the manufacture of basic pharmaceutical products and pharmaceutical preparations at 38.2 percent in December 2023 from 11.1 percent in the previous month, and the slower annual decrement in the manufacture of fabricated metal products, except machinery and equipment at 12.0 percent during the period from 23.5 percent annual decrease in the previous month.
Of the remaining 19 industry divisions, eight registered year-on-year increases in December 2023. In contrast, 11 industry divisions posted annual declines during the period. The highest annual drop was observed in manufacture of wood, bamboo, cane, rattan articles and related products at 55.3 percent. (Tables D and 2)
The top three industry divisions contributing to the overall year-on-year growth of VoPI for manufacturing in December 2023 were the following:
a. Manufacture of coke and refined petroleum products;
b. Manufacture of transport equipment; and
c. Manufacture of basic metals.
The VoPI for manufacture of food products registered an annual drop of 1.4 percent in December 2023. This was slower compared with its annual decline of 4.9 percent in November 2023. In December 2022, VoPI for manufacture of food products recorded an annual decrease of 0.8 percent. (Figure 3, and Tables 2 and 2a)
The slower annual decrease of VoPI for manufacture of food products in December 2023 was primarily driven by the same top three industry groups that contributed to the slower annual decline of VaPI for manufacture of food products during the period. These were the following:
a. Manufacture of vegetable and animal oils and fats, 19.8 percent annual increase from 13.2 percent annual decrement in the previous month;
b. Manufacture of prepared animal feeds, 26.4 percent annual increment from 12.0 percent annual increase in November 2023; and
c. Manufacture of dairy products, 9.0 percent annual decline from 14.9 percent annual drop in the previous month. (Table 2a)
3. Value of Net Sales Index (VaNSI)
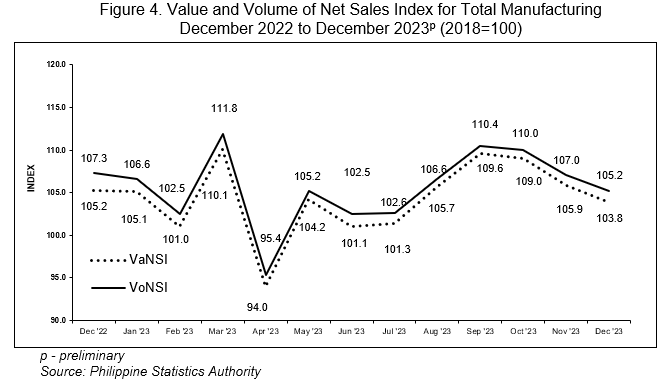
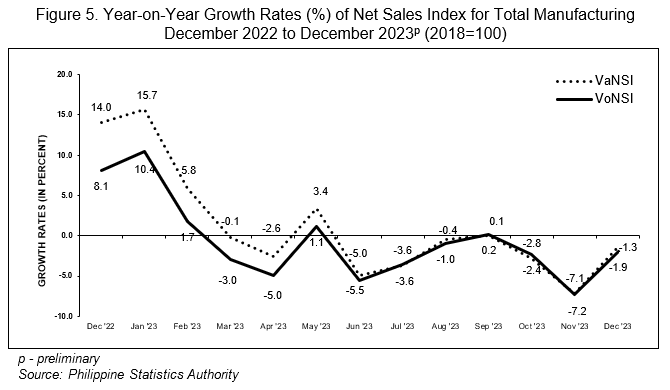
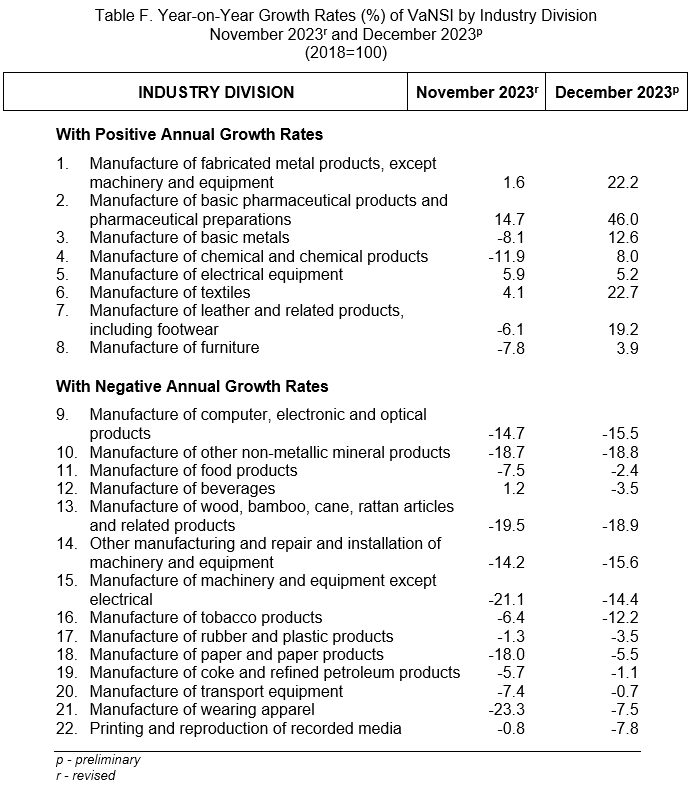
The VaNSI for manufacturing recorded a slower annual decrease of 1.3 percent in December 2023 compared with its annual drop of 7.1 percent in the previous month. In December 2022, VaNSI recorded a double-digit annual increase of 14.0 percent. (Figure 5, and Tables A and 3).
The slower year-on-year decline of VaNSI during the month was primarily brought about by the slower annual decrease in the manufacture of food products industry division at 2.4 percent in December 2023 from 7.5 percent annual drop in November 2023. The manufacture of food products contributed 22.5 percent to the trend of VaNSI for the manufacturing section in December 2023.
Other primary contributors to the slower annual decline of VaNSI in December 2023 were the annual increases in the manufacture of chemical and chemical products at 8.0 percent in December 2023 from an annual drop of 11.9 percent in the previous month, and manufacture of basic metals at 12.6 percent annual increment in December 2023 from 8.1 percent annual decrease in the previous month.
Furthermore, six out of the 19 remaining industry divisions exhibited annual increases during the period, while the other 13 industry divisions posted annual decreases. The highest year-on-year decrement was noted in the manufacture of wood, bamboo, cane, rattan articles and related products at 18.9 percent during the period. (Tables E and 3)
The top three industry divisions contributing to the overall year-on-year growth of VaNSI for manufacturing in December 2023 were the following:
a. Manufacture of computer, electronic and optical products;
b. Manufacture of other non-metallic mineral products; and
c. Manufacture of food products.
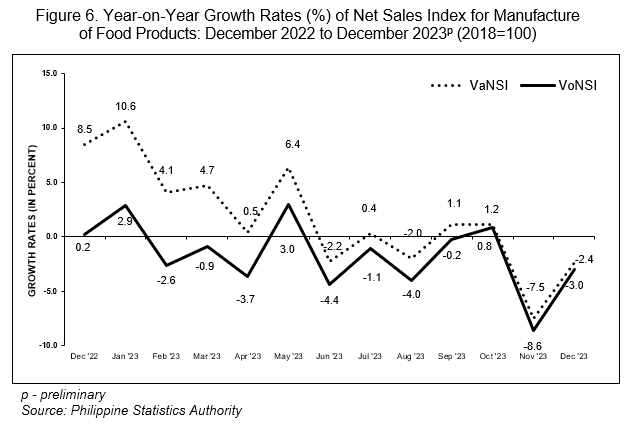
The VaNSI for manufacture of food products registered an annual decline of 2.4 percent in December 2023. This was slower compared with its annual decline of 7.5 percent in November 2023. However, VaNSI for manufacture of food products recorded an annual increase of 8.5 percent in December 2022. (Figure 6, and Tables 3 and 3a)
The slower year-on-year decline of VaNSI for manufacture of food products in December 2023 was primarily driven by the slower annual decline in the manufacture of other food products industry group at 10.7 percent in December 2023 from an annual decrement of 25.4 percent in the previous month. The manufacture of other food products industry group includes bakery products, sugar, and condiments, among others.
Other primary contributors to the slower year-on-year downturn of VaNSI for manufacture of food products were the slowdown in the annual decrease in manufacture of vegetable and animal oils and fats at 9.7 percent during the month from a double-digit annual drop of 18.6 percent in the previous month, and the faster annual increase noted in processing and preserving of fish, crustaceans and mollusks at 18.7 percent in December 2023 from an annual increase of 7.7 percent in the previous month. (Table 3a)
4. Volume of Net Sales Index (VoNSI)
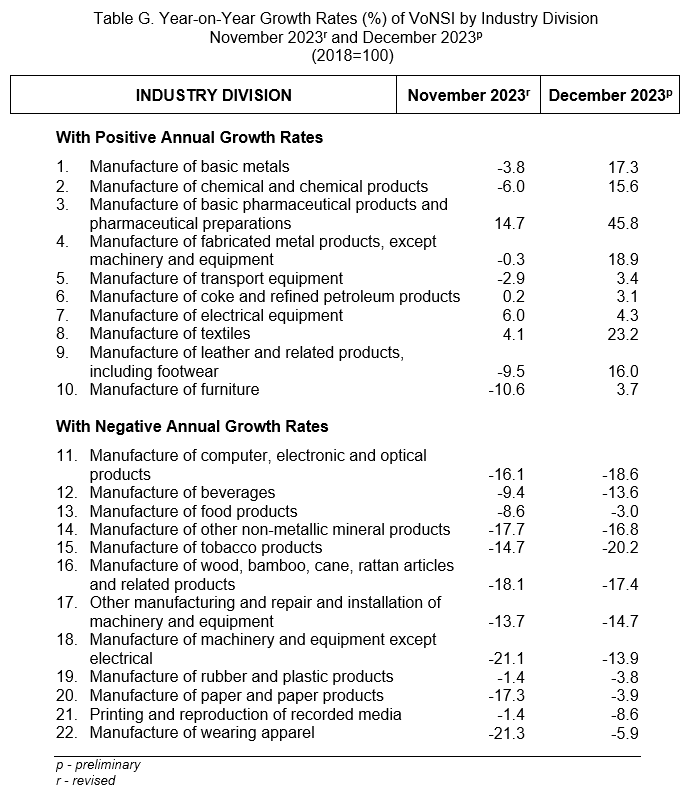
The VoNSI for manufacturing registered a slower year-on-year decrement in December 2023 at 1.9 percent relative to its annual decrease of 7.2 percent in November 2023. In December 2022, VoNSI recorded an annual increase of 8.1 percent. (Figure 5, and Tables A and 4)
The slower annual decrement of VoNSI in December 2023 was mainly brought about by the same top three industry divisions that contributed to the slower annual decrease of VaNSI during the period. These were the following:
a. Manufacture of food products, 3.0 percent annual decrease from 8.6 percent annual decrement in the previous month;
b. Manufacture of chemical and chemical products, 15.6 percent annual increase from 6.0 percent annual drop in the past month; and
c. Manufacture of basic metals, 17.3 percent annual increase from 3.8 percent annual drop in November 2023.
Furthermore, eight out of the 19 remaining industry divisions exhibited annual increases during the period. Meanwhile, 11 industry divisions posted annual decreases in December 2023. The highest year-on-year decrement was observed in the manufacture of tobacco products with an annual drop of 20.2 percent during the period. (Tables F and 4)
The top three industry divisions contributing to the overall year-on-year growth of VoNSI for manufacturing in December 2023 were the following:
Manufacture of computer, electronic and optical products;
b. Manufacture of beverages; and
c. Manufacture of food products.
The VoNSI for manufacture of food products registered an annual drop of 3.0 percent in December 2023. This was slower compared with its annual decline of 8.6 percent in November 2023. The VoNSI for manufacture of food products recorded an annual increase of 0.2 percent in December 2022. (Figure 6, and Tables 4 and 4a)
The slower year-on-year decline of the VoNSI for manufacture of food products in December 2023 was primarily driven by the slower annual decline in the manufacture of other food products industry group at 11.7 percent in December 2023 from 26.5 percent annual decrement in the previous month. The manufacture of other food products industry group includes bakery products, sugar, and condiments, among others.
Other primary contributors to the slower year-on-year decrement of VoNSI for manufacture of food products were the slower annual downturn noted in manufacture of vegetable and animal oils and fats at 1.7 percent in December 2023 from an annual drop of 11.9 percent in the previous month, and the faster annual increase observed in the manufacture of dairy products at 6.9 percent during the month from an annual increase of 4.3 percent in the previous month. (Table 4a)
B. Year-on-Year Growth for 2023
1. Value of Production Index
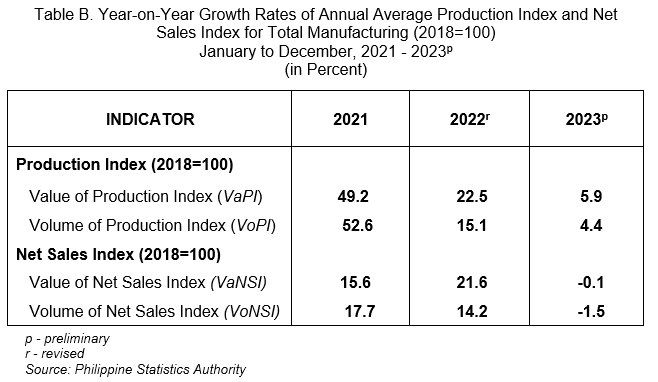
The annual average growth rate of VaPI for manufacturing in 2023 exhibited an expansion of 5.9 percent. However, this rate was slower than the annual average increments of 22.5 percent and 49.2 percent in 2022 and 2021, respectively. (Tables B and 1)
Also, a slower annual average growth rate in VaPI was observed for manufacture of food products at 1.2 percent in 2023, from 14.1 percent in 2022. (Tables 1 and 1a)
2. Volume of Production Index
In 2023, the annual average growth rate of VoPI for manufacturing was recorded at 4.4 percent, indicating a slowdown from the 15.1 percent and 52.6 percent annual average growth rates posted in 2022 and 2021, respectively. (Tables B and 2)
Meanwhile, the annual average rate in VoPI for manufacture of food products declined in 2023 by 1.8 percent from a 5.0 percent annual average increment in 2022. (Tables 2 and 2a)
3. Value of Net Sales Index
The annual decrement in the average growth rate of VaNSI for manufacturing in 2023 was recorded at 0.1 percent from the 21.6 percent and 15.6 percent annual average growth rates recorded in 2022 and 2021, respectively. (Tables B and 3)
Moreover, the annual average growth rate in VaNSI for manufacture of food products decelerated in 2023 at 1.1 percent from the annual average increase of 8.3 percent in 2022. (Tables 3 and 3a)
4. Volume of Net Sales Index
The annual average growth rate of VoNSI for manufacturing decreased in 2023 by 1.5 percent. In contrast, the annual average rates registered in 2021 and 2022 were double-digit increments of 17.7 percent and 14.2 percent, respectively. (Tables B and 4)
Meanwhile, the annual average rate in VoNSI for manufacture of food products dropped further by 1.9 percent in 2023 from the 0.4 percent annual average decrement in 2022. (Tables 4 and 4a)
C. Average Capacity Utilization Rate
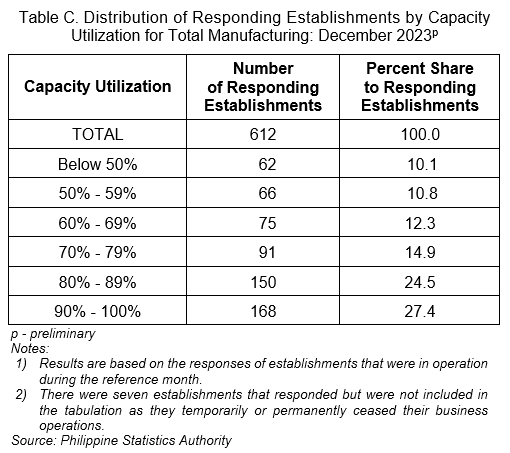
Based on responding establishments, the average capacity utilization rate for the manufacturing section in December 2023 was reported at 74.3 percent from 74.8 percent in the previous month.
All industry divisions reported capacity utilization rates of more than 60.0 percent during the month. The top three industry divisions in terms of reported capacity utilization rate were manufacture of rubber and plastic products (80.0%), manufacture of machinery and equipment except electrical (79.8%), and manufacture of beverages (79.6%). (Table 6)
The proportion of establishments that operated at full capacity (90% to 100%) was 27.4 percent of the total number of responding establishments. Meanwhile, 39.4 percent operated at 70 to 89 percent capacity, and 33.2 percent operated below 70 percent capacity. (Table B)
CLAIRE DENNIS S. MAPA, PhD
Undersecretary
National Statistician and Civil Registrar General
See more at the Monthly Integrated Survey of Selected Industries (MISSI) landing page.