
|
Table A Year-on-Year Growth Rates for Production Index, Net Sales Index
and Producer Price Index: May 2016 and May 2015
|
||
|---|---|---|
|
TOTAL MANUFACTURING |
MAY
2016
|
MAY
2015
|
|
Production Index (2000=100) |
|
|
|
Value (VaPI) |
-4.9 |
-8.0 |
|
Volume (VoPI) |
-1.2 |
-1.1 |
|
Net Sales Index (2000=100) |
|
|
|
Value (VaNSI) |
3.9 |
-9.8 |
|
Volume (VoNSI) |
7.8 |
-3.0 |
|
Producer Price Index (2000=100) |
-3.7r |
-7.0 |
r - revised
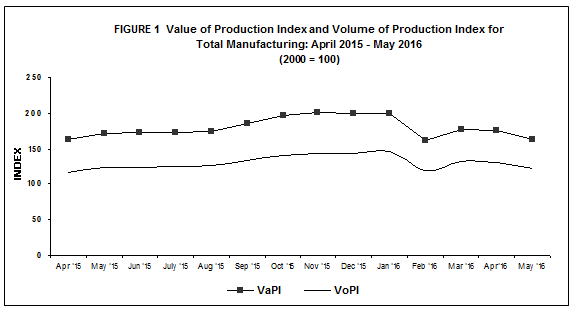
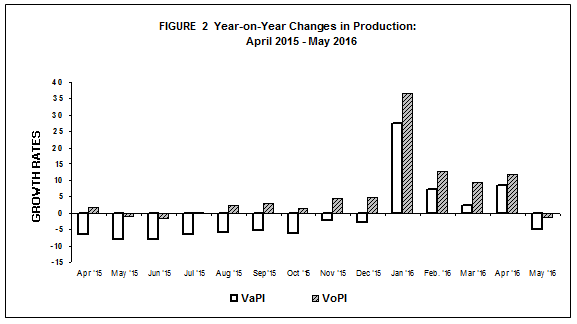
- Value of Production Index decelerates at a slower pace in May 2016
Value of Production Index (VaPI) for total manufacturing reflected a decrease of 4.9 percent in May 2016, showing an improvement from the same month last year’s decline of 8.0 percent, according to the preliminary results of the Monthly Integrated Survey of Selected Industries (MISSI). Seven of the nine major sectors significantly contributed to the decline led by leather products, registering a two-digit decrease of 83.3 percent. Other major sectors with two-digit decreases were also observed in the following: chemical products (-48.8%), petroleum products (-36.8%), fabricated metal products (-23.7%), textiles (-18.2%), furniture and fixtures (-17.4%), and footwear and wearing apparel (-10.0%). Refer to Tables 1-A and 1.
.
- Volume of Production also contracts
Volume of Production Index (VoPI) likewise posted a year-on-year drop of 1.2 percent in May 2016. Five major sectors that largely contributed to the reduction in VoPI were leather products (-83.2%), chemical products (-48.8%), petroleum products (-31.3%), fabricated metal products (-24.5%) and textiles (-19.1%). Refer to Tables 1-B and 2.
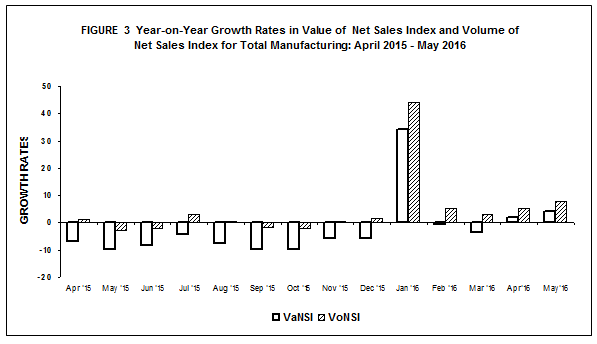
- Value of Net Sales Index recovers in May 2016
Value of Net Sales Index (VaNSI) climbed to 3.9 percent in May 2016 compared with 9.8 percent drop during the same month last year. This was brought about by the increments in 13 major sectors led by wood and wood products (64.5%). Other major sectors with two-digit growth in VaNSI were leather products (28.8%), basic metals (25.8%), miscellaneous manufactures (19.5%), transport equipment (16.7%), and beverages (13.9%). Refer to Tables 2-A and 3.
- Volume of Net Sales Index likewise picks up
Volume of Net Sales Index (VoNSI) accelerated as it posted an annual growth of 7.8 percent in May 2016. Fourteen major sectors showed significant increases in VoNSI as follows: wood and wood products (66.0%), basic metals (43.7%), machinery except electrical (29.7%), leather products (29.7%), transport equipment (16.7%), rubber and plastic products (13.5%), and miscellaneous manufactures (12.7%). Refer to Tables 2-B and 4.
- Average Capacity Utilization Rate in May 2016 is 83.3 percent with basic metals posting the highest among industries
Average capacity utilization rate in May 2016 for total manufacturing was recorded at 83.3 percent. Fifty-five percent or 11 of the 20 major industries operated at 80 percent and above capacity utilization rates. These were:
- basic metals (88.7%)
- petroleum products (88.1%)
- non-metallic mineral products (86.7%)
- machinery except electrical (85.2%)
- food manufacturing (84.6%)
- electrical machinery (84.2%)
- chemical products (83.3%)
- paper and paper products (83.3%)
- rubber and plastic products (82.8%)
- wood and wood products (80.8%)
- printing (80.3%)
The proportion of establishments that operated at full capacity (90% to 100%) was 24.1 percent in May 2016. About 57.8 percent of the establishments operated at 70 percent to 89 percent capacity while 18.1 percent of the establishments operated below 70 percent capacity. Refer to Table B and 6.
|
Table B Distribution of Key Manufacturing Establishments by Capacity Utilization for Total Manufacturing: May 2016 |
|
|---|---|
|
Capacity Utilization |
Percent Share |
|
Below 50% |
3.2 |
|
50% - 59% |
5.1 |
|
60% - 69% |
9.8 |
|
70% - 79% |
23.2 |
|
80% - 89% |
34.6 |
|
90% - 100% |
24.1 |
- Industry Coverage
The 2016 MISSI utilizes the 2009 PSIC to classify major industries and sub-industries. Twenty major industries of the 2009 PSIC were formed to comprise the industry coverage of the 2016 MISSI. These are presented in the table below.
|
2009 PSIC CODE |
INDUSTRY DESCRIPTION |
|---|---|
|
C10 |
Food manufacturing * |
|
C11 |
Beverages |
|
C12 |
Tobacco products |
|
C13 |
Textiles* |
|
C14, C152 |
Footwear and wearing apparel |
|
C151 |
Leather products |
|
C16 |
Wood and wood products* |
|
C17 |
Paper and paper products |
|
C18 |
Printing |
|
C19 |
Petroleum products* |
|
C20,C21 |
Chemical products* |
|
C22 |
Rubber and plastic products* |
|
C23 |
Non-metallic mineral products* |
|
C24 |
Basic metals* |
|
C25,C3311 |
Fabricated metal products |
|
C262,C275,C28, C263,C268,C3312,C332 |
Machinery except electrical* |
|
C261,C264,C27, C29301,C3314,C332 |
Electrical machinery* |
|
C29 except C29301, C30,C3315 |
Transport equipment |
|
C31 |
Furniture and fixtures |
|
C265,C266,C267,C32, C3313,C3319 |
Miscellaneous manufactures |
|
Note: * - Major industries categorized into sub-industries |
|
- Response Rate
The response rates for the May 2016 MISSI and PPS are 78.5 and 81.4 percent, respectively. Refer to Tables 7 and 8.
|
Table C Response Rates for Total Manufacturing
(In percent)
|
||
|---|---|---|
|
|
May 2016 |
April 2016
(Revised)
|
|
MISSI |
78.5 |
88.8r |
|
PPS |
81.4r |
89.8r |
Data of non-responding samples were estimated using short-term geometric mean of the relative values of responding samples within the industry class. Revisions to the preliminary estimates are done upon receipt of actual reports of late respondents.
TABLE 1-A Value of Production Index, April 2016 and May 2016
(2000 =100)
|
Gainers |
Year-on-Year Growth (%) |
|
|---|---|---|
| May 2016 |
April 2016
(revised)
|
|
|
Food manufacturing |
22.5 |
30.0 |
|
Machinery except electrical |
17.0 |
18.4 |
|
Basic metals |
27.0 |
7.7 |
|
Transport equipment |
20.2 |
23.7 |
|
Rubber and plastic products |
23.9 |
26.4 |
|
Beverages |
7.8 |
15.4 |
|
Miscellaneous manufactures |
10.5 |
55.5 |
|
Tobacco products |
5.1 |
2.9 |
|
Printing |
4.7 |
35.1 |
|
Wood and wood products |
8.8 |
0.4 |
|
Paper and paper products |
0.4 |
10.4 |
|
Losers |
Year-on-Year Growth (%) |
|
|---|---|---|
| May 2016 |
April 2016
(revised)
|
|
|
Petroleum products |
-36.8 |
-41.9 |
|
Chemical products |
-48.8 |
4.7 |
|
Electrical machinery |
-5.3 |
2.9 |
|
Fabricated metal products |
-23.7 |
-14.5 |
|
Textiles |
-18.2 |
-21.5 |
|
Footwear and wearing apparel |
-10.0 |
-15.4 |
|
Leather products |
-83.3 |
-82.2 |
|
Furniture and fixtures |
-17.4 |
-39.0 |
|
Non-metallic mineral products |
-3.1 |
2.1 |
TABLE 1-B Volume of Production Index, April 2016 and May 2016
(2000 = 100)
|
Gainers |
Year-on-Year Growth (%) |
|
|---|---|---|
| May 2016 |
April 2016
(revised)
|
|
|
Machinery except electrical |
43.4 |
43.6 |
|
Food manufacturing |
20.4 |
28.4 |
|
Basic metals |
45.1 |
19.7 |
|
Transport equipment |
20.3 |
23.3 |
|
Rubber and plastic products |
28.2 |
30.9 |
|
Beverages |
3.2 |
10.5 |
|
Tobacco products |
5.1 |
2.9 |
|
Miscellaneous manufactures |
4.2 |
46.1 |
|
Printing |
5.0 |
36.3 |
|
Wood and wood products |
9.8 |
5.7 |
|
Losers |
Year-on-Year Growth (%) |
|
|---|---|---|
| May 2016 |
April 2016
(revised)
|
|
|
Chemical products |
-48.8 |
5.6 |
|
Petroleum products |
-31.3 |
-38.2 |
|
Electrical machinery |
-4.3 |
4.0 |
| Fabricated metal products |
-24.5 |
-15.5 |
|
Textiles |
-19.1 |
-22.6 |
|
Leather products |
-83.2 |
-82.2 |
|
Non-metallic mineral products |
-5.3 |
-1.3 |
|
Footwear and wearing apparel |
-3.6 |
-9.5 |
|
Furniture and fixtures |
-5.3 |
-33.3 |
|
Paper and paper products |
-0.2 |
9.4 |
TABLE 2-A Value of Net Sales Index, April 2016 and May 2016
(2000 =100)
|
Gainers |
Year-on-Year Growth (%) |
|
|---|---|---|
| May 2016 |
April 2016
(revised)
|
|
|
Food manufacturing |
8.8 |
2.3 |
|
Basic metals |
25.8 |
23.2 |
|
Transport equipment |
16.7 |
-14.2 |
|
Electrical machinery |
4.4 |
-2.3 |
|
Beverages |
13.9 |
9.4 |
|
Machinery except electrical |
5.8 |
0.7 |
|
Chemical products |
4.7 |
8.7 |
|
Miscellaneous manufactures |
19.5 |
29.1 |
|
Wood and wood products |
64.5 |
32.3 |
|
Paper and paper products |
8.7 |
19.5 |
|
Rubber and plastic products |
9.7 |
13.4 |
|
Leather products |
28.8 |
-5.1 |
|
Tobacco products |
3.2 |
10.1 |
|
Losers |
Year-on-Year Growth (%) |
|
|---|---|---|
| May 2016 |
April 2016
(revised)
|
|
|
Petroleum products |
-16.9 |
-15.4 |
|
Footwear and wearing apparel |
-23.7 |
-16.4 |
|
Textiles |
-27.2 |
-11.0 |
|
Fabricated metal products |
-15.3 |
-9.4 |
|
Non-metallic mineral products |
-3.9 |
16.7 |
|
Furniture and fixtures |
-10.3 |
-7.5 |
|
Printing |
-1.6 |
15.6 |
TABLE 2-B Volume of Net Sales Index, April 2016 and May 2016
(2000 = 100)
|
Gainers |
Year-on-Year Growth (%) |
|
|---|---|---|
| May 2016 |
April 2016
(revised)
|
|
|
Machinery except electrical |
29.7 |
22.1 |
|
Basic metals |
43.7 |
36.8 |
|
Food manufacturing |
6.9 |
1.0 |
|
Electrical machinery |
5.6 |
-1.2 |
|
Transport equipment |
16.7 |
-14.5 |
|
Chemical products |
4.8 |
9.6 |
|
Beverages |
9.1 |
4.8 |
|
Wood and wood products |
66.0 |
39.2 |
|
Miscellaneous manufactures |
12.7 |
21.4 |
|
Rubber and plastic products |
13.5 |
17.5 |
|
Paper and paper products |
8.1 |
18.4 |
|
Leather products |
29.7 |
-4.7 |
|
Tobacco products |
3.2 |
10.1 |
|
Furniture and fixtures |
2.8 |
1.2 |
|
Losers |
Year-on-Year Growth (%) |
|
|---|---|---|
| May 2016 |
April 2016
(revised)
|
|
|
Petroleum products |
-9.7 |
-10.1 |
|
Footwear and wearing apparel |
-18.3 |
-10.5 |
|
Textiles |
-28.0 |
-12.2 |
|
Fabricated metal products |
-16.2 |
-10.5 |
|
Non-metallic mineral products |
-6.0 |
12.7 |
|
Printing |
-1.3 |
16.7 |