
|
Table A Year-on-Year Growth Rates for Production Index, Net Sales Index and Producer Price Index: August 2018 and August 2017 |
||
|---|---|---|
|
TOTAL MANUFACTURING |
AUGUST
2018
|
AUGUST
2017
|
|
Production Index (2000=100) |
|
|
|
Value (VaPI) |
8.8 |
-0.1 |
|
Volume (VoPI) |
8.8 |
0.3 |
|
Net Sales Index (2000=100) |
|
|
|
Value (VaNSI) |
13.0 |
-2.6 |
|
Volume (VoNSI) |
13.0 |
-2.2 |
|
Producer Price Index (2000=100) |
0.1r |
-0.4 |
r - revised
- Value of Production Index accelerates in August 2018
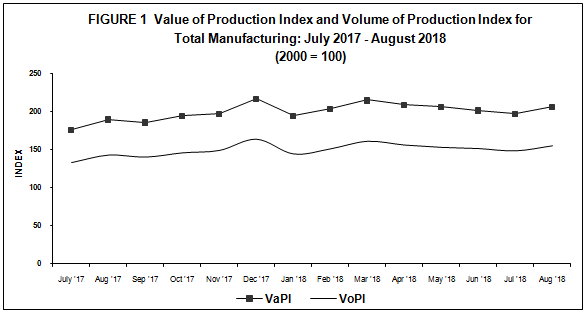
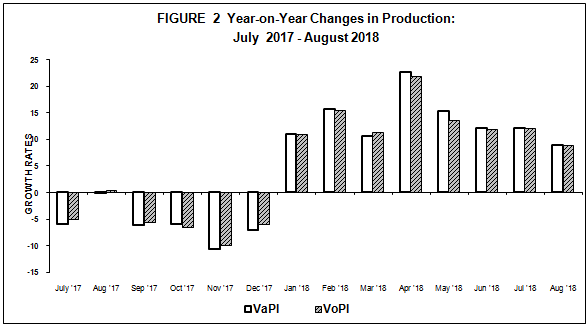
The Value of Production Index (VaPI) for manufacturing grew in August 2018, recording a year-on-year growth of 8.8 percent, based on the preliminary results of the Monthly Integrated Survey of Selected Industries (MISSI). In the same month of the previous year, VaPI went down by 0.1 percent.
A two-digit annual growth rate in VaPI was exhibited in eight major industry groups which was led by petroleum products with an increment of 60.9 percent. Other industries with two-digit annual growth rates were textiles (46.3%), beverages (41.2%), miscellaneous manufactures (31.2%), machinery except electrical (22.9%), paper and paper products (22.7%), electrical machinery (17.5%) and rubber and plastic products (10.5%). Refer to Tables1-A and 1.
- Volume of Production Index shows improvements
The Volume of Production Index (VoPI) rose by 8.8 percent in August 2018 from the 0.3 percent increase during the same month of the previous year.
Industries with a two-digit growth rate in VoPI were observed in the following: textiles (39.7%), petroleum products (37.9%), miscellaneous manufactures (26.6%), beverages (24.2%), paper and paper products (18.7%), machinery except electrical (14.7%), rubber and plastic products (11.9%), non-metallic mineral products (10.8%) and electrical machinery (10.4%). Refer to Tables 1-B and 2.
- Value of Net Sales Index sustains a two-digit growth
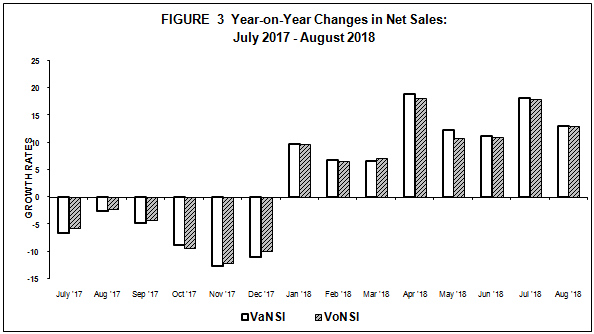
The Value of Net Sales Index (VaNSI) posted a two-digit growth, registering a 13.0 percent increase in August 2018 from a negative growth of 2.6 percent in the same month of 2017.
Thirteen of the 14 major industries that pulled-up the VaNSI were as follows: petroleum products (36.0%), paper and paper products (26.4%), tobacco products (25.1%), beverages (24.2%), miscellaneous manufactures (18.6%), food manufacturing (18.1%), basic metals (17.3%), fabricated metal products (16.0%), wood and wood products (14.6%), rubber and plastic products (14.2%), footwear and wearing apparel (13.2%), machinery except electrical (12.0%) and electrical machinery (11.3%). Refer toTables 2-A and 3.
- Volume of Net Sales Index posts increments
The Volume of Net Sales Index (VoNSI) likewise went up in August 2018, posting a year-on-year increment of 13.0 percent.
Among the 15 major industries exhibiting increases in VoNSI, nine major industries had a two-digit growth rate, namely: paper and paper products (25.4%), fabricated metal products (25.1%), food manufacturing (20.8%), furniture and fixtures (19.9%), rubber and plastic products (18.4%), wood and wood products (16.0%), petroleum products (15.5%), footwear and wearing apparel (14.3%), basic metals (10.5%). Refer to Tables 2-B and 4.
Average Capacity Utilization Rate in August 2018 is 84.3 percent with petroleum products posting the highest among industries
Average capacity utilization rate in August 2018 for total manufacturing was recorded at 84.3 percent. Fifty-five percent or 11 of the 20 major industries operated at least 80 percent capacity utilization rates. These are:
- petroleum products (89.8%)
- basic metals (89.0%)
- non-metallic mineral products (86.3%)
- machinery except electrical (86.1%)
- electrical machinery (85.1%)
- food manufacturing (85.1%)
- chemical products (84.9%)
- paper and paper products (83.8%)
- rubber and plastic products (83.5%)
- wood and wood products (81.6%)
- textiles (80.4%)
The proportion of establishments that operated at full capacity (90% to 100%) was more than one-fourth of the total number of establishments (26.8%) in August 2018. About 55.1 percent of the total establishments operated at 70 percent to 89 percent capacity while almost one-fifth of the total establishments (18.1%) operated below 70 percent capacity. Refer to Tables B and 6.
|
Table B Distribution of Key Manufacturing Establishments by Capacity Utilization for Total Manufacturing: August 2018 |
|
|---|---|
|
Capacity Utilization |
Percent Share |
|
Below 50% |
3.3 |
|
50% - 59% |
4.9 |
|
60% - 69% |
9.9 |
|
70% - 79% |
21.6 |
|
80% - 89% |
33.5 |
|
90% - 100% |
26.8 |
Response Rate
The response rates for the August 2018 MISSI and PPS were 79.6 percent and 87.4 percent, respectively. Refer to Tables 7 and 8.
|
Table C Response Rates for Total Manufacturing (In percent) |
||
|---|---|---|
|
|
August 2018 |
July 2018
(Revised)
|
|
MISSI |
79.6 |
88.3r |
|
PPS |
87.4r |
92.0r |
r - revised
Data of non-responding samples were estimated using short-term geometric mean of the relative values of responding samples within the industry class. Revisions of the preliminary estimates were done upon receipt of actual reports of late respondents.
LISA GRACE S. BERSALES, Ph. D.
Undersecretary
National Statistician and Civil Registrar General
TABLE 1-A Value of Production Index, July 2018 and August 2018
(2000 =100)
|
Industry Group |
Year-on-Year Growth (%) |
|
| August 2018 |
July 2018
(revised)
|
|
|
Gainers |
|
|
|
Petroleum products |
60.9 |
66.5 |
|
Electrical machinery |
17.5 |
13.4 |
|
Machinery except electrical |
22.9 |
12.3 |
|
Beverages |
41.2 |
38.5 |
|
Textiles |
46.3 |
40.6 |
|
Miscellaneous manufactures |
31.2 |
22.4 |
|
Food manufacturing |
2.6 |
3.1 |
|
Paper and paper products |
22.7 |
15.4 |
|
Basic Metals |
6.6 |
29.5 |
|
Rubber and plastic products |
10.5 |
10.4 |
|
Transport equipment |
3.5 |
-1.4 |
|
Wood and wood products |
7.4 |
-11.4 |
|
Losers |
|
|
|
Printing |
-66.9 |
-65.1 |
|
Tobacco products |
-35.1 |
-46.0 |
|
Chemical products |
-6.2 |
1.7 |
|
Fabricated metal products |
-18.0 |
5.8 |
|
Footwear and wearing apparel |
-5.8 |
-20.7 |
|
Non-metallic mineral products |
-1.9 |
3.2 |
|
Furniture and fixtures |
-4.3 |
-14.6 |
|
Leather products |
-3.0 |
6.9 |
TABLE 1-B Volume of Production Index, July 2018 and August 2018
(2000 = 100)
|
Industry Group |
Year-on-Year Growth (%) |
|
| August 2018 |
July 2018
(revised)
|
|
|
Gainers |
|
|
|
Petroleum products |
37.9 |
38.8 |
|
Electrical machinery |
10.4 |
6.9 |
|
Machinery except electrical |
14.7 |
4.8 |
|
Beverages |
24.2 |
22.0 |
|
Textiles |
39.7 |
34.0 |
|
Miscellaneous manufactures |
26.6 |
17.8 |
|
Food manufacturing |
2.7 |
3.7 |
|
Paper and paper products |
18.7 |
8.8 |
|
Rubber and plastic products |
11.9 |
12.2 |
|
Non-metallic mineral products |
10.8 |
16.7 |
|
Transport equipment |
2.3 |
-2.7 |
|
Furniture and fixtures |
8.0 |
-4.1 |
|
Wood and wood products |
9.3 |
-9.6 |
|
Leather products |
3.9 |
14.6 |
|
Basic metals |
0.1 |
19.6 |
|
Losers |
|
|
|
Tobacco products |
-57.6 |
-64.6 |
|
Printing |
-68.3 |
-66.6 |
|
Chemical products |
-4.9 |
2.4 |
|
Fabricated metal products |
-11.5 |
19.8 |
|
Footwear and wearing apparel |
-5.3 |
-18.4 |
(2000 =100)
|
Industry Group |
Year-on-Year Growth (%) |
|
| August 2018 |
July 2018
(revised)
|
|
|
Gainers |
|
|
|
Petroleum products |
36.0 |
33.6 |
|
Food manufacturing |
18.1 |
14.4 |
|
Electrical machinery |
11.3 |
22.2 |
|
Machinery except electrical |
12.0 |
19.8 |
|
Beverages |
24.2 |
27.4 |
|
Basic metals |
17.3 |
40.0 |
|
Paper and paper products |
26.4 |
16.9 |
|
Tobacco products |
25.1 |
46.6 |
|
Footwear and wearing apparel |
13.2 |
16.6 |
|
Miscellaneous manufactures |
18.6 |
30.2 |
|
Fabricated metal products |
16.0 |
9.9 |
|
Rubber and plastic products |
14.2 |
9.5 |
|
Wood and wood products |
14.6 |
-18.8 |
|
Furniture and fixtures |
9.9 |
9.9 |
|
Losers |
|
|
|
Textiles |
-20.7 |
-21.1 |
|
Chemical products |
-2.7 |
8.0 |
|
Printing |
-8.1 |
2.4 |
|
Non-metallic mineral products |
-2.6 |
17.5 |
|
Leather products |
-15.6 |
1.3 |
|
Transport equipment |
-0.1 |
-0.3 |
TABLE 2-B Volume of Net Sales Index, July 2018 and August 2018
(2000 = 100)
|
Industry Group |
Year-on-Year Growth (%) |
|
| August 2018 |
July 2018
(revised)
|
|
|
Gainers |
|
|
|
Food manufacturing |
20.8 |
17.5 |
|
Petroleum products |
15.5 |
10.4 |
|
Electrical machinery |
3.9 |
14.4 |
|
Paper and paper products |
25.4 |
13.0 |
|
Basic metals |
10.5 |
29.7 |
|
Footwear and wearing apparel |
14.3 |
20.5 |
|
Fabricated metal products |
25.1 |
24.4 |
|
Beverages |
7.5 |
10.5 |
|
Non-metallic mineral products |
8.9 |
31.4 |
|
Rubber and plastic products |
18.4 |
13.9 |
|
Machinery except electrical |
1.9 |
9.0 |
|
Miscellaneous manufactures |
8.7 |
19.1 |
|
Furniture and fixtures |
19.9 |
19.3 |
|
Wood and wood products |
16.0 |
-17.6 |
|
Transport equipment |
1.0 |
0.7 |
|
Losers |
|
|
|
Textiles |
-24.0 |
-24.5 |
|
Tobacco products |
-17.6 |
-3.3 |
|
Printing |
-11.8 |
-1.8 |
|
Leather products |
-9.1 |
9.0 |
|
Chemical products |
-0.1 |
10.1 |