
Quantity of domestic trade decreases
The total quantity of domestic trade during the second quarter of 2019 totaled to 5.86 million tons, down by 10.0 percent from the 6.51 million tons recorded in the second quarter of 2018 (Figure 1).
Food and live animals commodities led in terms of quantity, with 1.74 million tons or 29.7 percent share to total quantity of domestic trade. Animal and vegetable oils, fats and waxes commodities was the least with 0.03 million tons.
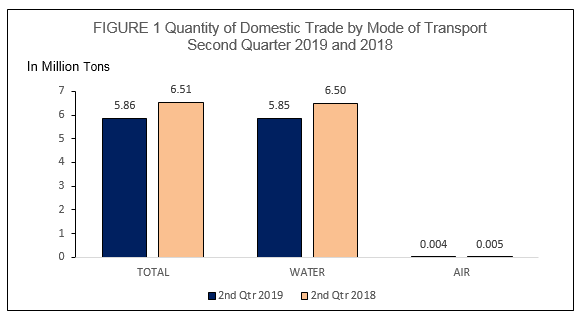
Almost all or 99.9 percent of the commodities were traded through water (coastwise) while the remaining commodities were through air.
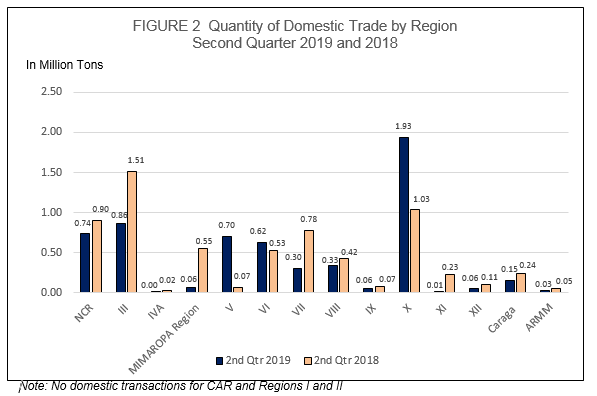
Among the regions, Northern Mindanao (X) still registered the highest quantity of traded commodities of 1.93 million tons during the second quarter of 2019. Central Luzon (III) and National Capital Region (NCR) followed with 0.86 million tons and 0.74 million tons, respectively (Figure 2).
Other regions’ quantity of traded commodities were the following:
• Bicol RegioN (V), 0.70 million tons;
• Western Visayas (VI), 0.62 million tons;
• Eastern Visayas (VIII), 0.33 million tons;
• Central Visayas (VII), 0.30 million tons;
• Caraga, 0.15 million tons;
• MIMAROPA Region, 0.06 million tons;
• SOCCSKSARGEN (XII), 0.06 million tons;
• Zamboanga Peninsula (IX), 0.06 million tons;
• ARMM, 0.03 million tons;
• Davao Region (XI), 0.009 million tons; and
• CALABARZON (IVA), 0.001 million tons.
Value of domestic trade likewise declines
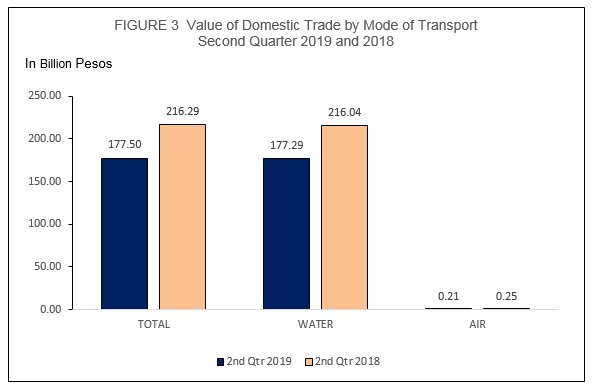
The total value of domestic trade amounting to PHP177.50 billion during the second quarter of 2019 went down by 17.9 percent from the PHP216.29 billion total value in the same quarter of 2018 (Figure 3).
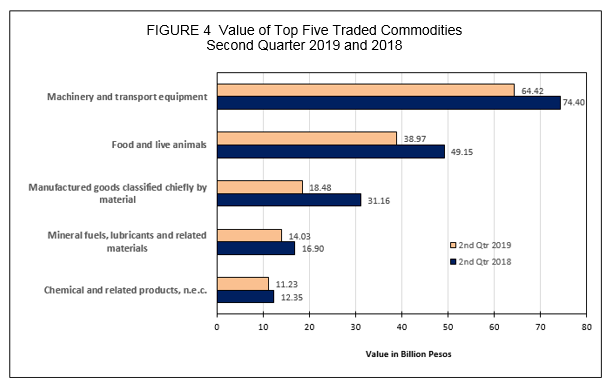
Machinery and transport equipment continued to lead with value amounting to PHP64.42 billion or 36.3 percent of the total value of domestic trade during the second quarter of 2019 (Figure 4). Food and live animals with a value of PHP38.97 billion and manufactured goods classified chiefly by material with PHP18.48 billion placed second and third, respectively. The value of other commodity sections were the following:
• Mineral fuels, lubricants and related materials, PHP14.03 billion;
• Commodities and transactions, not elsewhere classified in the PSCC, Rev. 2, PHP11.32 billion;
• Chemical and related products, n.e.c., PHP11.23 billion;
• Beverages and tobacco, PHP7.61 billion;
• Miscellaneous manufactured articles, PHP6.96 billion;
• Crude materials, inedible except fuels, PHP3.14 billion; and
• Animal and vegetable oils, fats and waxes, PHP1.36 billion.
Outflow value of domestic trade contracts
Outflow refers to the total value of commodities that goes out the specified region or province.
Among the regions, NCR registered the highest outflow value amounting to PHP44.47 billion or 25.1 percent of the total outflow. This was followed by Eastern Visayas (VIII) and Western Visayas (VI) with value amounting to PHP30.65 billion and PHP29.22 billion, respectively (Figure 5). Outflow values of other regions were as follows:
• Central Visayas (VII), PHP19.86 billion;
• Northern Mindanao (X), PHP18.20 billion;
• Bicol Region (V), PHP10.07 billion;
• Central Luzon (III), PHP8.34 billion;
• Caraga, PHP4.95 billion;
• MIMAROPA Region, PHP4.12 billion;
• Zamboanga Peninsula (IX), PHP3.68 billion;
• SOCCSKSARGEN (XII), PHP2.05 billion;
• ARMM, PHP1.31 billion;
• Davao Region (XI), PHP0.54 billion; and
• CALABARZON (IVA), PHP33.01 million.
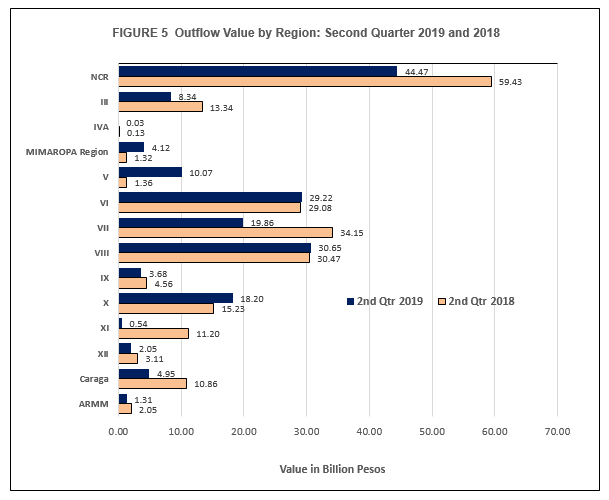
Note: No outflow value for CAR and Regions I and II
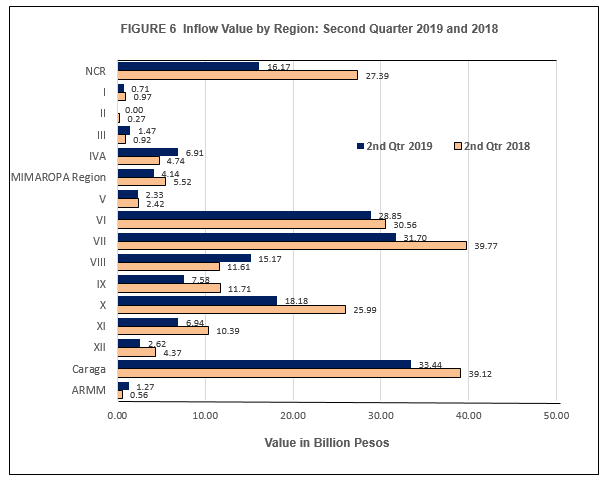
Inflow value of domestic trade drops
Inflow refers to the total value of commodities that comes in the specified region or province.
Among the regions, Caraga exhibited the highest inflow value amounting to PHP33.44 billion or 18.8 percent of the total inflow. Central Visayas (VII) and Western Visayas (VI) followed with PHP31.70 billion and PHP28.85 billion, respectively (Figure 6). Inflow values of other regions were the following:
• Northern Mindanao (X), PHP18.18 billion;
• NCR, PHP16.17 billion;
• Eastern Visayas (VIII), PHP15.17 billion;
• Zamboanga Peninsula (IX), PHP7.58 billion;
• Davao Region (XI), PHP6.94 billion;
• CALABARZON (IVA), PHP6.91 billion;
• MIMAROPA Region, PHP4.14 billion
• SOCCSKSARGEN (XII), PHP2.62 billion;
• Bicol Region (V), PHP2.33 billion;
• Central Luzon (III), PHP1.47 billion;
• ARMM, PHP1.27 billion;
• Ilocos Region (I), PHP0.71 billion; and
• Cagayan Valley (II), PHP0.70 million.
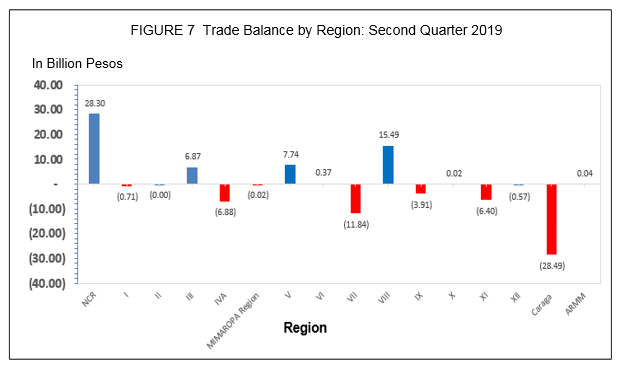
Trade Balance is the difference between the outflow and inflow that is, outflow value minus inflow value.
NCR remained to have the highest with trade balance of PHP28.30 billion, followed by Eastern Visayas (VIII) with trade balance amounting to PHP15.49 billion (Figure 7).
Other regions with favorable trade balances were the following:
• Bicol Region (V), PHP7.74 billion;
• Central Luzon (III), PHP6.87 billion;
• Western Visayas (VI), PHP0.37 billion;
• ARMM, PHP39.63 million; and
• Northern Mindanao (X), PHP21.30 million.
On the other hand, the nine regions with negative trade balances were the following:
• Caraga, PHP28.49 billion;
• Central Visayas (VII), PHP11.84 billion;
• CALABARZON (IVA), PHP6.88 billion;
• Davao Region (XI), PHP6.41 billion;
• Zamboanga Peninsula (IX), PHP3.91 billion;
• Ilocos Region (I), PHP0.71 billion;
• SOCCSKSARGEN (XII), PHP0.57 billion;
• MIMAROPA Region, PHP16.27 million; and
• Cagayan Valley (II), PHP0.70 million.
(Sgd.) ROSALINDA P. BAUTISTA
Assistant Secretary
Deputy National Statistician
Sectoral Statistics Office
EXPLANATORY NOTES
Introduction
Commodity flow or domestic trade statistics is a compilation of data on commodities carried through land, air, rail, and water transport systems in a given country. However in the Philippines, the Philippine Statistics Authority (PSA) compiles domestic trade carried through air and water only.
The PSA compiles domestic trade statistics from coasting manifests and coastwise passenger manifests from major ports and other active seaports listed by the Philippine Ports of Authority (PPA) all over the country. It also collects air waybills from Philippine Airlines (PAL) as source of domestic trade statistics from air.
Data on the inflow and outflow of commodities in the different regions of the country are used to construct inter-regional and inter-industry relation tables.
All copies of documents are compiled and processed by the Provincial Statistical Offices of PSA. Final data review of the data files, generation of statistical tables, and preparation of Special Releases are done at the Central Office, particularly in the Trade Statistics Division (TSD).
The 1993 Philippine Standard Commodity Classification (PSCC) Revision 2 is used to classify the commodities at the 5-digit level (item) for coastwise statistics and 3-digit level (group) for air statistics.
All documents received as of 15 September 2019 are processed and included in the generation of 2019 second quarter statistical tables. Documents received after the set deadline are included in the annual Special Release which is published 9 months after the reference year and in the publication (e-book) 12 months after the reference year.
Detailed data on domestic trade statistics are available at the TSD of Economic Sector Statistics Service (ESSS) with telephone number (02) 376-19-75.
Limitations of Domestic Trade Statistics
Domestic trade statistics contained in this report pertains to the flow of goods through airports and seaports in the country, whether for government or private use, or for commercial purposes. Domestic trade through land is excluded because of the absence of an approach to capture data in the archipelagic island of the country. Moreover, starting 2007, data on rail transport are also excluded.
Air waybills, on the other hand, are collected only from PAL which accounted for transactions that passes through all airports covered by PAL.
Goods and/or commodities that are excluded in the compilation of data are the following:
a. Goods transported by vessels of the Philippine Navy;
b. Fish and other marine products landed directly from the sea;
c. Service cargoes for consumption by vessel crew;
d. Cadaver; and
e. Vessels not carrying any cargo/passenger, wherein the vessel master indicates "NIL CARGO / PASSENGER" in the coasting manifest or passenger documents.