
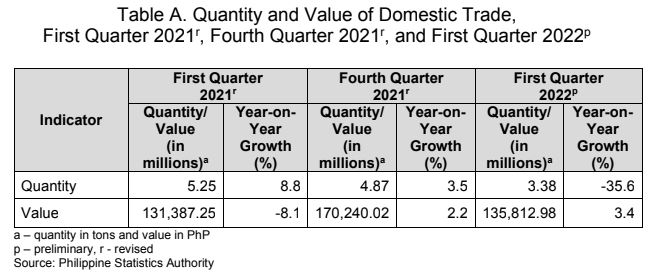
A. Quantity
1. Quantity of domestic trade decreased
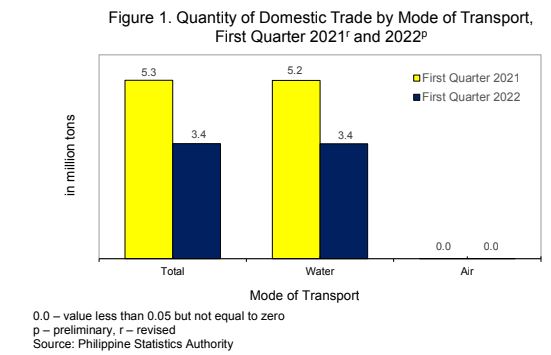
The total quantity of domestic trade in the first quarter of 2022 was registered at 3.38 million tons. This represents an annual decrease of -35.6 percent from the 5.25 million tons recorded in the same quarter of 2021. In the fourth quarter of 2021, the annual increment was 3.5 percent and in the first quarter of 2021, the annual increase was recorded at 8.8 percent. Almost all (99.9%) of the commodities were traded through water (coastwise), while the rest were traded through air. (Figure 1 and Table A)
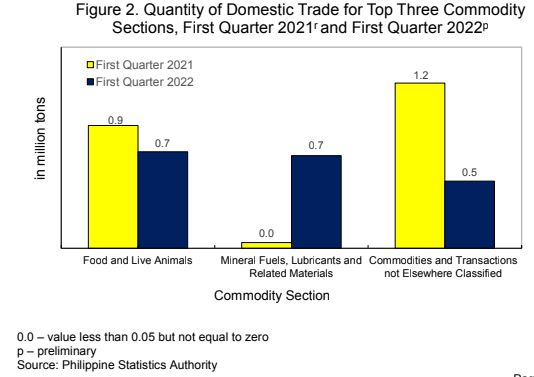
2. Food and live animals topped in terms of quantity of domestic trade
By commodity section, food and live animals led in terms of quantity of domestic trade in the first quarter of 2022 with 0.72 million tons or a share of 21.3 percent to the total domestic trade. This was followed by mineral fuels, lubricants and related materials with 0.69 million tons (20.4%) and commodities and transactions not elsewhere classified in the PSCC with 0.50 million tons (14.8%). (Figure 2 and Table 1)
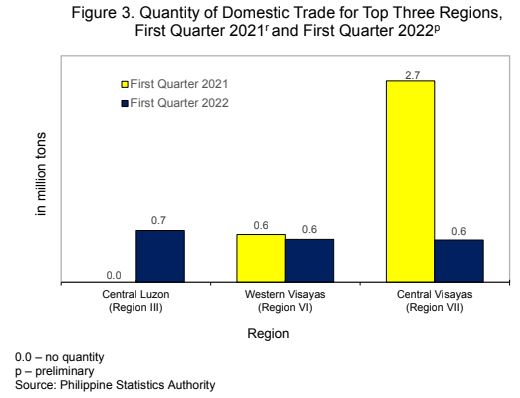
3. Central Luzon led in terms of quantity of traded commodities
By region, Central Luzon (Region III) recorded the highest quantity of traded commodities with 0.69 million tons or 20.3 percent share to the total in the first quarter of 2022. This was followed by Western Visayas (Region VI) with a quantity of 0.57 million tons (16.8%) and Central Visayas (Region VII) with 0.56 million tons (16.5%). (Figure 3 and Table 2)
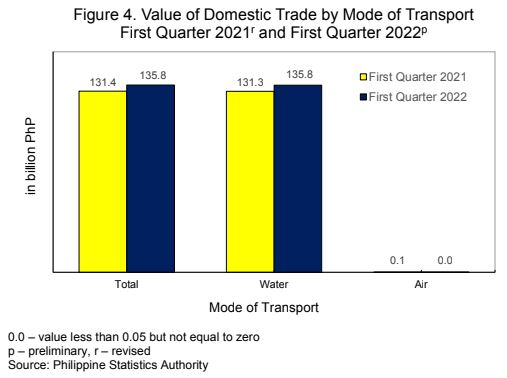
B. Value
1. Value of domestic trade grew
Domestic trade value refers to the outflow value of commodities that goes out from a specified region/province to another region/province.
The total value of domestic trade in the first quarter of 2022 amounted to PhP 135.81 billion. This indicates an increase of 3.4 percent from the PhP 131.39 billion value of domestic trade in the same period of 2021.
By mode of transport, the total value of traded commodities through water accounted for almost all (99.98%) of the total commodities that flowed within the country, while the remaining were through air. (Figure 4 and Table 1)
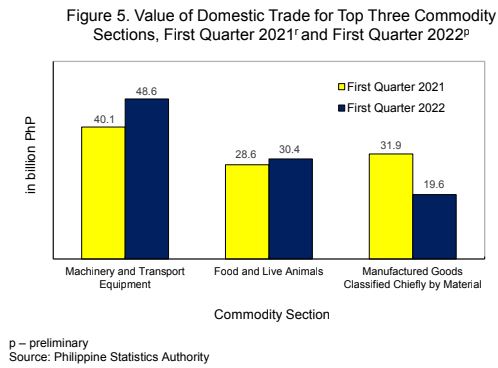
2. Machinery and transport equipment registered the highest value of traded commodities
Machinery and transport equipment topped in terms of value of traded commodities with PhP 48.62 billion or 35.8 percent share to the total value. This was followed by food and live animals valued at PhP 30.36 billion (22.4%) and manufactured goods classified chiefly by material which amounted to PhP 19.55 billion (14.4%). (Figure 5 and Table 1)
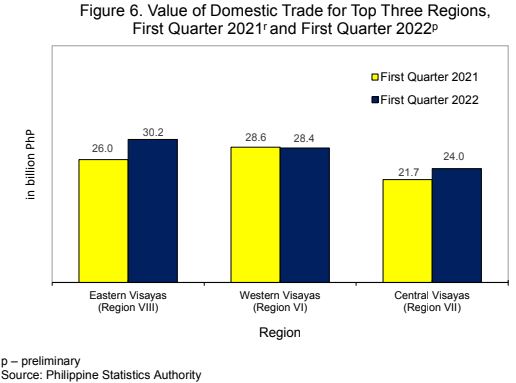
3. Eastern Visayas recorded the highest value of traded commodities
Among the regions, Eastern Visayas (Region VIII) ranked first with a total value of traded commodities of PhP 30.21 billion or 22.2 percent share to the total in the first quarter of 2022. Western Visayas (Region VI) came next with traded commodities amounting to PhP 28.39 billion (20.9%), followed by Central Visayas (Region VII) with PhP 24.04 billion (17.7%). (Figure 6 and Table 2)
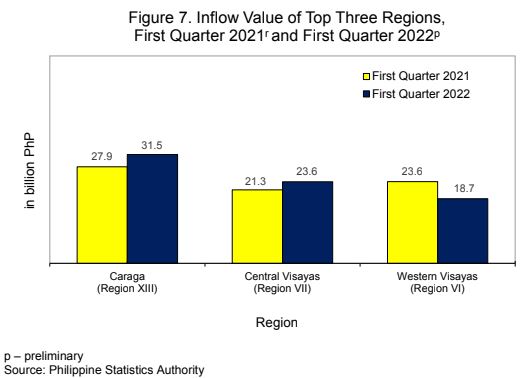
4. Caraga led in terms of inflow value
Inflow refers to the value of commodities that enters a specified region/province from other regions/provinces.
By region, Caraga (Region XIII) posted the highest inflow value of domestic trade of PhP 31.47 billion or 23.2 percent share to the total in the first quarter of 2022. This was followed by Central Visayas (Region VII) with inflow value of PhP 23.58 billion (17.4%) and Western Visayas (Region VI) with PhP 18.70 billion (13.8%). On the other hand, Cagayan Valley (Region II) had the lowest inflow value which amounted to PhP 7.00 million. (Figure 7 and Table 3)
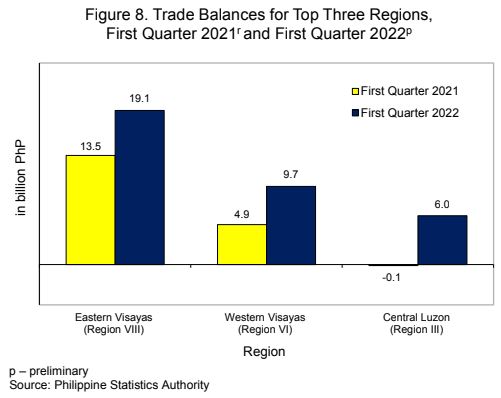
5. Eastern Visayas registered the highest trade balance
The trade balance is the difference between the outflow value and inflow value.
The top three regions with favorable (positive) domestic trade balances in the first quarter of 2022 were the following:
- Eastern Visayas (Region VIII), PhP 19.12 billion;
- Western Visayas (Region VI), PhP 9.70 billion; and
- Central Luzon (Region III), PhP 6.05 billion.
On the other hand, top three regions with unfavorable (negative) domestic trade balances in the first quarter of 2022 were the following:
- Caraga (Region XIII), PhP -27.00 billion;
- CALABARZON (Region IV-A), PhP -5.67 billion; and
- Zamboanga Peninsula (IX), PhP -4.54 billion. (Figure 8 and Table 3)
DENNIS S. MAPA, Ph.D.
Undersecretary
National Statistician and Civil Registrar General
EXPLANATORY NOTES
Overview
Commodity flow or domestic trade statistics is a compilation of data on commodities carried through air, rail, and water transport systems within a given country. However, in the Philippines, the Philippine Statistics Authority (PSA) compiles domestic trade carried through air and water only.
Data on the inflow and outflow of commodities in the different regions of the country are used to construct inter-regional and inter-industry relational tables. These serve as bases in the formulation and implementation of various regional development programs like countryside development and port planning.
The 1993 Philippine Standard Commodity Classification (PSCC), Revision 2 is used to classify the commodities at the 5-digit level (item) for coastwise statistics and 3-digit level (group) for air statistics.
Scope and Coverage
Domestic trade statistics contained in this report pertain to the flow of goods through airports and seaports in the country, whether for government or private use, or commercial purposes. It covers air trade and coastwise trade.
Goods and/or commodities that are excluded in the compilation of domestic data are the following:
- Goods transported by vessels of the Philippine Navy;
- Fish and other marine products unloaded in fishing ports;
- Fish and other marine products landed directly from the sea; and
- Logistic goods intended for the vessel and the crew.
Sources of Data
The source documents for the coastwise trade statistics are the coasting manifests and coastwise passenger manifests from major ports and other active seaports listed by the Philippine Ports Authority (PPA) all over the country. Air waybills, on the other hand, is the source document for air trade statistics issued by Philippine Airlines to every consignee.
Processing
All copies of documents are compiled and processed by the Provincial Statistical Offices (PSO) of PSA. The PSO submits monthly data files to the Central Office (CO) not later than one month after the reference month.
Final data review of the data files, generation of statistical tables, and preparation of Special Releases are done at the CO, particularly in the Trade Statistics Division (TSD) of the Economic Sector Statistics Service.
Dissemination and Revision
Quarterly Special Releases on domestic trade statistics are published two months after the reference quarter at the PSA website (www.psa.gov.ph) and at the OpenSTAT (openstat.psa.gov.ph).
All documents received after the cut-off date are included in the generation of the revised results. The revised data of the previous quarter are reported during the release of the preliminary report of the next quarter. Revisions are made for the previous quarters until the annual report is released four months after the reference year.
Data requests on domestic trade statistics are available at TSD with telephone number (02) 8376-19-75 and email address tsd.staff@psa.gov.ph.
| Attachment | Size |
|---|---|
|
|
491.73 KB |
|
|
56.87 KB |