
High Volume of Transactions Pulled Down Satisfaction Rating to 72 percent
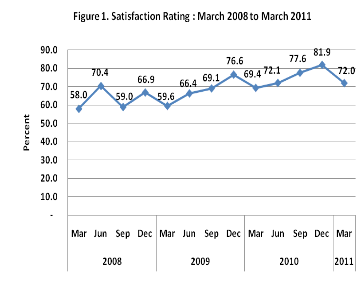 A huge increase in the volume of transactions processed for the month of March 2011 pulled down satisfaction rating to 72 percent. According to the results of the March 2011 survey round, the latest satisfaction rating is about 9.9 percentage points below the 81.9 percent rate recorded in December last year. Satisfaction ratings in June and September 2010 were registered at 72.1 percent and 77.6 percent, respectively. Satisfaction rating refers to the percentage of clients surveyed during the period who were either satisfied or very satisfied with NSO's civil registry services.
A total of 1,204,559 transactions were served nationwide in March 2011 and 35.8 percent of these or 431,657 transactions were processed and released in Metro Manila service areas covered by the survey. The areas covered by the survey include the NSO Civil Registration Service Areas in East Avenue, Quezon City (Application, Releasing, Endorsement, Party Waiting, and Travel Agency areas) and the five (5) other Metro Manila Outlets (Makati, Caloocan, Muntinlupa, Pasig, and Pasay Census Serbilis Centers).
Table 1. Net Satisfaction Rating and Volume of Transactions: March 2008 to March 2011
| CSS Survey Round | Net Satisfaction Rating | Total Volume (NCR) |
| Mar 2008 | +49.5 | 331,730 |
| Jun 2008 | +64.9 | 366,478 |
| Sep 2008 | +49.0 | 433,267 |
| Dec 2008 | +61.5 | 200,515 |
| Mar 2009 | +52.8 | 401,232 |
| Jun 2009 | +63.1 | 363,721 |
| Sep 2009 | +65.8 | 303,828 |
| Dec 2009 | +73.2 | 231,193 |
| Mar 2010 | +65.2 | 417,678 |
| Jun 2010 | +67.5 | 398,602 |
| Sep 2010 | +73.9 | 344,357 |
| Dec 2010 | +79.6 | 249,141 |
| Mar 2011 | +67.9 | 431,657 |
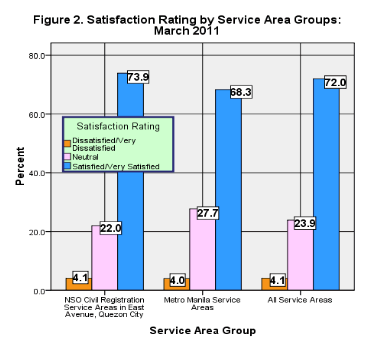
The NSO Civil Registration Service Areas in East Avenue, Quezon City performed relatively better as more of its clients (73.9%) were either satisfied or very satisfied with the civil registry services. The proportion of satisfied clients in other Metro Manila Outlets was estimated at only 68.3 percent.
QUEUEING TIME
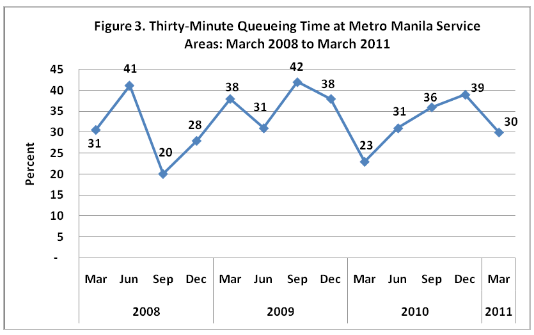
The number of clients who reported to have been served within 30 minutes was down by 9 percentage points to 30 percent in March 2011 from 39 percent in December 2011.

Only two (2) of the service areas covered by the survey experienced increases in the proportion of clients who reported to have been served within 30 minutes during the Survey, the other seven (7), Application, Releasing, Endorsement, Pasig Outlet, Makati Outlet, Caloocan Outlet and Pasay Census Serbilis Outlet suffered decreases from its previous month's proportion. The Muntinlupa Census Serbilis Outlet remained at its previous rate of 16 percent.
The highest increase was observed at the Travel Agency area (16 percentage points) while the three biggest decreases in the proportion of clients served within 30 minutes were observed in Makati Census Serbilis Outlet (39 percentage points), Caloocan Census Serbilis Outlet (29 percentage points) and Endorsement area (23 percentage points).
CLIENTS' PROFILE
Six in every ten (61.5 percent) respondents/clients were female; more than half or 53.3 percent were within the 20 to 34 age group; and with at least college education (56.8 percent). Majority of the respondents/clients reported to be unemployed (57.0 percent). About 28.4 percent resided in areas outside Metro Manila while the other 71.6 percent were Metro Manila residents.
Around 26 percent of the clients secured their civil registry documents for school requirements. Other reasons given were for: Passport (20.5 percent), Local Employment (16.4 percent), Embassy (11.8 percent) and GSIS/SSS (8.8 percent). About 70 percent of the NSO clients requested for the issuance of birth certificate while the other 17 percent of the clients reported to have availed the civil registry services of NSO to secure a copy issuance of marriage certificate.
Table 2. Distribution of NSO Clients by Demographic Profile : March 2011
| Demographic Profile | Percent |
| Sex | |
| Male | 38.5 |
| Female | 61.5 |
| Age Group | |
| 15 to 19 | 8.7 |
| 20 to 24 | 21.5 |
| 25 to 29 | 18.4 |
| 30 to 34 | 13.4 |
| 35 to 39 | 10.7 |
| 40 to 44 | 10.5 |
| 45 to 49 | 7.1 |
| 50 to 54 | 4.8 |
| 55 to 59 | 3.4 |
| 60 and over | 1.5 |
| Education | |
| Elementary | 3.4 |
| High School | 40.1 |
| College or higher | 56.8 |
| Work | |
| Employed | 43.0 |
| Unemployed | 57.0 |
| Residence | |
| NCR | 71.6 |
| Outside NCR | 28.4 |
Source: March 2011 CSS, NSO
Table 3. Distribution of clients' purpose for requesting civil registry documents: March 2011
| Purpose | Percent |
| Passport | 20.5 |
| Embassy | 11.8 |
| School | 26.1 |
| Local Employment | 16.4 |
| GSIS/SSS | 8.8 |
| BIR | 1.1 |
| Baptism | 1.9 |
| Exam/PRC | 2.2 |
| Marriage | 4.0 |
| Others | 7.3 |
Source: March 2011 CSS, NSO
Table 4. Distribution of Type of document requested: March 2011
| Purpose | Percent |
| Birth | 69.8 |
| Marriage | 17.1 |
| Death | 3.7 |
| CENOMAR | 7.1 |
| PreWar | 0.3 |
| Authentication | 2.0 |
Source: March 2011 CSS, NSO