
Non-residential building constructions industry leads the sector
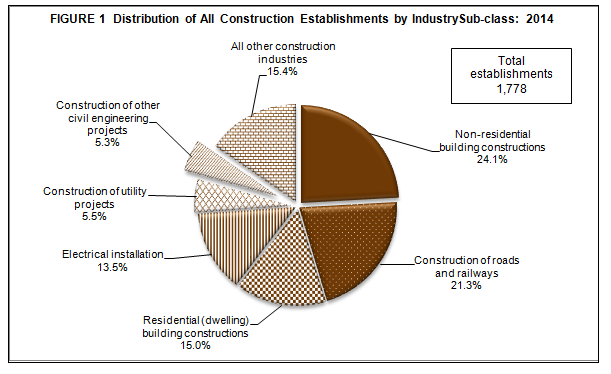
Based on the final results of the 2014 Annual Survey of Philippine Business and Industry (ASPBI) there were 1,778 establishments engaged in construction in the formal sector of the economy.
The number of establishments in the non-residential building constructions led the sector with 429 or 24.1 percent of the total. This was followed by construction of roads and railways with 378 establishments or 21.3 percent share to total.The share of other construction industries were as follows:
- residential (dwelling) building constructions, 267 establishments (15.0%)
- electrical installation, 240 establishments (13.5%)
- construction of utility projects, 97 establishments (5.5%)
- construction of other civil engineering projects, 94 establishments (5.3%)
- all other construction industries, 273 establishments (15.4%)
Figure 1 shows the distribution of all construction establishments by industry sub-class in 2014.
Non-residential building constructions industry employs the most number of workers
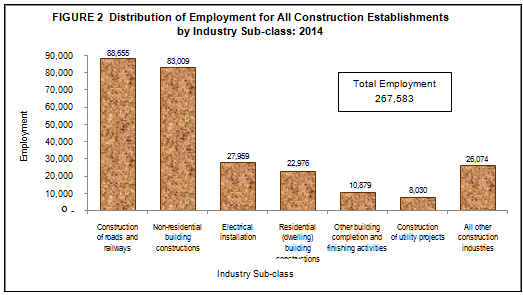
In 2014, construction establishments employed a total of 267,583 workers. Paid employees constitute, 267,212 or 99.9 percent and the remaining 1,371 or 0.1 percent were unpaid workers.
At the industry level, construction of roads and railways hired the majority of workers at 88,655 or 33.1 percent of the total. Non-residential building constructions followed with 83,009 workers or 31.0 percent. Electrical installation placed third with 27,959 workers or 10.4 percent share to total.
Figure 2 shows the distribution of employment for all construction establishments by industry sub-class in 2014.
The average number of workers per establishment for the sector was recorded at 150. Among industries, the average number of workers per establishment was above the national average for the following:
- construction of roads and railways, 235 workers per establishment
- floor and wall tiling or covering with other material, 210 workers per establishment
- other building completion and finishing activities, 209 workers per establishment
- non-residential building constructions, 193 workers per establishment
Site preparation industry pays the highest average compensation
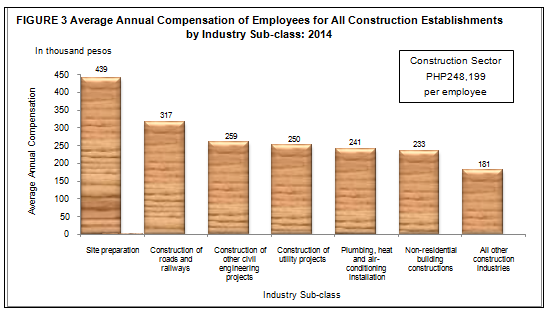
Total compensation paid in 2014 amounted to PHP66.3 billion, indicating an average annual compensation of PHP248,199 per employee.
Among industries, site preparation paid the highest average annual compensation of PHP439,381 per employee. Construction of roads and railways which paid an average annual compensation of PHP316,600 per employee followed next. The other industries that exceeded the national average annual compensation are:
- construction of other civil engineering projects, PHP259,416 per employee
- construction of utility projects, PHP249,726 per employee
Figure 3 shows the average annual compensation of employees for all construction establishments by industry sub-class in 2014.
Non-residential building constructions industry generates the highest value of output
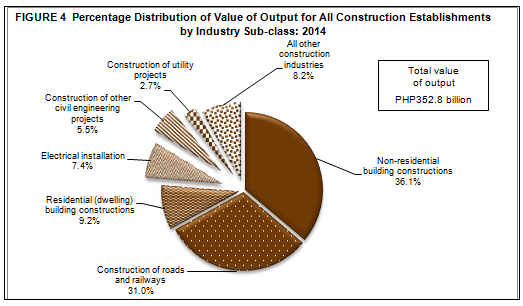
Total value of output generated by all construction establishments amounted to PHP352.8 billion.
The top three industries generated bulk of the total value of output in 2014 at PHP269.1 billion or 76.3 percent of the total. These are non-residential building constructions with output value of PHP127.5 billion or 36.1 percent of the total. Construction of roads and railways came in second followed by residential (dwelling) building constructions with respective output share of PHP109.3 billion (31.0%) and PHP32.4 billion (9.2%).
Figure 4 shows the distribution of value of output for all construction establishments by industry sub-class in 2014.
Non-residential building constructions industry spends the most
Total expense in incurred 2014 from business operations of all construction establishment amounted to PHP325.8 billion.
Among industries, non-residential building constructions incurred the highest expense amounting to PHP117.3 billion or 36.0 percent of the total, followed by construction of roads and railways with PHP101.2 billion or 31.1 percent. Residential (dwellings) building constructions came in third with a total expense of PHP30.9 billion (9.5%).
Carpentry industry records the highest returns
Income per expense ratio for the sector was recorded at 1.11, indicating that for every peso spent PHP1.11 was realized in terms of income.
Among industries, other construction installation recorded the highest income per expense ratio of 1.63. Other industries with income per expense ratio above the national figure are as follows:
- construction of other civil engineering projects, 1.14 income per peso expense
- plumbing, heat and air-conditioning installation, 1.12 income per peso expense
Non-residential building constructions highest industry contributor to value added
In 2014, value added generated by all construction establishments reached PHP130.1 billion.
The top three industries, in terms of value added, contributed PHP101.3 billion or 77.9 percent of the total. Construction of roads and railways generated the biggest share to total value added amounting to PHP48.7 billion or 37.4 percent of the total. This was followed by non-residential building constructions with PHP43.2 billion (33.2%). Electrical installation placed third with PHP9.4 billion (7.3%).
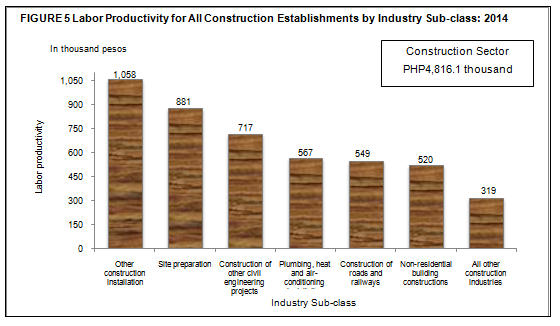
Residential (dwelling) building constructions industry most labor productive
Labor productivity, defined as value added per worker, was estimated at PHP486.1 thousand per worker for the construction sector.
The top six construction industries in terms of labor productivity and exceeding the national average are: construction installation with PHP1,057.8 thousand per worker; site preparation with PHP880.9 thousand per worker; construction of other civil engineering projects with PHP716.9 thousand per worker; construction of roads and railways with PHP549.1 thousand per worker and non-residential building constructions with PHP520.1 thousand per worker.
Figure 5 presents the labor productivity for all construction establishments by industry sub-class in 2014.
Construction of roads and railways industry contributes the most to gross addition to tangible fixed assets
Gross addition to tangible fixed assets, defined as capital expenditures less sale of fixed assets, was valued at PHP7.5 billion in 2014.
Construction of roads and railways with PHP3.4 billion accounted for almost half (45.3%) of the total gross addition to tangible fixed assets. This was followed by non-residential building constructions with PHP3.1 billion or 41.2 percent. Residential (dwelling) building constructions ranked third with PHP0.3 billion or 4.0 percent share to total.
Construction sector receives PHP1.5 billion worth of subsidies
Total subsidies provided by the government to support the business operations of all construction establishments amounted to PHP1.5 billion.
The highest recipient of subsidies received by the sector went to construction of roads and railways with PHP1.5 billion (99.7%). The rest of the subsidies was received by residential (dwelling) building constructions, PHP5.0 million (0.3%)
TECHNICAL NOTES
Introduction
This Special Release presents the final results of the 2014 ASPBI for the Construction (Sector F) for all employment sizes.
The 2014 ASPBI is one of the designated statistical activities of the Philippine Statistics Authority (PSA). Data collected from the survey provides information on the levels, structure, performance, and trends of economic activities of the formal sector in the entire country. The 2014 Survey of Tourism Establishments in the Philippines (STEP) was undertaken as a rider to this survey. The field operation of the 2014 ASPBI also integrated the data collection in updating the 2014 List of Establishments (ULE)
The survey was conducted nationwide in 2015 with the year 2014 as the reference period of data, except for employment data which is as of November 15, 2014.
Like the 2013 ASPBI operations, the data processing for this survey was decentralized to the Provincial Statistics Services Offices (PSSOs) as the provinces are near the establishments which are the data source of the survey
Data are presented at the national and industry sub-group or 3-digit 2009 Philippine Standard Industrial Classification (PSIC).
The conduct of the 2014 ASPBI is authorized under the following:
Republic Act 10625 known as the Philippine Statistical Act of 2013 – (Reorganizing and strengthening of the Philippine Statistical System (PSS), its agencies and instrumentalities). It shall be the policies of the State to effect the necessary and proper changes in the organizational and functional structures of the PSS in order to rationalize and promote efficiency and effectiveness in the delivery of statistical services.
Section 27 of Republic Act No. 10625 states that:
“… Respondents of primary data collection activities such as censuses and sample surveys are obliged to give truthful and complete answers to statistical inquiries. The gathering, consolidation and analysis of such data shall likewise be done in the most truthful and credible manner. Any violation of this Act shall result in the imposition of the penalty of one (1) year imprisonment and a fine of One hundred thousand pesos (P100,000.00). In cases where the respondent fails to give truthful and complete answers to such statistical inquiries is a corporation, the above penalty shall be imposed against the responsible officer, director, manager and/or agent of said corporation. In addition, such erring corporation, enterprise or business concerned, shall be imposed a fine ranging from One hundred pesos (P100,000.00) to Five hundred thousand pesos (P500,000.00)…”
Scope and Coverage
The 2014 ASPBI covered establishments engaged in 18 economic sectors classified under the 2009 PSIC, namely:
- Agriculture, Forestry and Fishing (A)
- Mining and Quarrying (B)
- Manufacturing (C)
- Electricity, Gas, Steam, and Air Conditioning Supply (D)
- Water Supply; Sewerage, Waste Management and Remediation Activities (E)
- Construction (F)
- Wholesale and Retail Trade; Repair and Maintenance of Motor Vehicles, Motorcycles (G)
- Transportation and Storage (H)
- Accommodation and Food Service Activities (I)
- Information and Communication (J)
- Financial and Insurance Activities (K)
- Real Estate Activities (L)
- Professional, Scientific and Technical Activities (M)
- Administrative and Support Service Activities (N)
- Education (P)
- Human Health and Social Activities (Q)
- Arts, Entertainment and Recreation (R)
- Other Service Activities (S)
However, three (3) sectors of the 2009 PSIC are not covered. These are:
- Public Administration and Defense; Compulsory Social Security (O)
- Activities of Household as Employee. Undifferentiated Goods and Services Producing Activities of Household for Own Use (T)
- Activities of Extraterritorial Organizational Bodies (U)
The survey was confined to the formal sector of the economy, which consists of the following:
- Corporations and partnership
- Cooperatives and foundations
- Single proprietorship with employment of 10 and over
- Single proprietorships with branches
Hence, the 2014 ASPBI covered only the following economic units:
- All establishments with total employment (TE) of 10 and over, and;
- All establishments with TE of less than 10, except those establishments with Legal Organization = 1 (single proprietorship) and Economic Organization = 1 (single establishment), that are engaged in economic activities classified according to the 2009 Philippine Standard Industrial Classification (PSIC).
Frame of Establishments
The frame for the 2014 ASPBI was extracted from the 2014 List of Establishments (LE). The estimated number of establishments in operation in the country in 2014 totaled to 941,000. About 263,000 establishments (28.0% of the total establishments) belong to the formal sector of which 229,000 (87.0%) comprised the establishment frame. This frame was used to draw the sample establishments for the survey.
Unit of Enumeration
The unit of enumeration for the 2014 ASPBI is the establishment. An establishment is defined as an economic unit under a single ownership or control which engages in one or predominantly one kind of activity at a single fixed location.
Classification of Establishments
An establishmentis categorized by its economic organization, legal organization, industrial classification, employment size, and geographic location.
Economic Organization refers to the organizational structure or role of the establishment in the organization. An establishment may be single establishment, branch, establishment and main office with branches elsewhere, main office only, and ancillary unit other than main office.
Legal Organization refers to the legal form of the economic entity which owns the establishment. An establishment may be single proprietorship, partnership, government corporation, stock corporation, non-stock corporation, and cooperative.
The industrial classification of an economic unit was determined by the activity from which it derives its major income or revenue. The 2009 PSIC was utilized to classify economic units according to their economic activities.
The size of an establishment is determined by its total employment (TE) as of specific date.
Geographic Classification. Establishments are also classified by geographic area using the Philippine Standard Geographic Code (PSGC) classification.
Sampling Design
The 2014 ASPBI used stratified systematic sampling with 5-digit PSIC serving as first stratification variable and employment size as the second stratification variable.
Estimation Procedure
- Non-Certainty Stratum (strata of TE 20 to 49 and TE 50 to 99)
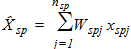
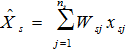
The estimate of the total of a characteristic  for the non-certainty employment strata in an industry domain in each region,
where:
s denotes the non-certainty employment strata in TE of 20 to 99
p = 1, 2,...,18 regions (geographic domains)
xspj = value of the jth establishment in the non-certainty employment strata in TE of 20 to 99 for an industry domain in each region
j = 1, 2, 3,…,nsp establishments
 = weight of thejthestablishment in the non-certainty employment strata in TE of 20 to 99 for an industry domain in each region

Nsp = total number of establishments in the non-certainty employment strata in TE of 20 to 99 for an industry domain in each region
nsp = number of sample establishments in the non-certainty employment strata in TE of 20 to 99 for an industry domain in each region
- Certainty Stratum (TE 100 and over)
The value of the total of a characteristic  for the certainty employment stratum in an industry domain in each region,

where:
c denotes the certainty employment strata of TE 100 and over
p = 1, 2,..., 17 regions (geographic domains)
xcpj = value of the jth establishment in the certainty employment strata in TE 100 and over in an industry domain within each region
j = 1, 2, 3, …,mcp establishments
mcp = number of establishments in the certainty employment strata in TE 100 and over in an industry domain within each region
- Total Estimate for TE of 20 and Over
The estimate of the total of a characteristic  for the industry domain in each region (geographic domain) was obtained by aggregating the estimates for all employment strata (non-certainty and certainty) in the same industry domain,
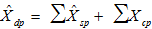
Where dp denotes the industry domains in each region.
National level estimates of the characteristics by industry domain were obtained by aggregating separately the estimates  for the particular industry domain from all the regions.
National 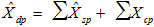
For Establishments with TE of Less Than 20
- Non-Certainty Stratum
The estimate of the total of a characteristic  for the non-certainty employment stratum TE less than 20 in the sth industry domain was
where:
s = denotes the non-certainty employment strata in TE of less than 20
Xsj = value of the jthestablishment in non-certainty employment stratum in TE of less than 20 in Sth industry domain
j = 1,2,3..., ns establishments
Wsj= weight of the jth establishment in the non-certainty employment stratum of less than 20 in the sthindustry domain

Ns = total number of establishments in the non-certainty employment stratum in TE of less than 20 in the sth industry domain
ns = number of sample establishments in the non-certainty employment stratum in TE of less than 20 in sth domain
Weight Adjustment Factor for Non-Response
To account for non-response in the non-certainty strata, the adjustment factor (n/n’) was multiplied with the sampling weight (W) of each of the sampling unit. The sampling weight, defined as N/n, was recomputed as
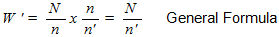
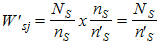
Thus, the adjusted weight (W’sj) for employment stratum in TE 1-9 or TE 10-19 was
where:
Ns= total number of establisments in the employment stratum in TE 1-9 or TE 10-19 in the sth industry domain
n's = number of responding establishments in the employment stratum in TE 1-9 or TE 10-19 in the sth industry domain
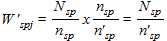
For the non-certainty employment stratum for the selected industry domain with TE 20-99, the adjusted weight (W'spj) was
where:
Nsp= total number of establisments in the non-certainty employment stratum with TE 20-99 for the selected industry domain within each geographic domain (region)
n'sp = number of responding establishments in the non-certainty employment stratum with TE 20-99 for the selected industry domain within each geographic domain (region)
Response Rate
Response rate for Construction Sector was 94.9 percent 800 out of 843 establishments). This included receipts of "good" questionnaires, partially accomplished questionnaires, reports of closed, moved out or out of scope establishments.
Reports of the remaining non-reporting establishments were taken from other available administrative data sources and financial statements from Securities and Exchange Commission (SEC). However, there were establishments which were found to be duplicates, out-of-scope and out of business in 2014.
Limitation of Data
Only the formal sector was covered in the survey.
Concepts and Definitions of Terms
Economic activity is the establishment’s source of income. If the establishment is engaged in several activities, its main economic activity is that which earns the biggest income or revenue.
Total employment is the number of persons who worked in for the establishment as of November 15, 2014.
Paid employees are all persons working in the establishment and receiving pay, as well as those working away from the establishment paid by and under the control of the establishment. Included are all employees on sick leave, paid vacation or holiday. Excluded are consultants, home workers, receiving pure commissions only, and workers on indefinite leave.
Compensation is the sum of salaries and wages, separation/retirement/terminal pay, gratuities, and payments made by the employer in behalf of the employees such as contribution to SSS/GSIS, ECC, PhilHealth, Pag-ibig, etc.
Salaries and wages are payments in cash or in kind to all employees, prior to deductions for employee’s contributions to SSS/GSIS, withholding tax, etc. Included are total basic pay, overtime pay and other benefits.
Income or Revenue refers to cash received and receivables for goods/products and by-products sold and services rendered.
E-commerce refers to the selling of products or services over electronic systems such as Internet Protocol-based networks and other computer networks. Electronic Data Interchange (EDI) network, or other on-line system. Excluded are orders received from telephone, facsimile and e-mails.
Cost refers to all expenses incurred during the year whether paid or payable. Valuation is at purchaser prices including taxes and other charges, net of rebates, returns and allowances. Goods and services received by the establishment from other establishments of the same enterprise are valued as though purchased.
Expense refers to cost incurred by the establishment during the year whether paid or payable. This is treated on a consumed basis.
Intermediate expense are expenditures incurred for construction activity such as construction materials and supplies purchased, fuels, lubricants, oils and greases purchased, electricity and water purchased, and contract and commission work done by othersplus beginning inventory of construction materials, supplies,fuels, lubricants, oils and greasesless ending inventory of materials, supplies,fuels, lubricants, oils and greases.
Value added is gross output less intermediate cost. Gross output for construction sector is value of output plus income from non-industrial services done for others (except rent income from land). Intermediate cost is intermediate expense plus expense for non-industrial services done by others (except rent expense for land) and other expenses.
Value of output represents the sum of the receipts from domestic construction activities, net income earned from construction abroad, contract and commission work done for others, income from products manufactured and sold less cost of products sold, and goods sold in the same condition as purchased less the cost of goods sold; and value of tangible fixed assets produced on own account and change in inventories of finished products and work-in-progress.
Gross addition to tangible fixed assets is equal to capital expenditures less sale of fixed assets, including land.
Change in inventories is equivalent to the value of inventories at the end of the year less the value of inventories at the beginning of the year.
Inventories refer to the stock of goods owned by and under the control of the establishment as of a fixed date, regardless of where the stocks are located. Valuation is at current replacement cost in purchaser prices. Replacement cost is the cost of an item in terms of its present price rather than its original cost.
Subsidies refer to special grants in the form of financial assistance or tax exemption or tax privilege received from the government to aid and develop an industry.
| Attachment | Size |
|---|---|
|
|
86.11 KB |
|
|
83.72 KB |