
Hog farming industry leads the sector in terms of number of establishments
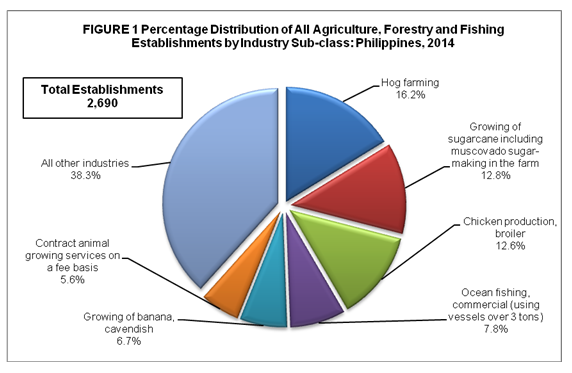
The final results of the 2014 Annual Survey of Philippine Business and Industry (ASPBI) showed that the country had a total of 2,690 establishments engaged in agriculture, forestry and fishing. More than half (56.2% or 1,511 establishments) of the total count were establishments with total employment of less than 20 while the remaining 43.8 percent (1,179 establishments) were establishments with total employment of 20 and over.
Among industry sub-classes, hog farming led the sector with 436 establishments, accounting for 16.2 percent of the total number of establishments. Growing of sugarcane including muscovado sugar-making in the farm ranked second with 345 establishments or 12.8 percent, followed by chicken broiler production with 338 establishments (12.6%)
Other industries with more than a hundred number of establishments are as follows:
Ocean fishing, commercial (using vessels over 3 tons), 210 establishments (7.8%)
Growing of banana, cavendish, 180 establishments (6.7%)
- Contract animal growing services on a fee basis, 150 establishments (5.6%)
- Chicken egg production, 121 establishments (4.5%)
- Chicken production, layer, 105 establishments (3.9%)
Figure 1 displays the percentage distribution of all agriculture, forestry and fishing establishments by industry sub-class in 2014.
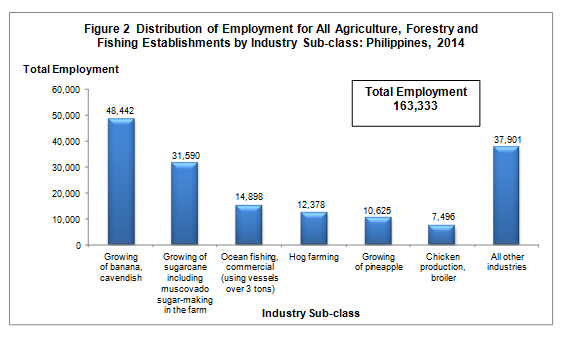
Growing of cavendish banana industry generates the highest employment
Total employment generated for all agriculture, forestry and fishing establishments reached 163,333 in 2014. Of the total workforce, 159,446 workers or 97.6 percent were paid employees while the remaining 2.4 percent were working owners and unpaid workers.
At the industry level, growing of cavendish banana employed the most number of workers with 48,442 or 29.7 percent of the total. Growing of sugarcane including muscovado sugar-making in the farm came in next with 31,590 workers or 19.3 percent. Commercial ocean fishing followed with 14,898 workers or 9.1 percent share.
Figure 2 shows the distribution of employment for all agriculture, forestry and fishing establishments by industry sub-class in 2014.
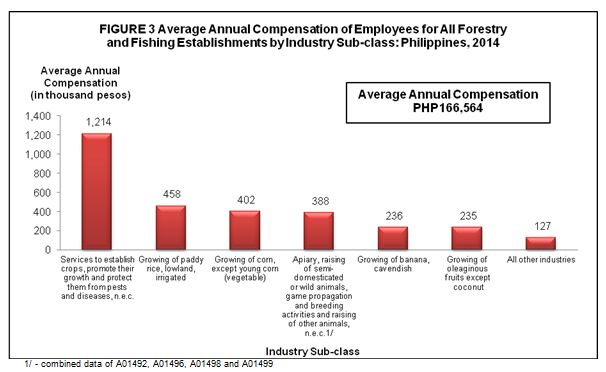
Growing of cavendish banana industry pays the highest average annual compensation
Total compensation paid by the sector to its employees in 2014 amounted to PHP26.6 billion, translating to an average annual compensation of PHP166,564 per employee
By industry, growing of cavendish banana spent the highest compensation of PHP11.2 billion (42.0%). Commercial ocean fishing activities followed with PHP2.3 billion (8.7%) while growing of sugarcane including muscovado sugar-making in the farm ranked third with PHP1.9 billion (7.1%).
Services to establish crops, promote their growth and protect them from pests and diseases, n.e.c. paid the highest average annual compensation of PHP1,214,310 per employee. This was followed by growing of paddy rice, lowland, irrigated and growing of corn, except young corn (vegetable) with respective annual pay of PHP457,594 and PHP402,098 per employee.
Completing the top six industries in terms of average annual compensation are as follows:
Apiary, raising of semi-domesticated or wild animals including birds, reptiles and insects, game propagation and breeding activities and raising of other animals, n.e.c., PHP388,254 per employee
Growing of banana, cavendish, PHP235,720 per employee
Growing of oleaginous fruits except coconut, PHP235,182 per employee
Figure 3 shows the average annual compensation of employees for all agriculture, forestry and fishing establishments by industry sub-class in 2014.
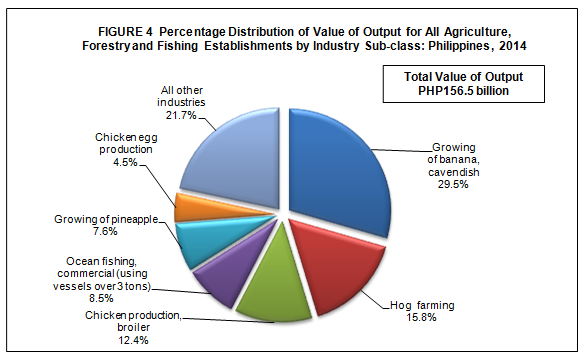
Growing of cavendish banana industry generates highest value of output
Total value of output generated by all agriculture, forestry and fishing establishments reached PHP156.5 billion in 2014.
Industry wise, growing of cavendish banana generated the highest value of output with PHP46.1 billion or 29.5 percent. This was followed by hog farming and chicken broiler production with respective value of output of PHP24.8 billion (15.8%) and PHP19.4 billion (12.4%).
Figure 4 illustrates the percentage distribution of value of output for all agriculture, forestry and fishing establishments by industry sub-class in 2014.
Total expense reaches 153.3 billion in 2014
Total expense, including compensation, for all agriculture, forestry and fishing establishments amounted to PHP153.3 billion.
The top three industries comprised more than half (57.4%) of the total expense incurred by the sector. Growing of cavendish banana recorded the highest expense amounting to PHP46.0 billion or 30.0 percent of the total. Hog farming followed with PHP23.2 billion or 15.1 percent of the total. Chicken broiler production came in third with PHP18.8 billion or 12.3 percent of the total.
Income per expense ratio stands at 1.03
The sector generated an income per expense ratio of 1.03 in 2014. This means that for every peso spent, a corresponding income of PHP1.03 was generated.
At the industry level, operation of irrigation systems through cooperatives recorded the highest income per expense ratio of 1.66, followed by plant propagation with 1.65.
Completing the top ten industries in terms of income per expense ratio are the following:
- Growing of corn, except young corn (vegetable), 1.55
- Growing of coffee, 1.43
- Preparation of crops for primary markets, 1.32
- Growing of cocoa, 1.31
- Goat farming, 1.25
- Growing of fruit bearing vegetables, 1.24
- Services to promote propagation, growth and output of animals and farm management, 1.23
- Growing of paddy rice, lowland, irrigated, 1.20
Growing of cavendish banana industry generates the highest value added
Total value added produced by all agriculture, forestry and fishing establishments in 2014 was estimated at PHP40.6 billion.
Among industries, growing of cavendish banana generated the highest value added amounting to PHP14.4 billion or 35.6 percent of the total. Commercial ocean fishing followed with PHP4.0 billion (9.8%). Hog farming ranked third with PHP3.7 billion (9.2%).
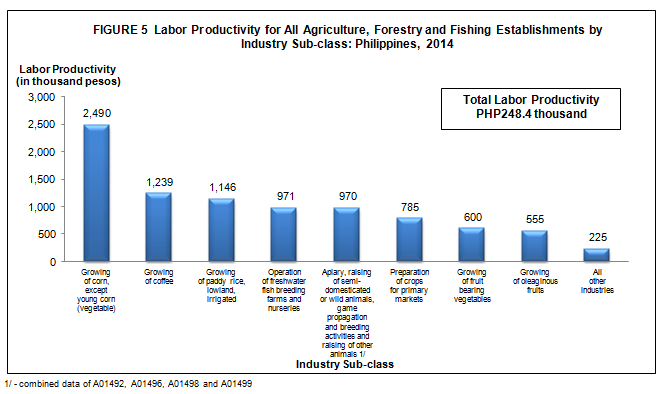
Growing of corn, except young corn (vegetable) industry posts the highest labor productivity
The ratio of value added to employment, a measure of labor productivity, was recorded at PHP248,361 per worker in 2014.
Growing of corn, except young corn (vegetable) generated a labor productivity of PHP2.5 million per worker, the highest among industries. This was followed by growing of coffee with PHP1.2 million per worker. Growing of paddy rice, lowland, irrigated came in next with PHP1.1 million per worker.
The following industries reported a labor productivity of more than half a million in 2014:
- Operation of freshwater fish breeding farms and nurseries, PHP971,300 per worker
Apiary, raising of semi-domesticated or wild animals including birds, reptiles and insects, game propagation and breeding activities and raising of other animals, n.e.c., PHP970,139 per worker
Preparation of crops for primary markets, PHP785,283 per worker
Growing of fruit bearing vegetables, PHP599,994 per worker
- Growing of oleaginous fruits except coconut, PHP554,683 per worker
Figure 5 displays the labor productivity for all agriculture, forestry and fishing establishments by industry sub-class in 2014.
Gross addition to tangible fixed assets reaches PHP7.8 billion
Gross addition to tangible fixed assets acquired by all agriculture, forestry and fishing establishments was valued at PHP7.8 billion in 2014.
At the industry level, growing of cavendish banana contributed the highest gross addition to tangible fixed assets at PHP1.4 billion or 17.6 percent of the total. This was followed by commercial ocean fishing with PHP1.2 billion or 15.5 percent of the total and hog farming, also with approximately PHP1.2 billion or 15.2 percent of the total.
Total subsidies received in 2014 amounts to PHP3.2 billion
Subsidies granted by the government to support the business operation of all agriculture, forestry and fishing establishments in 2014 amounted to PHP3.2 billion.
Among industries, services to establish crops, promote their growth and protect them from pests and diseases, n.e.c. received the highest subsidies with PHP2.9 billion or 89.5 percent of the total. This was followed by dairy farming receiving PHP25 thousand or less than one percent share to total subsidies.
TECHNICAL NOTES
Introduction
This Special Release presents the final results of the 2014 ASPBI for the agriculture, forestry and fishing establishments.
The 2014 ASPBI is one of the designated statistical activities of the Philippine Statistics Authority (PSA). Data collected from the survey provide information on the levels, structure, performance, and trends of economic activities of the formal sector in the entire country for the year 2014. The 2014 Survey of Tourism Establishments in the Philippines was undertaken as a rider to this survey.
The survey was conducted nationwide in April 2015 with the year 2014 as the reference period of data, except for employment which is as of November 15, 2014.
Data are presented at the national and industry sub-class or 5-digit 2009 Philippine Standard Industrial Classification (PSIC) and at the regional level.
Legal Authority
The conduct of the 2014 ASPBI is authorized under Republic Act 10625 known as the Philippine Statistical Act of 2013 - Reorganizing and strengthening of the Philippine Statistical System (PSS), its agencies and instrumentalities.
Scope and Coverage
The 2014 ASPBI covered establishments engaged in 18 economic sectors classified under the 2009 PSIC, namely:
- Agriculture, Forestry, and Fishing (A)
- Mining and Quarrying (B)
- Manufacturing (C)
- Electricity, Gas, Steam, and Air Conditioning Supply (D)
- Water Supply; Sewerage, Waste Management and Remediation Activities (E)
- Construction (F)
- Wholesale and Retail Trade; Repair of Motor Vehicles and Motorcycles (G)
- Transportation and Storage (H)
- Accommodation and Food Service Activities (I)
- Information and Communication (J)
- Financial and Insurance Activities (K)
- Real Estate Activities (L)
- Professional, Scientific and Technical Activities (M)
- Administrative and Support Service Activities (N)
- Education (P)
- Human Health and Social Work Activities (Q)
- Arts, Entertainment, and Recreation (R)
- Other Service Activities (S)
The following sections of the 2009 PSIC are excluded from the scope of this survey and all other establishment-based surveys of PSA:
- Public Administration and Defense; Compulsory Social Security (Section O)
- Activities of Households as Employers; Undifferentiated Goods and Services Producing Activities of Households for Own Use (Section T)
- Activities of Extra-territorial Organization and Bodies (Section U)
The survey was confined to the formal sector of the economy, which consists of the following:
- Corporations and partnership
- Cooperatives and foundations
- Single proprietorship with employment of 10 and over
- Single proprietorships with branches
Hence, the 2014 ASPBI covered only the following economic units:
- All establishments with total employment of 10 and over; and
All establishments with total employment of less than 10, except those with Legal Organization = 1 (Single proprietorship) and Economic Organization = 1 (Single establishments), that are engaged in economic activities described according to the 2009 PSIC.
Frame of Establishments
The frame for the 2014 ASPBI was extracted from the 2014 List of Establishments (LE). The estimated number of establishments in operation in the country in 2014 totaled to 944,500. About 266,257 establishments (28.0% of the total establishments) belong to the formal sector of which 231,241 (87.0%) comprised the establishment frame. This frame was used to draw the sample establishments for the survey.
Unit of Enumeration
The unit of enumeration for the 2014 ASPBI is the establishment. An establishment is defined as an economic unit under a single ownership or control which engages in one or predominantly one kind of activity at a single fixed location.
Classification of Establishments
An establishment is categorized by its economic organization, legal organization, industrial classification, employment size, and geographic location.
Economic Organization refers to the organizational structure or role of the establishment in the organization. An establishment may be single establishment, branch, establishment and main office with branches elsewhere, main office only, and ancillary unit other than main office.
Legal Organization refers to the legal form of the economic entity which owns the establishment. An establishment may be single proprietorship, partnership, government corporation, stock corporation, non-stock corporation, and cooperative.
Industrial classification of an economic unit was determined by the activity from which it derives its major income or revenue. The 2009 PSIC was utilized to classify economic units according to their economic activities.
Size of an establishment is determined by its total employment (TE) as of a specific date.
Geographic Classification refers to the classification by geographic area using the Philippine Standard Geographic Code (PSGC) classification.
Methodology
Sampling Design
The 2014 ASPBI used stratified systematic sampling with five-digit PSIC serving as first stratification variable and TE as the second stratification variable.
For establishments with TE 20 and over, the 17 administrative regions served as the geographic domains while the 5-digit level of the 2009 PSIC served as the industry domains.
Estimation Procedure for Establishments with TE of 20 and over
- Non-Certainty Stratum (strata of TE 20 to 49 and TE 50 to 99)
The estimate of the total of a characteristic ![]() for the non-certainty employment strata in an industry domain in each region was
for the non-certainty employment strata in an industry domain in each region was

where:
s denotes the non-certainty employment strata in TE of 20 to 99
p = 1, 2,..., 17 regions (geographic domains)
xspj = value of the jth establishment in the non-certainty employment strata in TE of 20 to 99 for an industry domain in each region
j = 1, 2, 3,…, nsp establishments
![]() = weight of the jth establishment in the non-certainty employment strata in TE of 20 to 99 for an industry domain in each region
= weight of the jth establishment in the non-certainty employment strata in TE of 20 to 99 for an industry domain in each region

Nsp = total number of establishments in the non-certainty employment strata in TE of 20 to 99 for an industry domain in each region
nsp = number of sample establishments in the non-certainty employment strata in TE of 20 to 99 for an industry domain in each region
- Certainty Stratum (TE 100 and over)
The value of the total of a characteristic ![]() for the certainty employment stratum in an industry domain in each region was
for the certainty employment stratum in an industry domain in each region was

where:
c denotes the certainty employment strata in TE of 100 and over
p = 1, 2,..., 17 regions (geographic domains)
xcpj = value of the jth establishment in the certainty employment strata in TE of 100 and over in an industry domain within each region
j = 1, 2, 3, …, mcp establishments
mcp = number of establishments in the certainty employment strata in TE of 100 and over in an industry domain within each region
- Total Estimate for TE of 20 and Over
The estimate of the total of a characteristic ![]() for the industry domain in each region (geographic domain) was obtained by aggregating the estimates for all employment strata (non-certainty and certainty) in the same industry domain,
for the industry domain in each region (geographic domain) was obtained by aggregating the estimates for all employment strata (non-certainty and certainty) in the same industry domain,

where dp denotes the industry domains in each region.
National level estimates of the characteristics by industry domain were obtained by aggregating separately the estimates ![]() for the particular industry domain from all the regions.
for the particular industry domain from all the regions.
Weight Adjustment Factor for Non-Response
To account for non-response in the non-certainty strata, the adjustment factor (n/n’) was multiplied with the sampling weight (W) of each of the sampling unit. The sampling weight, defined as N/n, was recomputed as

Thus, the adjusted weight (W’spj) for the non-certainty employment stratum for the industry domain with TE 20-99 was

where:
Nsp = total number of establishments in the non-certainty employment stratum with TE 20-99 for the industry domain within each geographic domain (region)
n’sp = number of responding establishments in the non-certainty employment stratum with TE 20-99 for the industry domain within each geographic domain (region)
Response Rate
Response rate for Agriculture, Forestry and Fishing Sector for establishments was 82.2 percent (950 out of 1,156 establishments). This included receipts of "good" questionnaires, partially accomplished questionnaires, reports of closed, moved out or out of scope establishments.
Reports of the remaining non-reporting establishments were imputed based on established imputation methods and from other available administrative data sources. However, reports of establishments which were found to be duplicates and out of business in 2014, were not imputed.
Of the total responses, 9 establishments responded online.
Limitation of Data
The 2014 ASPBI covered only the formal sector of the economy.
Concepts and Definitions of Terms
Economic activity is the establishment’s source of income. If the establishment is engaged in several activities, its main economic activity is that which earns the biggest income or revenue.
Total employment is the number of persons who worked in for the establishment as of November 15, 2014.
Paid employees are all persons working in the establishment and receiving pay, as well as those working away from the establishment paid by and under the control of the establishment. Included are all employees on sick leave, paid vacation or holiday. Excluded are consultants, home workers, receiving pure commissions only, and workers on indefinite leave.
Compensation is the sum of salaries and wages, separation/retirement/terminal pay, gratuities, and payments made by the employer in behalf of the employees such as contribution to SSS/GSIS, ECC, PhilHealth, Pag-ibig, etc.
Salaries and wages are payments in cash or in kind to all employees, prior to deductions for employee’s contributions to SSS/GSIS, withholding tax, etc. Included are total basic pay, overtime pay and other benefits.
Income or Revenue refers to cash received and receivables for goods/products and by-products sold and services rendered.
E-commerce refers to the selling of products or services over electronic systems such as Internet Protocol-based networks and other computer networks. Electronic Data Interchange (EDI) network, or other on-line system. Excluded are orders received from telephone, facsimile and e-mails.
Expense refers to cost incurred in an enterprise effort to generate revenue, representing the cost of doing business. This is treated on a consumed basis. It excludes cost incurred in the acquisition of income generating assets.
Intermediate expense are expenditures incurred in the production of goods such as materials and supplies used, fuels, lubricants, oils and greases used; electricity and water purchased, agricultural/forestry/fishery and industrial services done by others.
Value added is gross output less intermediate input. Gross output for the agriculture, forestry and fishing sector is value of output non-industrial services done for others (except rent income from land). Intermediate input is intermediate expenses plus non-industrial services done by others (except rent expense for land) and all other expenses.
Value of output represents the sum of the receipts from products and by-products sold, agricultural/forestry/fishery services rendered, industrial services, and goods sold in the same condition as purchased less the cost of goods sold; and value of fixed assets produced on own account and change in inventories of finished products and work-in-progress.
Gross addition to tangible fixed assets is equal to capital expenditures less sale of fixed assets, including land.
Change in inventories is equivalent to the value of inventories at the end of the year less the value of inventories at the beginning of the year.
Inventories refer to the stock of goods owned by and under the control of the establishment as of a fixed date, regardless of where the stocks are located. Valuation is at current replacement cost in purchaser prices. Replacement cost is the cost of an item in terms of its present price rather than its original cost.
Subsidies are all special grants in the form of financial assistance or tax exemption or tax privilege given by the government to aid and develop an industry.