
Animal production industry leads the sector in terms of number of establishments
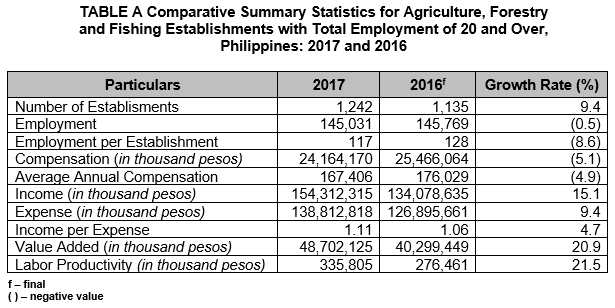
The 2017 Annual Survey of Philippine Business and Industry (ASPBI) preliminary results showed that a total of 1,242 establishments with total employment (TE) of 20 and over in the formal sector of the economy were engaged in agriculture, forestry and fishing. This was higher by 9.4 percent from the 1,135 total establishments for the sector in 2016. (Table A)
Across industry groups, animal production led the sector in terms of number of establishments with 405 establishments or 32.6 percent of the total. This was followed by growing of non-perennial crops with 325 (26.2%) establishments and growing of perennial crops with 188 (15.1%) establishments. (Figure 1)
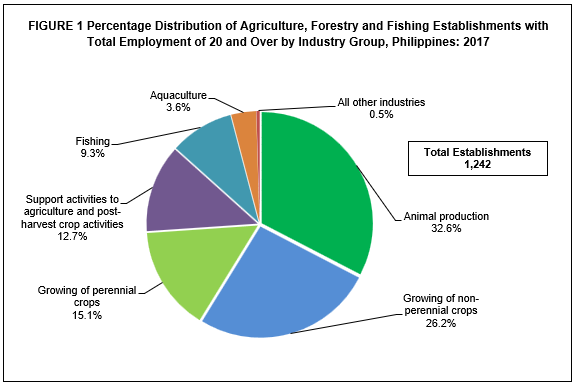
Across regions, Western Visayas had the most number of establishments (21.2 %), followed by Central Luzon (12.2%). (Table 2)
Other regions with more than 100 establishments were:
• Davao Region, 146 (11.8%) establishments
• CALABARZON, 139 (11.2%) establishments
• Northern Mindanao, 133 (10.7%) establishments
Growing of perennial crops industry generates highest employment
The total employment of agriculture, forestry and fishing sector in 2017 reached 145,031 workers. Of the total workforce, 144,345 workers or 99.5 percent were paid employees while the remaining 0.5 percent were working owners and unpaid workers. (Table 1)
Across industry groups, establishments engaged in growing of perennial crops recorded the biggest share (59,416 or 41.0%) to total employment. Growing of non-perennial crops (22.5%) ranked second, followed by animal production (16.7 %). (Figure 2)
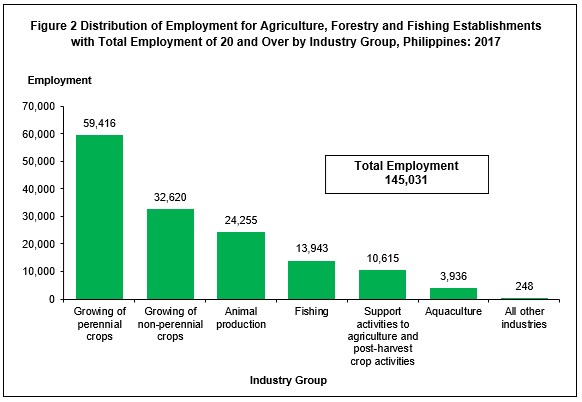
Across regions, Davao Region employed the most number of workers (23.7%), even though it ranks only third in terms of number of establishments. Western Visayas registered the second highest number of workers (18.4%), followed by Northern Mindanao (13.1%). (Table 2)
The sector recorded an average of 117 workers per establishment with growing of perennial crops posting an average of 316 workers per establishment, the highest average across industries. This was followed by fishing activities with 121 workers per establishment. (Table 1a)
Support activities to agriculture and post-harvest crop activities industry pays the highest average annual compensation
In 2017, agriculture, forestry and fishing establishments with TE 20 and over paid a total compensation of PHP24.2 billion, equivalent to an average annual compensation of PHP167,406 per employee. This average annual compensation was lower by PHP8,623 compared to PHP176,029 paid in 2016. (Tables 1 and 1a, and Figure 3)
Growing of perennial crops (PHP12.6 billion or 52.2%) accounted for more than half of the total compensation for the sector. However, it posted only the second highest average annual compensation per employee (PHP212,469). Support activities to agriculture and post-harvest crop activities posted the highest average annual compensation of PHP270,434 per employee. On the other hand, establishments engaged in growing of non-perennial crops paid the least average annual compensation of PHP80,338. Note that the average annual compensation per employee for these three industries was lower than their corresponding 2016 value. (Figure 3)
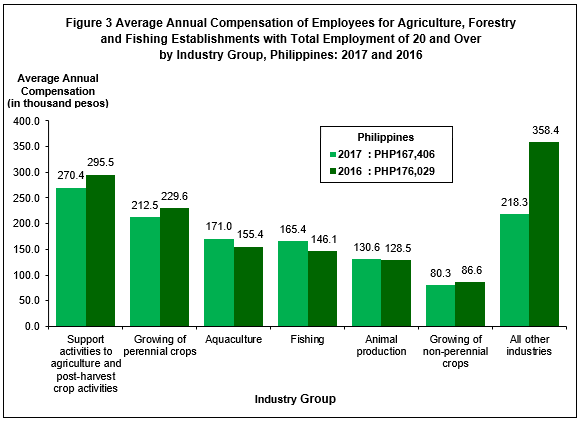
Across regions, Ilocos Region paid the highest average annual compensation of PHP373,498 per employee. ARMM and National Capital Region followed with average annual compensation of PHP248,496 and PHP230,558 per employee, respectively. (Table 2a)
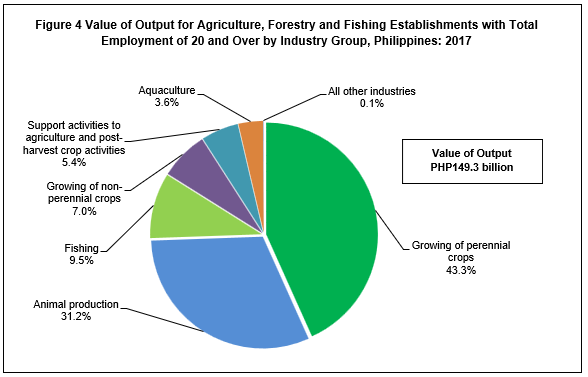
Growing of perennial crops industry generates almost half of the total value of output
Total value of output generated by agriculture, forestry and fishing establishments with TE of 20 and over reached PHP149.3 billion in 2017. (Table 1)
Across industry groups, establishments engaged in growing of perennial crops generated the highest value of output amounting to PHP64.6 billion or 43.3 percent of the total. This was followed by animal production with PHP46.5 billion (31.2%) and fishing with PHP14.1 billion (9.5%). (Figure 4)
In terms of value of output, three regions topped the list, with a combined value of output worth PHP86.1 billion, equivalent to more than half of the total value of output. Davao Region generated the highest output value (27.5%), followed by Northern Mindanao (16.1%) and SOCCSKSARGEN (14.2%). (Table 2)
Total expense of the sector amounts to PHP138.8 billion
Total expense increased by 9.4 percent, reaching PHP138.8 billion from PHP126.9 billion in 2016. (Table 1)
Across industry groups, growing of perennial crops incurred the highest expense amounting to PHP 55.4 billion (39.9%), followed by animal production (30.2%) and fishing (10.4%). Note that these three industry groups also posted the highest value of output. (Table 1)
The top three regions in terms of value of output were also the top regions in terms of value of expense. These regions had a combined value of expense amounting to more than half (53.8%) of the total expense. Davao Region expended the most (24.2%), followed by Northern Mindanao (14.9%) and SOCCSKSARGEN (14.7%). (Table 2)
Income per expense ratio stands at 1.11
The generated income per peso expense for the sector stood at 1.11 in 2017, higher than the 1.06 ratio in 2016. This implies that for every peso spent, an income of PHP1.11 was generated. (Table 1a)
The highest income per expense ratio was noted in establishments engaged in growing of perennial crops with income per peso expense of 1.20. Support activities to agriculture and post-harvest crop activities reported the lowest income per expense ratio of 0.71. (Table 1a)
Across regions, Davao Region registered the highest return with income per expense ratio of 1.22. This was followed by Northern Mindanao (1.18) and Central Luzon (1.16). (Table 2a)
Value added of the sector stands at PHP48.7 billion
Value added generated by establishments with TE of 20 and over reached PHP48.7 billion, an increase of 20.9 percent from PHP40.3 billion reported in 2016. (Table 1)
The top three contributors to the total value added were:
• Growing of perennial crops, PHP27.4 billion (56.3%)
• Animal Production, PHP12.0 billion (24.6%)
• Growing of non-perennial crops, PHP4.2 billion (8.7%)
At the regional level, Davao Region generated the highest value added of PHP17.2 billion (35.2%), followed by Northern Mindanao (18.7%) and SOCCSKSARGEN (11.9%). (Table 2)
Animal production industry registers the highest productivity
The ratio of value added to employment, a measure of labor productivity, was recorded at PHP335,805 per worker in 2017, higher than the PHP276,461 per worker recorded in 2016. (Table 1a and Figure 5)
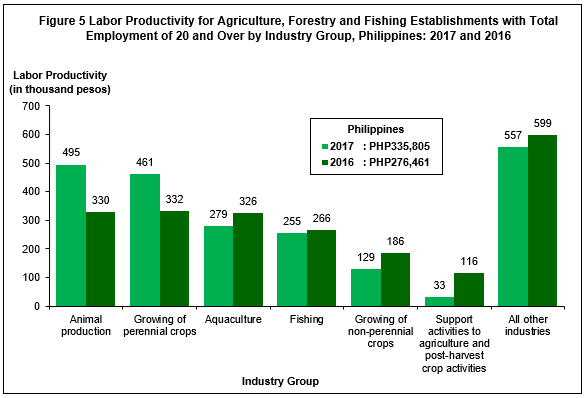
Among industries, animal production generated the highest labor productivity of PHP494,818 per worker. This ratio was higher than the 2016 labor productivity ratio for animal production. Growing of perennial crops ranked second with PHP461,317 per worker, also an improvement from the 2016 ratio. Aquaculture followed with PHP278,905 per worker, a slump from its labor productivity value in 2016. (Figure 5)
Across regions, Ilocos Region was the most labor productive in 2017, registering a labor productivity of PHP654,240 per worker. This was followed by CALABARZON and Davao Region with respective labor productivity of PHP514,840 and PHP500,138 per worker. (Table 2a)
Total subsidies amounts to PHP3.3 billion in 2017
Subsidies granted by the government to support the business operation of agriculture, forestry and fishing establishments amounted to PHP3.3 billion, higher by 67.8% than the PHP2.0 billion subsidies in 2016. (Table 1)
Only two out of nine industry groups were recipients of government subsidies, with support activities to agriculture and post-harvest crop activities (97.5%) receiving the bulk of the subsidies. Only 2.5% of the total subsidies amounting to PHP 83.0 million was given to fishing activities. (Table 1)
(Sgd.) ROSALINDA P. BAUTISTA
Assistant Secretary
Deputy National Statistician
Sectoral Statistics Office
TECHNICAL NOTES
Introduction
This Special Release presents the preliminary results of the 2017 Annual Survey of Philippine Business and Industry (ASPBI) for the Agriculture, Forestry and Fishing sector for establishments with total employment of 20 and over.
The 2017 ASPBI is one of the designated statistical activities of the Philippine Statistics Authority (PSA). Data collected from the survey provide information on the levels, structure, performance, and trends of economic activities of the formal sector in the entire country for the year 2017.
The survey was conducted nationwide in 2018 with the year 2017 as the reference period of data, except for employment which is as of November 15, 2017.
Establishment Data Management System (EDMS) was still utilized in the decentralized processing of 2017 ASPBI questionnaires in the province as well as the online accomplishment of questionnaire through the PSA website.
Data are presented at the national and industry group or 3-digit 2009 Philippine Standard Industrial Classification (PSIC).
Data are also generated at the regional level.
Legal Authority
The conduct of the 2017 ASPBI is authorized under Republic Act 10625 known as the Philippine Statistical Act of 2013 - Reorganizing and strengthening of the Philippine Statistical System (PSS), its agencies and instrumentalities.
Scope and Coverage
The 2017 ASPBI covered establishments engaged in 18 economic sectors classified under the 2009 PSIC, namely:
Agriculture, Forestry, and Fishing (A)
Mining and Quarrying (B)
Manufacturing (C)
Electricity, Gas, Steam, and Air Conditioning Supply (D)
Water Supply; Sewerage, Waste Management and Remediation Activities (E)
Construction (F)
Wholesale and Retail Trade; Repair of Motor Vehicles and Motorcycles (G)
Transportation and Storage (H)
Accommodation and Food Service Activities (I)
Information and Communication (J)
Financial and Insurance Activities (K)
Real Estate Activities (L)
Professional, Scientific and Technical Activities (M)
Administrative and Support Service Activities (N)
Education (P)
Human Health and Social Work Activities (Q)
Arts, Entertainment, and Recreation (R)
Other Service Activities (S)
The survey was confined to the formal sector of the economy, which consists of the following:
Corporations and partnership
Cooperatives and foundations
Single proprietorship with employment of 10 and over
Single proprietorships with branches
Hence, the 2017 ASPBI covered only the following economic units:
All establishments with total employment of 10 and over; and
All establishments with total employment of less than 10, except those with Legal Organization = 1 (Single proprietorship) and Economic Organization = 1 (Single establishments), that are engaged in economic activities described according to the 2009 PSIC.
Frame of Establishments
The frame for the 2017 ASPBI was extracted from the 2017 List of Establishments (LE). The estimated number of establishments in operation in the country in 2017 totaled to 917,582. About 228,112 establishments (24.9%) of the total establishments comprised the establishment frame or are within the scope and coverage of the 2017 ASPBI.
Unit of Enumeration
The unit of enumeration for the 2017 ASPBI is the establishment. An establishment is defined as an economic unit under a single ownership or control which engages in one or predominantly one kind of activity at a single fixed location.
Classification of Establishments
An establishment is categorized by its economic organization, legal organization, industrial classification, employment size, and geographic location.
Economic Organization refers to the organizational structure or role of the establishment in the organization. An establishment may be single establishment, branch, establishment and main office with branches elsewhere, main office only, and ancillary unit other than main office.
Legal Organization refers to the legal form of the economic entity which owns the establishment. An establishment may be single proprietorship, partnership, government corporation, stock corporation, non-stock corporation, and cooperative.
Industrial classification of an economic unit was determined by the activity from which it derives its major income or revenue. The 2009 PSIC was utilized to classify economic units according to their economic activities.
Size of an establishment is determined by its total employment (TE) as of a specific date.
Geographic Classification refers to the classification by geographic area using the Philippine Standard Geographic Code (PSGC) classification. The PSGC contains the latest updates on the official number of regions, provinces, cities, municipalities, and barangays in the Philippines. The PSGC as of December 31, 2017 was used for the 2017 ASPBI.
Methodology
Sampling Design
The 2017 ASPBI used stratified systematic sampling with 3-digit or 5-digit PSIC serving as first stratification variable and TE as the second stratification variable.
Estimation Procedure
a. Non-Certainty Stratum (strata of TE 20 to 49 and TE 50 to 99)
The estimate of the total of a characteristic ![]() for the non-certainty employment strata in an industry domain in each region,
for the non-certainty employment strata in an industry domain in each region,
where:
s = denotes the non-certainty employment strata in TE of 20 to 49 and TE 50 to 99
p = 1, 2,...17 regions (geographic domains)
xspj = value of the jth establishment in the non-certainty employment strata in TE of 20 to 49 and TE 50 to 99 for an industry domain in each region
j = 1, 2, 3,…nsp establishments
Wspj = weight of the jth establishment in the non-certainty employment strata with TE 20 to 49 and TE 50 to 99 for an industry domain in each region
Nsp = total number of establishments in the non-certainty employment strata in TE of 20 to 49 and TE 50 to 99 for an industry domain in each region
nsp = number of sample establishments in the non-certainty employment strata in TE of 20 to 49 and TE of 50 to 99 for an industry domain in each region
b. Certainty Stratum (TE 100 and over)
The value of the total of a characteristic ![]() for the certainty employment stratum in an industry domain in each region,
for the certainty employment stratum in an industry domain in each region,
where:
c = denotes the certainty employment strata in TE of 100 and over
p = 1, 2,...17 regions (geographic domains)
xcpj = value of the jth establishment in the certainty employment strata in TE of 20 and over in an industry domain within each region
j = 1, 2, 3, …mcp establishments
mcp = number of establishments in the certainty employment strata in TE of 20 and over in an industry domain within each region
c. Total Estimate for TE of 20 and Over
The estimate of the total of a characteristic ![]() for the industry domain in each region (geographic domain) was obtained by aggregating the estimates for all employment strata (non-certainty and certainty) in the same industry domain,
for the industry domain in each region (geographic domain) was obtained by aggregating the estimates for all employment strata (non-certainty and certainty) in the same industry domain,
where dp denotes the industry domains in each region.
National level estimates of the characteristics by industry domain were obtained by aggregating separately the estimates ![]() for the particular industry domain from all the regions.
for the particular industry domain from all the regions.

For Establishments with TE of Less Than 20
a. Non-Certainty Stratum
The estimate of the total of a characteristic ![]() for the non-certainty employment stratum TE less than 20 in the sth industry domain was
for the non-certainty employment stratum TE less than 20 in the sth industry domain was
where:
s = denotes the non-certainty employment strata in TE of less than 20
Xsj = value of the jth establishment in non-certainty employment stratum in TE of less than 20 in Sth industry domain
j = 1,2,3...ns establishments
Wsj = weight of the jth establishment in the non-certainty employment stratum of less than 20 in the sth industry domain

Ns = total number of establishments in the non-certainty employment stratum in TE of less than 20 in the sth industry domain
ns = number of sample establishments in the non-certainty employment stratum in TE of less than 20 in sth domain
Weight Adjustment Factor for Non-Response
To account for non-response in the non-certainty strata, the adjustment factor (n/n’) was multiplied with the sampling weight (W) of each of the sampling unit. The sampling weight, defined as N/n, was recomputed as
Thus, the adjusted weight (W’sj) for employment stratum in TE 1-9 or TE 10-19 was
where:
Ns = total number of establishments in the non-certainty employment stratum with TE 20-99 for the industry domain within each geographic domain (region)
n’s = number of responding establishments in the non-certainty employment stratum with TE 20-99 for the industry domain within each geographic domain (region)
For the non-certainty employment stratum for the selected industry domain with TE 20-99, the adjusted weight (W'spj) was
where:
Nsp = total number of establisments in the non-certainty employment stratum with TE 20-99 for the selected industry domain within each geographic domain (region)
n'sp = number of responding establishments in the non-certainty employment stratum with TE 20-99 for the selected industry domain within each geographic domain (region)
Response Rate
Response rate for Agriculture, Forestry and Fishing Sector was 91.2 percent (739 out of 810 establishments). This included receipts of "good" questionnaires, partially accomplished questionnaires, reports of closed, moved out or out of scope establishments.
Reports of the remaining non-reporting establishments were taken from other available administrative data sources and financial statements from Securities and Exchange Commission (SEC). However, there were establishments which were found to be duplicates, out-of-scope and out of business in 2017.
Limitation of Data
Only the formal sector was covered in the survey.
Concepts and Definitions of Terms
Change in inventories is equivalent to the value of inventories at the end of the year less the value of inventories at the beginning of the year.
Compensation is the sum of salaries and wages, separation/retirement/terminal pay, gratuities, and payments made by the employer in behalf of the employees such as contribution to SSS/GSIS, ECC, PhilHealth, Pag-ibig, etc.
E-commerce refers to the selling of products or services over electronic systems such as Internet Protocol-based networks and other computer networks. Electronic Data Interchange (EDI) network or other online system. Excluded are orders received from telephone, facsimile and e-mails.
Economic activity is the establishment’s source of income. If the establishment is engaged in several activities, its main economic activity is that which earns the biggest income or revenue.
Establishment is defined as an economic unit under a single ownership or control which engages in one or predominantly one kind of activity at a single fixed location.
Expense refers to cost incurred in an enterprise effort to generate revenue, representing the cost of doing business. This is treated on a consumed basis. It excludes cost incurred in the acquisition of income generating assets.
Gross addition to tangible fixed assets is equal to capital expenditures less sale of fixed assets, including land.
Income or Revenue refers to cash received and receivables for goods/products and by-products sold and services rendered. Valuation is at producer prices (ex-establishment) net of discounts and allowances, including duties and taxes but excluding subsidies.
Intermediate expense are expenditures incurred in the production of goods such as materials and supplies used; fuels, lubricants, oils and greases used; electricity and water purchased, and industrial services done by others.
Paid employees are all persons working in the establishment and receiving pay, as well as those working away from the establishment paid by and under the control of the establishment. Included are all employees on sick leave, paid vacation or holiday. Excluded are consultants, home workers, receiving pure commissions only, and workers on indefinite leave.
Salaries and wages are payments in cash or in kind to all employees, prior to deductions for employee’s contributions to SSS/GSIS, withholding tax, etc. Included are total basic pay, overtime pay and other benefits.
Subsidies are all special grants in the form of financial assistance or tax exemption or tax privilege given by the government to aid and develop an industry.
Total employment is the number of persons who worked in or for the establishment as of 15 November 2017.
Value added is gross output less intermediate input. Gross output for the water supply; sewerage, waste management and remediation activities sector is value of output plus income from non-industrial services done for others (except rent income from land). Intermediate input is intermediate expense plus expense for non-industrial services done by others (except rent expense for land) and all other expenses.
Value of output represents the sum of the receipts from revenue from main activity, income from industrial services done for others, goods sold in the same condition as purchased less the cost of goods sold and value of fixed assets produced on own account.