
Number of Establishments up by 15.1 percent
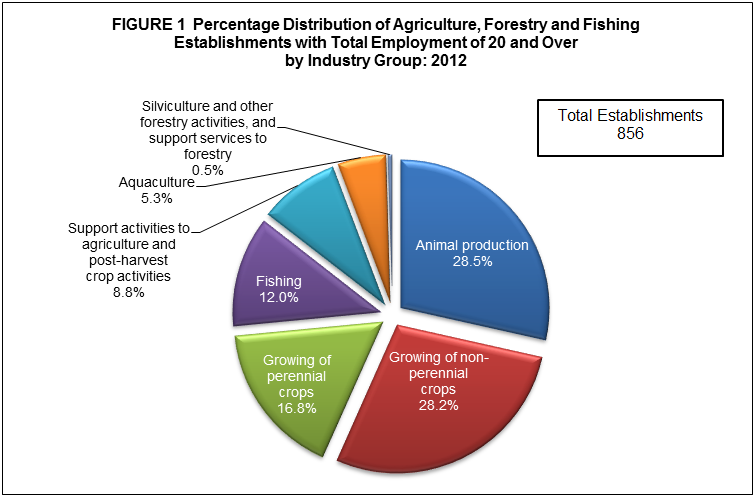
The preliminary results of the 2012 Census of Philippine Business and Industry (CPBI) showed that the country had a total of 856 establishments with total employment (TE) of 20 and over engaged in agriculture, forestry and fishing in the formal sector of the economy. This number was higher by 15.1 percent from the 744 establishments recorded in 2010. The positive growth was mainly brought by the 112 newly listed establishments in the 2012 List of Establishments.
Among the industry groups, animal production led the sector with 244 establishments, accounting for 28.5 percent of the total number of establishments. Growing of non-perennial crops came next with 241 or 28.2 percent. Growing of perennial crops and fishing followed with 144 establishments (16.8%) and 103 establishments (12.0%), respectively.
Figure 1 displays the percentage distribution of agriculture, forestry and fishing establishments with TE of 20 and over by industry group in 2012.
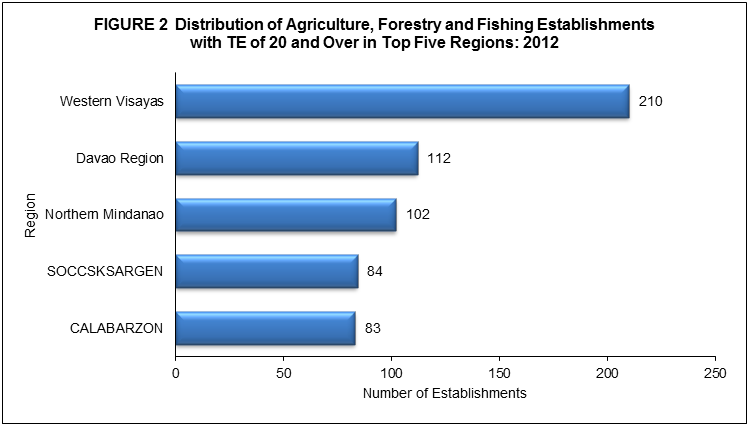
By region, Western Visayas recorded the highest number of agriculture, forestry and fishing establishments with 210 or 24.5 percent of the total. Davao Region followed next with 112 establishments (13.1%). Other leading regions in terms of number of establishments were as follows:
- Northern Mindanao, 102 establishments (11.9%)
- SOCCSKSARGEN, 84 establishments (9.8%)
- CALABARZON, 83 establishments (9.7%)
- Central Luzon, 66 establishments (7.7%)
Figure 2 shows the top regions with the most number of agriculture, forestry and fishing establishments with TE of 20 and over in 2012.
Total employment declines by 2.5 percent
Total employment of agriculture, forestry and fishing establishments with TE of 20 and over reached 124,548 in 2012, a decline of 3,208 workers or 2.5 percent from 127,756 workers recorded in 2010.
As shown in figure 3, four of the seven industries in the sector employed fewer workers in 2012 as compared to 2010. Among these industries, fishing recorded the largest cut in total employment from 15,482 workers in 2010 to 12,956 in 2012 or a decline of 2,526 workers (16.3%). Growing of non-perennial crops also posted a decrease of 750 workers (2.4%) from 31,753 workers in 2010 to 31,003 workers in 2012. Other industries with negative growth in total employment were as follows:
- Silviculture and other forestry activities, and support services to forestry from 928 workers in 2010 to 405 workers in 2012 or 56.4 percent drop
- Aquaculture from 3,475 workers in 2010 to 3,077 workers in 2012 or 11.5 percent drop
Figure 3 shows the comparative distribution of employment for agriculture, forestry and fishing establishments with TE of 20 and over by industry group in 2012 and 2010.

By region, Davao Region emerged as the largest employment generator in 2012 with 31,081 workers or 25.0 percent of the total. This was followed by Western Visayas with 24,169 workers (19.4%) and SOCCSKSARGEN with 16,319 workers (13.1%). Northern Mindanao and NCR came next with 12,836 workers (10.3%) and 11,391 workers (9.1%), respectively.
Among the top five regions, Northern Mindanao registered the largest decrease in total employment with 25.8 percent decline from 17,308 workers in 2010.
The average number of workers per establishment for the sector was recorded at 146, decreasing by 15.1 percent from 172 in 2010.
All the industry groups showed declines in the average number of workers per establishment. Growing of perennial crops which employed the highest average number of workers per establishment, went down by 5.4 percent to 388 workers in 2012 from 410 workers in 2010. Moreover, support activities to agriculture and post-harvest crop activities dropped by 48.8 percent to 123 workers in 2012 from 240 workers in 2010.
Employees in support activities to agriculture and post-harvest crop activities earn the highest average annual compensation
Total compensation paid by the sector to its employees in 2012 amounted to PHP18.5 billion, an increase of 13.6 percent from PHP16.3 billion in 2010.
Among industries, growing of perennial crops paid the highest total compensation of PHP10.3 billion comprising more than half (55.5%) of the total. Support activities to agriculture and post-harvest crop activities followed next with PHP2.6 billion (13.8%). Fishing ranked third with PHP2.2 billion (11.8%).
The sector posted an average annual compensation of PHP149,775 per employee in 2012, higher by 16.6 percent than the previous level of PHP128,444 in 2010. Employees in support activities to agriculture and post-harvest crop activities earned almost twice as much of the sector average in 2012, with an annual compensation of PHP280,331 per employee. Other leading industries in terms of average annual compensation per employee were as follows:
- Growing of perennial crops, PHP184,778
- Fishing, PHP172,277
- Aquaculture, PHP149,495
Figure 4 presents the average annual compensation of employees for agriculture, forestry and fishing establishments with TE of 20 and over by industry group in 2012.

At regional level, National Capital Region (NCR) led the sector with an average annual compensation of PHP292,419 per employee. Caraga and SOCCSKSARGEN followed with respective value of PHP221,033 and PHP216,272.
Value of output increases by 31.2 percent
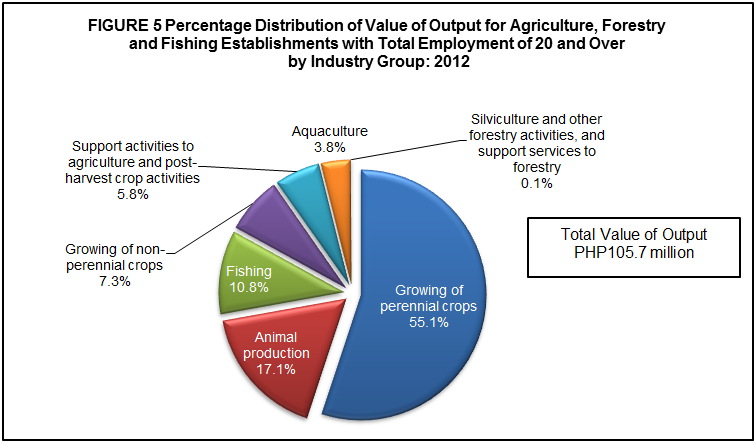
In 2012, the value of output generated by the sector reached PHP105.7 billion, reflecting an increase of 31.2 percent from PHP80.6 billion in 2010.
More than half (55.1%) or PHP58.2 billion of the total value of output in 2012 was generated by establishments engaged in growing of perennial crops, expanding by 55.6 percent from PHP37.4 billion in 2010. This was followed by animal production and fishing with respective shares of PHP18.1 billion (17.1%) and PHP11.4 billion (10.8%). Figure 5 shows the percentage distribution of value of output for agriculture, forestry and fishing establishments with TE of 20 and over by industry group in 2012.
Across the country, combined value of output of the top two regions in 2012 comprised half (51.1%) of the total. Davao Region generated PHP27.3 billion or 25.9 percent, followed by SOCCSKSARGEN which generated an output value of PHP26.7 billion or 25.2 percent of the total. Moreover, Ilocos Region’s value of output of PHP257.4 million and attributing to only 0.2 percent of the total in 2012, surged by 167.9 percent from PHP96.1 million in 2010.
Total expense reaches PHP113.1 billion
Total expense, including compensation, incurred in business operation by agriculture, forestry and fishing establishments with TE of 20 and over amounted to PHP113.1 billion.
Among industries, growing of perennial crops incurred the highest expense amounting to PHP66.1 billion or 58.4 percent. Animal production ranked a far second with PHP17.5 billion (15.5%), followed by fishing with PHP11.6 billion (10.2%).
Agriculture, forestry and fishing establishments located in Mindanao area spent the most in 2012. The following were the top three regions which comprised 68.6 percent of the total expense of the sector:
- Davao Region, PHP29.4 billion (26.0%)
- SOCCSKSARGEN, PHP28.5 billion (25.2%)
- Northern Mindanao, PHP19.8 billion (17.5%)
Value added down by 7.5 percent
In 2012, value added generated by establishments with TE of 20 and over reached PHP24.0 billion, a decrease of 7.5 percent from PHP25.9 billion produced in 2010.
Among industry groups, support activities to agriculture and post-harvest crop activities recorded the highest growth in value added. In 2012, this industry yielded a value added of PHP3.7 billion or an increase of 81.3 percent from PHP2.0 billion in 2010. This was followed by aquaculture and fishing with corresponding value added of PHP1.2 billion and PHP3.9 billion in 2012, higher by 52.6 and 23.7 percent than their respective values in 2010 (Table 1). However, these growths were offset by the decline in value added of other industries in the sector. Among these industries, growing of perennial crops posted a decrease of PHP2.8 billion. Between 2010 and 2012, it decreased by 23.3 percent from PHP12.2 billion to PHP9.3 billion. Likewise, animal production posted the largest percentage decline of 28.2 percent from PHP3.9 billion in 2010 to PHP2.8 billion in 2012.
At the regional level, Davao Region recorded the biggest share to value added amounting to PHP6.0 billion or 25.0 percent of the total, followed by SOCCSKSARGEN with PHP4.9 billion (20.5%) and NCR with PHP 4.6 billion (19.2%). Northern Mindanao came in fourth with PHP2.1 billion (8.7%).
Except for NCR, all these leading regions showed declines in value added, led by Northern Mindanao with a 48.6 percent decrease from PHP4.1 billion in 2010.
Support activities to agriculture and post-harvest crop activities records the highest productivity
Ratio of value added to employment, a simple measure of labor productivity, was recorded at PHP192,548 per worker, a slight decrease of 5.1 percent from PHP202,942 in 2010.
The highest labor productivity among industries was recorded in support activities to agriculture and post-harvest crop activities, valued at PHP396,606 per worker. Aquaculture ranked second with PHP379,795 per worker while fishing came next with PHP301,545 per worker. Figure 6 shows the labor productivity for agriculture, forestry and fishing establishments with TE of 20 and over by industry group in 2012.
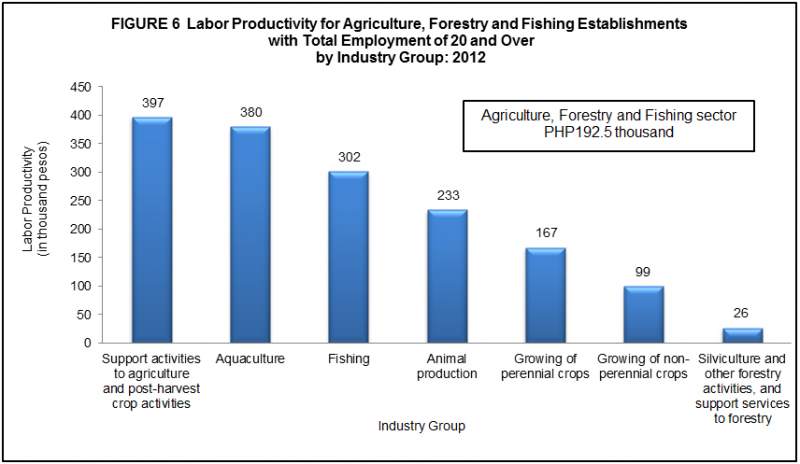
>
Employees in Central Luzon were the most productive in 2012, registering a ratio of PHP501,336. This was followed by employees in NCR and SOCCSKSARGEN with respective productivity of PHP404,430 and PHP301,876 per worker.
Gross addition to tangible fixed assets reaches PHP8.1 billion
Gross addition to tangible fixed assets, defined as capital expenditures less sale of fixed assets, rose by 68.9 percent to PHP8.1 billion in 2012 from PHP4.8 billion in 2010.
Combined data of growing of perennial crops (PHP2.8 billion or 34.8%) and support activities to agriculture and post-harvest crop activities (PHP2.5 billion or 30.5%), accounted for almost two-thirds (65.3%) of the total gross addition to tangible fixed assets.
NCR led all regions with a total value of PHP2.3 billion or 28.3 percent of the total, followed closely by SOCCSKSARGEN with PHP2.2 billion (26.7%). Other regions accounting for the biggest shares were as follows:
- Davao Region, PHP1.4 billion (17.3%)
- Northern Mindanao, PHP800.4 million (9.9%)
- Central Luzon, PHP542.7 million (6.7%)
Total subsidies received amounts to PHP3.5 billion
Subsidies granted by the government to support the business operation of agriculture, forestry and fishing establishments with TE of 20 and over in 2012 amounted to PHP3.5 billion, grew almost five times (469.7%) than PHP619.3 million in 2010.
Support activities to agriculture and post-harvest crop activities received PHP3.5 billion or 98.9 percent of the total subsidies. Other industries that received subsidies in 2012 were as follows:
- Growing of perennial crops, PHP36.8 million (1.0%)
- Growing of non-perennial crops, PHP2.0 million (0.1%)
- Aquaculture, PHP0.2 million (less than 0.1%)
Total assets estimate at PHP168.3 billion
In 2012, total assets for the sector was valued at PHP168.3 billion.
Among industries, support activities to agriculture and post-harvest crop activities and growing of perennial crops led the sector in terms of ownership of total assets with PHP63.7 billion (37.8%) and PHP62.2 billion (37.0 %).
At regional level, the top five regions were as follows:
- NCR, PHP66.0 billion (39.2%)
- Davao Region, PHP28.7 billion (17.0%)
- SOCCSKSARGEN, PHP28.5 billion (17.0%)
- Northern Mindanao, PHP17.3 billion (10.3%)
- Western Visayas, PHP6.4 billion (3.8%)
TECHNICAL NOTES
Introduction
This Special Release presents the preliminary results of the 2012 Census of Philippine Business and Industry (CPBI) for the Agriculture, Forestry and Fishing Sector for establishments with total employment of 20 and over.
The 2012 CPBI is a forerunner of the 2006 CPBI and one of the designated statistical activities of the former National Statistics Office (NSO) now Philippine Statistics Authority (PSA). Data collected from the census provide information on the levels, structure, performance, and trends of economic activities of the country. It also serves as benchmark information in the measurement and comparison of national and regional economic growth.
The census was conducted nationwide in April 2013 with the year 2012 as the reference period of data, except for employment which is as of November 15, 2012.
The income and expense account in the Financial Statement of establishment was adopted in the design of sectoral questionnaires to capture data for the 2012 CPBI. This allowed respondents of the census an ease in accomplishing the questionnaires. Income and revenue have the same concept in recording financial transaction of establishments while expense is cost incurred on a consumed basis.
Data are presented at the national, regional and industry group or 3-digit 2009 Philippine Standard Industrial Classification (PSIC).
Legal Authority
The conduct of the CPBI is governed by authority of the following legislative acts and presidential directives:
- Commonwealth Act No. 591 (An Act to Create the Bureau of the Census and Statistics to consolidate statistical activities of the government therein)
- Presidential Decree No. 418 (Reconstituting the Bureau of the Census and Statistics as a new agency to be known as the National Census and Statistics Office, under the administrative supervision of the National Economic Development Authority)
- Executive Order No. 121 (Reorganization Act of the Philippine Statistical System)
- Executive Order 352 (Designation of Statistical Activities that will generate critical data for decision-making by the Government and the Private Sector)
- Executive Order 5 (Strengthening the National Statistics Office)
Scope and Coverage
The 2012 CPBI covered establishments engaged in 18 economic sectors classified under the 2009 PSIC, namely:
- Agriculture, Forestry, and Fishing (A)
- Mining and Quarrying (B)
- Manufacturing (C)
- Electricity, Gas, Steam, and Air Conditioning Supply (D)
- Water Supply; Sewerage, Waste Management and Remediation Activities (E)
- Construction (F)
- Wholesale and Retail Trade; Repair of Motor Vehicles and Motorcycles (G)
- Transportation and Storage (H)
- Accommodation and Food Service Activities (I)
- Information and Communication (J)
- Financial and Insurance Activities (K)
- Real Estate Activities (L)
- Professional, Scientific and Technical Activities (M)
- Administrative and Support Service Activities (N)
- Education (P)
- Human Health and Social Work Activities (Q)
- Arts, Entertainment, and Recreation (R)
- Other Service Activities (S)
The census was confined to the formal sector of the economy, which consists of the following:
- Corporations and partnership
- Cooperatives and foundations
- Single proprietorship with employment of 10 and over
- Single proprietorships with branches
Unit of Enumeration
The units of enumeration for the 2012 CPBI are the establishment and enterprise. However, this special release is confined to the results of agriculture, forestry and fishing sector with establishment as the unit of enumeration.
An establishment is defined as an economic unit under a single ownership or control which engages in one or predominantly one kind of activity at a single fixed location.
Classification of Establishent
An establishment is categorized by its economic organization, legal organization, industrial classification, employment size, and geographic location.
Economic Organization refers to the organizational structure or role of the establishment in the organization. An establishment may be single establishment, branch, establishment and main office with branches elsewhere, main office only, and ancillary unit other than main office.
Legal Organization refers to the legal form of the economic entity which owns the establishment. An establishment may be single proprietorship, partnership, government corporation, stock corporation, non-stock corporation, and cooperative.
The industrial classification of an economic unit was determined by the activity from which it derives its major income or revenue. The 2009 PSIC was utilized to classify economic units according to their economic activities.
The size of an establishment is determined by its total employment (TE) as of a specific date.
Geographic Classification. Establishments are also classified by geographic area using the Philippine Standard Geographic Code (PSGC) classification.
Methodology
Establishments with TE of 20 and over in the formal sector for the Agriculture, Forestry and Fishing Sector were covered on a 100 percent or on a certainty basis because of their relatively small number.
The estimate of the total of a characteristic  for the certainty employment stratum in TE of 20 and over in an industry domain in each geographic domain (region) is
where:
National level estimate of a characteristics by industry domain  was obtained by aggregating separately the estimates
  for the particular industry domain from all the regions.

Response Rate
Response rate for Agriculture, Forestry and Fishing Sector for establishments with TE of 20 and over was 89.41 percent (1,216 out of 1,360 establishments). This included receipts of "good" questionnaires, partially accomplished questionnaires, reports of closed, moved out or out of scope establishments.
Reports of the remaining non-reporting establishments were imputed based on established imputation methods and from other available administrative data sources. However, reports of establishments which were found to be duplicates and out of business in 2012, were not imputed.
Limitation of Data
The 2012 CPBI covered only the formal sector of the economy.
Data for the following industries and regions were subjected to statistical disclosure control to ensure confidentiality of individual establishment’s data:
- Silviculture and other forestry activities
- Support services to forestry
- Cordillera Administrative Region
- Cagayan Valley
Concepts and Definitions of Terms
Economic activity is the establishment’s source of income. If the establishment is engaged in several activities, its main economic activity is that which earns the biggest income or revenue.
Total employment is the number of persons who worked in for the establishment as of November 15, 2012.
Paid employees are all persons working in the establishment and receiving pay, as well as those working away from the establishment paid by and under the control of the establishment. Included are all employees on sick leave, paid vacation or holiday. Excluded are consultants, home workers, receiving pure commissions only, and workers on indefinite leave.
Compensation includes salaries and wages, separation/retirement/terminal pay, gratuities, and payments made by the employer in behalf of the employees such as contribution to SSS/GSIS, ECC, PhilHealth, Pag-ibig, etc.
Salaries and wages are payments in cash or in kind to all employees, prior to deductions for employee’s contributions to SSS/GSIS, withholding tax, etc. Included are total basic pay, overtime pay and other benefits.
Income or Revenue refers to cash received and receivables for goods/products and by-products sold and services rendered.
E-commerce refers to the selling of products or services over electronic systems such as Internet Protocol-based networks and other computer networks. Electronic Data Interchange (EDI) network, or other on-line system. Excluded are orders received from telephone, facsimile and e-mails.
Cost refers to all expenses incurred during the year whether paid or payable. Valuation is at purchaser prices including taxes and other charges, net of rebates, returns and allowances. Goods and services received by the establishment from other establishments of the same enterprise are valued as though purchased.
Expense refers to cost incurred by the establishment during the year whether paid or payable. This is treated on a consumed basis.
Intermediate expense are expenditures incurred in the production of goods such as materials and supplies purchased, fuels purchased, electricity and water purchased, agricultural/forestry/fishery and industrial services done by others plus beginning inventory of materials, supplies and fuels less ending inventory of materials, supplies and fuels.
Value added is gross output less intermediate cost. Gross output for the agriculture, forestry and fishing sector is value of output plus non-industrial services done for others (except rent income from land). Intermediate input is intermediate expenses plus non-industrial services done by others (except rent expense for land) and other costs.
Value of output represents the sum of the receipts from products and by-products sold, agricultural/forestry/fishery services rendered, industrial services, and goods sold in the same condition as purchased less the cost of goods sold; and value of fixed assets produced on own account and change in inventories of finished products and work-in-progress.
Gross addition to tangible fixed assets is equal to capital expenditures less sale of fixed assets, including land.
Change in inventories is equivalent to the value of inventories at the end of the year less the value of inventories at the beginning of the year.
Inventories refer to the stock of goods owned by and under the control of the establishment as of a fixed date, regardless of where the stocks are located. Valuation is at current replacement cost in purchaser prices. Replacement cost is the cost of an item in terms of its present price rather than its original cost.
Subsidies are all special grants in the form of financial assistance or tax exemption or tax privilege given by the government to aid and develop an industry.
Total assets are resources including land owned and/or controlled by the establishment as a result of past transactions and events from which future economic benefits are expected to flow to the establishment.