
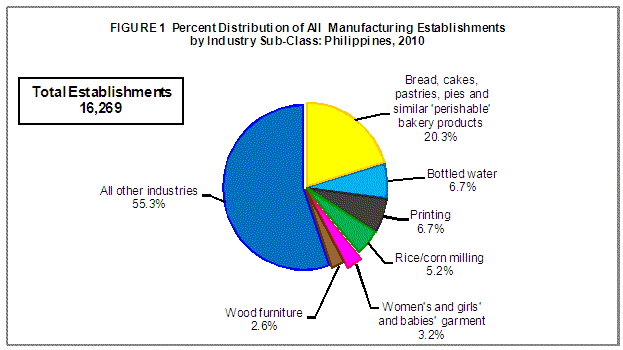
Total number of all manufacturing establishments reaches 16,269 in 2010
The total number of all manufacturing establishments in the formal sector of the economy was estimated at 16,269, according to the final results of the 2010 Annual Survey of Philippine Business and Industry.
Among the industry sub-classes, the top ten manufacturing industries accounted for more than half (52.2%) of all manufacturing establishments. Bread, cakes, pastries, pies and similar "perishable" bakery products registered the highest number with 3,308 establishments or 20.3 percent of the total. Bottled water and printing ranked second with 1,090 establishments each.
Completing the top ten industries are:
- Rice/corn milling (841 establishments)
- Women's and girls' and babies' garment (526 establishments)
- Wood furniture (424 establishments)
- Repair of machinery (409 establishments)
- Plastic articles for packing goods (290 establishments)
- Structural concrete products (267 establishments)
- Custom tailoring (260 establishments)
Figure 1 shows the percent distribution of all manufacturing establishments by industry sub-class in 2010.
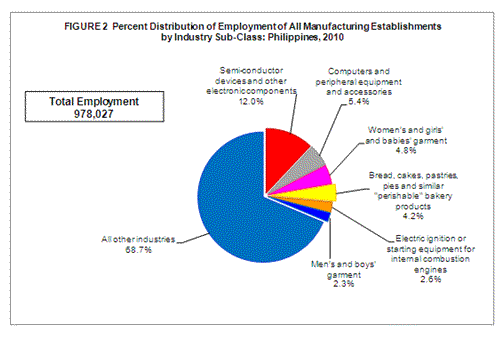
Semi-conductor devices and other electronic components industry employs the highest number of workers
Total employment generated by all manufacturing establishments reached 978,027 in 2010. Of this, 968,671 (99.0%) were paid employees while the rest were working owners and unpaid workers.
Industrywise, industries comprising the top ten slots in terms of employment generation accounted for 39.6 percent (388,253 workers) of the total workforce in all manufacturing establishments. Semi-conductor devices and other electronic components industry employed the highest number of workers with 117,346. This was followed by computers, computer peripheral equipment and accessories industry with 53,182 workers.
Other industries comprising the top ten slots in terms of employment generation are:
- Women's and girls' and babies' garment (46,871 workers)
- Bread, cakes, pastries, pies and similar "perishable" bakery products (41,169 workers)
- Electric ignition or starting equipment for internal combustion engines (25,605 workers)
- Men's and boys' garment (22,327 workers)
- Building of ships and boats other than sports and pleasure boats (21,815 workers)
- Printing (21,024 workers)
- Parts and accessories for motor vehicles (19,835 workers)
- Plastic articles for packing goods (19,079 workers).
Figure 2 shows the percent distribution of employment of all manufacturing establishments by industry sub-class in 2010.
Refined petroleum and other fuel products industries pay the highest average annual compensation
In 2010, total compensation paid to employees by all manufacturing establishments amounted to PHP204.1 billion or equivalent to an average annual compensation of PHP210,651 per employee.
Among industry sub-classes, refined petroleum and other fuel products industries paid the highest average annual compensation of PHP1.6 million per paid employee. This was followed closely by butter, cheese, and curd with average annual compensation of PHP1.2 million.
The following table shows the 14 other industries with an average annual compensation reaching more than half a million.
Table 1 Average Annual Compensation of Employees in Top-Paying Manufacturing Establishments
by Industry Sub-Class: Philippines, 2010
|
2009 PSIC Code |
Industry Description |
Average Annual Compensation per Employee (In PHP1,000) |
|---|---|---|
|
C20112 |
Industrial (compressed and liquefied) gases |
868.6 |
|
C10530 |
Infants' powdered milk |
809.9 |
|
C10560 & C10590 |
Milk-based infants' and dietetic foods and dairy products, n.e.c. |
804.6 |
|
C10797 |
Mayonnaise, salad dressing, sandwich spread and similar products |
787.6 |
|
C23940 |
Cement |
682.6 |
|
C30300 |
Air and spacecraft and related machinery |
642.4 |
|
C11030 |
Malt liquors and malt |
628.2 |
|
C20117 |
Organic acids and organic compounds |
614.2 |
|
C10622 |
Flour milling except cassava flour milling |
556.3 |
|
C28120 |
Fluid power equipment |
543.2 |
|
C10796 |
Flavoring extracts and food coloring |
524.5 |
|
C21001 |
Drugs and medicines including biological products such as bacterial and virus vaccines, sera and plasma |
511.3 |
|
C27122 |
Electricity distribution equipment |
508.3 |
|
C23102 |
Glass containers |
505.1 |
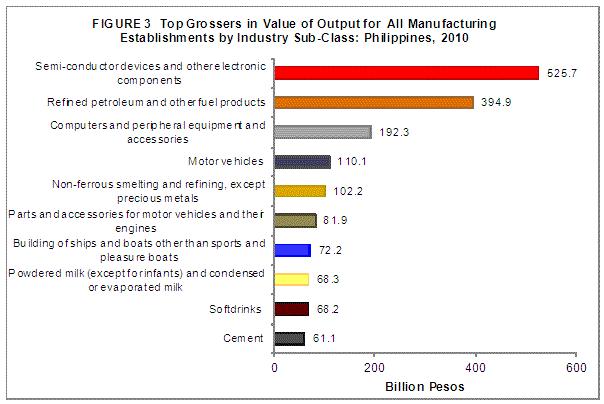
Semi-conductor devices and other electronics components industry leads in value of output
Value of output of all manufacturing establishments was estimated at PHP3.6 trillion in 2010.
More than half (51.4%) of the total value of output of all manufacturing establishments was contributed by 13 industries led by semi-conductor devices and other electronic components with an output share of 14.7 percent (PHP525.7 billion). Refined petroleum and other fuel products ranked second in terms of value of output with a combined share of 11.0 percent (PHP394.9 billion). Rounding up the 13 contributors to more than half of the total value of output are the following:
- Computers and peripheral equipment and accessories (5.4%)
- Motor vehicles (3.1%)
- Non-ferrous smelting and refining, except precious metals (2.9%)
- Parts and accessories for motor vehicles (2.3%)
- Building of ships and boats other than sports and pleasure boats (2.0%)
- Powdered milk (except for infants) and condensed or evaporated milk (1.9%)
- Soft drinks (1.9%)
- Cement (1.7%)
- Prepared animal feeds (1.6%)
- Electric ignition or starting equipment for internal combustion engines (1.5%)
- Drugs and medicines including biological products such as bacterial and virus vaccines, sera and plasma (1.4%)
Figure 3 shows the top ten industries that generated the highest value of output for all manufacturing establishments in 2010.
Refined petroleum and other fuel products industries lead the top contributors to value added
Value added generated by all manufacturing establishments reached PHP1.0 trillion in 2010.
Among industries, the top ten industries comprised 52.6 percent of the total value added of the manufacturing sector. Refined petroleum and other fuel products led the top contributors to value added with a combined value of PHP192.4 billion or 18.7 percent of the total. Semi-conductor devices and electronic components ranked second with PHP115.7 billion or 11.2 percent of the total value added.
The ratio of value added to total employment, or a simple measure of total productivity, was recorded at PHP1.1 million.
Table 2 shows the most labor productive manufacturing industries in 2010 that exceeded a total productivity of PHP5.0 million.
Table 2 Most Labor Productive Industries for All Manufacturing Establishments
by Industry Sub-Class: Philippines, 2010
|
2009 PSIC Code |
Industry Description |
Value Added per Total Employment (In PHP1,000) |
|
|---|---|---|---|
|
C19200 & C19900 |
Refined petroleum and other fuel products |
106,420.1 |
|
|
C10520 |
Powdered milk (except for infants) and condensed or evaporated milk (filled, combined or reconstituted) |
13,444.0 |
|
|
C24220 |
Non-ferrous smelting and refining , except precious metals |
10,326.9 |
|
|
C11030 |
Malt liquors and malt |
6,813.0 |
|
|
C23940 |
Cement |
6,704.8 |
|
|
C20231 |
Soap and detergents |
6,496.5 |
|
|
C11010 |
Distilling, rectifying and blending of spirits |
6,365.9 |
|
|
C24210 |
Gold and other precious metal refining |
6,037.1 |
|
|
C10530 |
Infants' powdered milk |
5,851.5 |
|
|
C10450 |
Refined coconut and other vegetable oil (including corn oil) and margarine |
5,826.3 |
|
|
C20117 |
Organic acids and organic compounds |
5,778.9 |
|
|
C10797 |
Mayonnaise, salad dressing, sandwich spread and similar products |
5,705.9 |
|
|
C10622 |
Flour milling except cassava flour milling |
5,467.4 |
|
Gross addition to tangible assets reaches PHP88.3 billion in 2010
In 2010, the gross addition to tangible fixed assets of all manufacturing establishments reached PHP88.3 billion.
Semi-conductor devices and electronic components recorded the highest gross addition at PHP33.2 billion or 37.6 percent of the total. Refined petroleum and other fuel products industries followed as a far second with PHP6.5 billion (7.4%).
Spinning and texturizing industries receive PHP204.3 million worth of subsidies
Subsidies received from the government by all manufacturing establishments amounted to PHP645.1 million in 2010.
Among industry sub-classes, spinning and texturizing industries received PHP204.3 million worth of subsidies. Semi-conductor devices and electronic components industry followed with PHP33.0 million, while plastic articles for packing goods posted PHP21.9 million.
TECHNICAL NOTES
Introduction
The Special Release presents the final results of the 2010 Annual Survey of Philippine Business and Industry (ASPBI) for all manufacturing establishments.
As one of the designated statistical activities of the National Statistics Office (NSO), the 2010 ASPBI is aimed at collecting and generating information on the levels, structures and trends of economic activities in the country.
The survey was conducted nationwide in April 2011 with the year 2010 as the reference period of data, except for employment which is as of November 15, 2010. The 2009 Philippine Standard Industrial Classification (2009 PSIC) was adopted for the first time in this survey.
Data are presented at the national and industry sub-class or 5-digit 2009 PSIC.
Legal Authority
The conduct of 2010 ASPBI is authorized under the following legislative acts and presidential directives:
- Commonwealth Act 591
- Presidential Decree No. 418
- Executive Order No. 121
- Executive Order No. 352
- Executive Order No. 5
Scope and Coverage
The 2010 ASPBI covered establishments engaged in 18 economic sectors classified under the 2009 PSIC, namely:
- Agriculture, Forestry and Fishing (A)
- Mining and Quarrying (B)
- Manufacturing (C)
- Electricity, Gas, Steam, and Air Conditioning Supply (D)
- Water Supply; Sewerage, Waste Management and Remediation Activities (E)
- Construction (F)
- Wholesale and Retail Trade; Repair and Maintenance of Motor Vehicles, Motorcycles (G)
- Transportation and Storage (H)
- Accommodation and Food Service Activities (I)
- Information and Communication (J)
- Financial and Insurance Activities (K)
- Real Estate Activities (L)
- Professional, Scientific and Technical Activities (M)
- Administrative and Support Service Activities (N)
- Education (P)
- Human Health and Social Activities (Q)
- Arts, Entertainment and Recreation (R)
- Other Service Activities (S)
The survey was confined to the formal sector of the economy, which consists of the following:
- Corporations and partnership
- Cooperatives and foundations
- Single proprietorship with employment of 10 and over
- Single proprietorships with branches
Unit of Enumeration
Like all other establishments surveys conducted by the NSO, the 2010 ASPBI unit of enumeration is the establishment. The establishment is defined as an economic unit under a single ownership or control which engages in one or predominantly one kind of activity at a single fixed location.
Methodology
Sampling Design
The survey utilized stratified sampling with five-digit PSIC serving as the first stratification variable and total employment as the second stratification variable.
Estimation Procedure
For Establishments with TE of Less Than 20
- Non-certainty Stratum
The estimate of the total of a characteristic ( ) for the non-certainty employment stratum TE less than 20 in the sth industry domain is
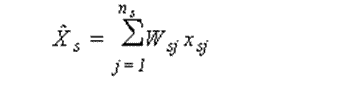
where:
s = denotes the non-certainty employment strata in TE of less than 20
xsj = value of the jth establishment in the non-certainty employment stratum in TE of less than 20 in the sth industry domain
j = 1, 2, 3, …, ns establishments
Wsj = weight of the jth establishment in the non-certainty employment stratum in TE of less than 20 in the sth industry domain

Ns = total number of establishments in the non-certainty employment stratum in TE of less than 20 in the sth industry domain
ns = number of sample establishments in the non-certainty employment stratum in TE of less than 20 in the sth industry domain
- Certainty Stratum
The estimate of the total of a characteristic ( ) for the certainty employment stratum in the cth industry domain is
where:
c denotes the certainty employment strata in TE of less than 20 in the cth industry domain
xcj = value of the jth establishment in the certainty employment strata in
TE of less than 20 in the cth industry domain
j = 1, 2, 3, …, mc establishments
mc = number of establishments in the certainty employment strata in TE of less than 20 in the cth industry domain
Total Estimate for TE of Less Than 20
National level estimates of the total of a characteristic ( ) for the industry domain was obtained by aggregating the estimates for all employment strata (non-certainty and certainty) in the same industry domain,
where d denotes the industry domain
For Establishments with TE of 20 and Over
- Non-Certainty Stratum (strata of TE of 20 to 49 and TE of 50 to 99)
The estimate of the total of a characteristic ( ) for the non-certainty employment strata in TE of 20 and over for an industry domain in each region (geographic domain) is
where:
s denotes the non-certainty employment strata in TE of 20 and over
p = 1, 2,..., 17 regions (geographic domains)
xspj = value of the jth establishment in the non-certainty employment strata in TE of 20 and over for an industry domain in each region
j = 1, 2, 3,…, nsp establishments
= weight of the jth establishment in the non-certainty employment strata in TE of 20 and over for an industry domain in each region
Nsp = total number of establishments in the non-certainty employment strata in TE of 20 and over for an industry domain in each region
nsp = number of sample establishments in the non-certainty employment strata in TE of 20 and over for an industry domain in each region
- Certainty Stratum
The estimate of the total of a characteristic ( ) for the certainty employment stratum in TE of 20 and over in an industry domain in each geographic domain (region) is
where:
c denotes the certainty employment strata in TE of 20 and over
p = 1, 2,..., 17 regions (geographic domains)
xcpj = value of the jth establishment in the certainty employment strata in TE of 20 and over in an industry domain within each region
j = 1, 2, 3, …, mcp establishments
mcp = number of establishments in the certainty employment strata in TE of 20 and over in an industry domain within each region
Total Estimate for TE of 20 and Over
The estimate of the total of a characteristic ( ) for the industry domain in each region (geographic domain) was obtained by aggregating the estimates for all employment strata (non-certainty and certainty) in the same industry domain,
where dp denotes the industry domains in each region
National level estimates of the characteristics by industry domain were obtained by aggregating separately the estimates ( ) for the particular industry domain from all the regions.
Weight Adjustment Factor for Non-Response
To account for non-response in the non-certainty strata, the adjustment factors, and (n/n’) was multiplied with the sampling weight (W) of each of the sampling unit. The sampling weight which is defined as N/n was recomputed as
Thus, the adjusted weight (W’sj) for employment stratum in TE of 1-9 or 10-19 is
where:
For the non-certainty employment stratum in TE of 20-49 or 50-99, the adjusted weight (W’spj) is
where:
Nsp = total number of establishments in the non-certainty employment stratum in TE of 20-49 or 50-99 for an industry domain within each geographic domain (region)
n’sp = number of responding establishments in the non-certainty employment stratum in TE of 20-49 or 50-99 for an industry domain within each geographic domain (region)
Response Rate
The overall response rate is 95.4 percent. For establishments with TE of 20 and over, the response rate is 95.0 percent while for establishments with TE of less than 20, 96.1 percent. These include receipts of “good” questionnaires, partially accomplished questionnaires, reports of closed, moved out or out of scope establishments, etc.
Reports of the remaining non-reporting establishments were imputed based on established imputation methods and from other available administrative data sources. However, reports of establishments in the certainty stratum, which were found to be duplicates and out of business in 2010, were not imputed.
Limitation of Data
Only the formal sector was covered in the survey.
Some industries are combined with other related industry/ies so as not to disclose individual establishment’s data. In the table presented, there are 64 industry sub-classes combined to form 29 groups in order not to reveal firm level data.
Concepts and Definitions of Terms
Establishment is an economic unit under a single ownership control, i.e., under a single entity, engaged in one or predominantly one kind of economic activity at a single fixed location.
Total employment is the number of persons who worked in for the establishment as of November 15, 2010.
Paid employees are all persons working in the establishment and receiving pay, as well as those working away from the establishment paid by and under the control of the establishment. Included are all employees on sick leave, paid vacation or holiday.
Excluded are consultants, home workers, receiving pure commissions only and workers on indefinite leave.
Unpaid workers are persons working for at least one-third of the working time normal to the establishment and do not receive regular pay.
Compensation is the sum of salaries and wages, separation, terminal pay and gratuities paid by the establishment to its employees and total employer’s contribution to SSS/GSIS, ECC, PhilHealth, PAG-IBIG etc.
Revenue includes cash received and receivables for goods/products and by-products sold and services rendered. Valuation is at producer prices (ex-establishment) net of discounts, and allowances, including duties and taxes but excluding subsidies.
Cost refers to all expenses incurred during the year whether paid or payable. Valuation is at purchasers price including taxes and other charges, net of rebates, returns and allowances. Goods and services received by the establishment from other establishments of the same enterprise are valued as though purchased
Value of output represents the sum of the value of products and by-products sold, receipt from industrial services done for others, receipts from goods sold in the same condition as purchased less cost of goods sold, fixed assets produced on own account, and change in inventories of finished products and work-in-progress.
Intermediate cost refers to expenses incurred in the production of goods and industrial services such as materials and supplies purchased, fuels purchased, electricity purchased and industrial services done by others plus beginning inventory of materials, supplies and fuels less ending inventory of materials, supplies and fuels.
Value added is gross output less intermediate input. Gross output for the manufacturing sector is value of output plus industrial services done for others. Intermediate input is intermediate cost plus non-industrial services done by others and all other cost.
Gross addition to fixed assets is equal to capital expenditures less sale of fixed assets, including land.
Change in total inventories is computed as the total value of ending inventory less the total beginning inventory.
Subsidies are all special grants in the form of financial assistance or tax exemption or tax privilege given by the government to aid and develop an industry.
| Attachment | Size |
|---|---|
|
|
155.58 KB |
|
|
283.72 KB |