Seasonally Adjusted Value of Exports and Imports of the Philippines: March 2024 (Preliminary)
1. EXPORTS
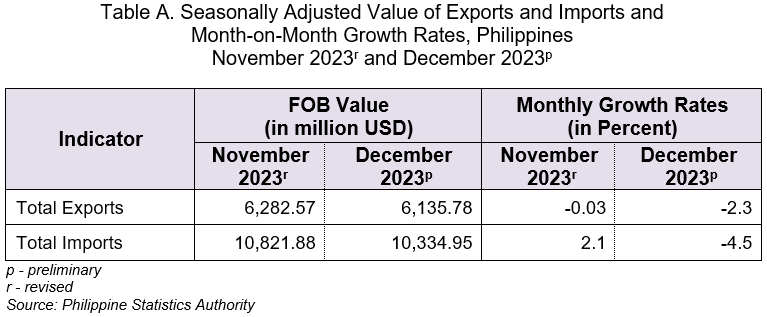
The value of seasonally adjusted total exports amounted to USD 6.14 billion in December 2023. This indicates a monthly drop of 2.3 percent from the deseasonalized total exports value of USD 6.28 billion in November 2023. (Figure 1, and Tables A and 1)
Similarly, the seasonally adjusted export value of manufactured goods amounting to USD 4.99 billion registered a monthly decline of 1.8 percent in December 2023 from the USD 5.08 billion export value in November 2023. Mineral products with seasonally adjusted export value amounting to USD 594.61 million also posted a monthly decrease of 8.4 percent from the USD 648.85 million export value in November 2023.
On the other hand, the seasonally adjusted export sales from total agro-based products, which was recorded at USD 428.34 million, registered a monthly increment of 3.4 percent during the month from the deseasonalized export value of USD 414.30 million in the previous month.
The seasonal factors, such as the degree of demand for selected major types of goods during the period, pulled down the total value of exports and export values of total agro-based products, mineral products, and manufactured goods. (Table 1)
The rest of the major types of goods, including forest products and petroleum products have no seasonality.

2. IMPORTS
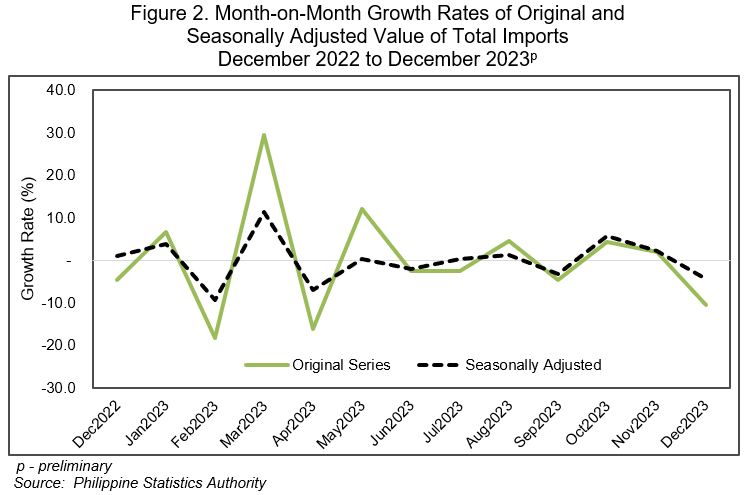
The value of seasonally adjusted total imports in December 2023 amounted to USD 10.33 billion. This represents a monthly decrease of 4.5 percent from the USD 10.82 billion total import value in November 2023. (Figure 2, and Tables A and 2)
Similarly, the seasonally adjusted import value of consumer goods recorded at USD 2.14 billion posted a monthly drop of 0.9 percent in December 2023 from its USD 2.16 billion import value in November 2023. Raw materials and intermediate goods with USD 3.85 billion import value registered a monthly decline of 0.5 percent from its USD 3.87 billion import value in November 2023. Capital goods with seasonally adjusted import value amounting to USD 2.95 billion also posted a monthly decrement of 0.2 percent from its USD 2.96 billion import value in November 2023.
The seasonal factors, such as the degree of demand for selected major types of goods during the period, pulled down the total value of imports and import values of capital goods, raw materials and intermediate goods, and consumer goods. (Table 2)
Mineral fuels, lubricants and related materials has no seasonality.
CLAIRE DENNIS S. MAPA, PhD
Undersecretary
National Statistician and Civil Registrar General
Technical Notes
The Monthly International Merchandise Trade Statistics (IMTS) or Foreign Trade Statistics generates the original series of the Total Exports and Total Imports. IMTS is compiled to serve the needs of many users including the government; the business community; compilers of other economic statistics, such as balance of payments and national accounts; various regional, supranational, and international organizations; researchers; and the public at large.
This special release features the seasonally adjusted IMTS using X-13 Auto-Regressive Integrated Moving Average (ARIMA) under the X-13-ARIMA-SEATS method, which uses the X-11 filter for seasonal adjustment of JDemetra+. The seasonally adjusted series show the trend of value of total exports and imports and selected major type of goods without the effects of seasonal factors.
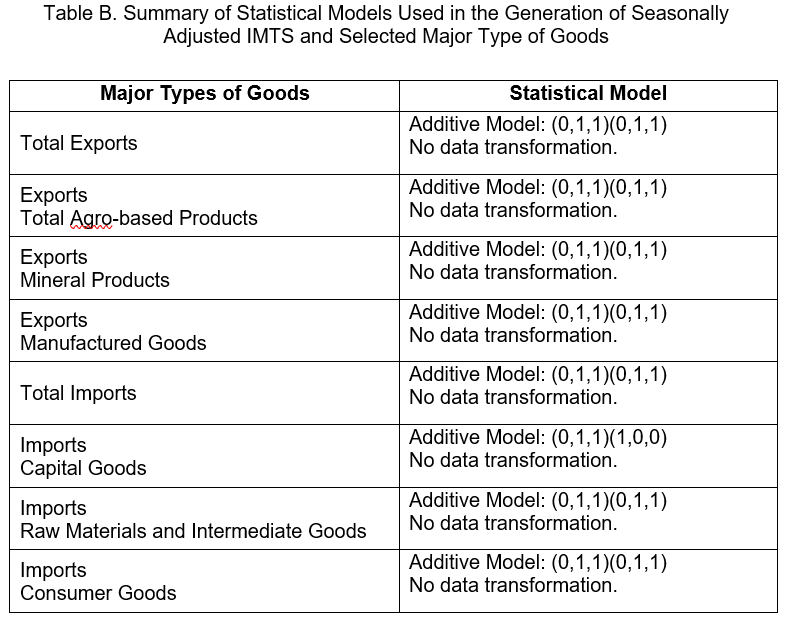
The decomposition model chosen for the seasonal adjustment for each value is shown below.