
PRODUCTION
Value of Production registered two-digit decrement
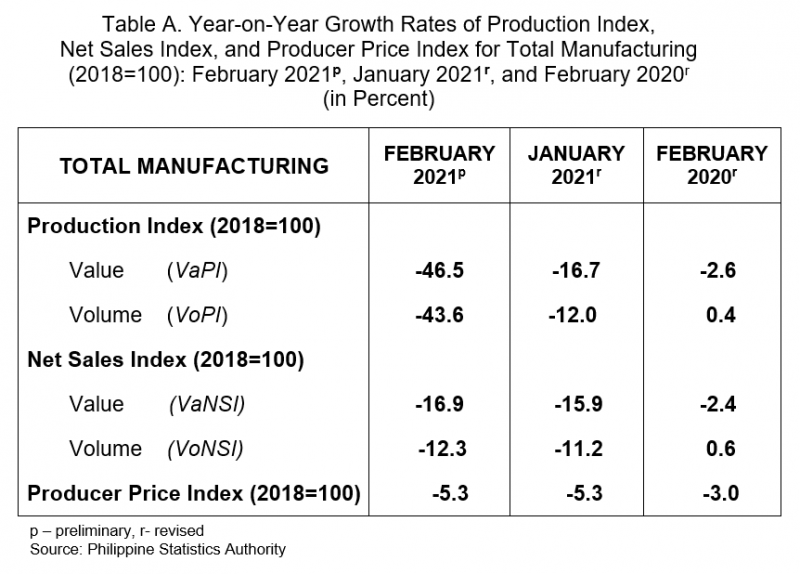
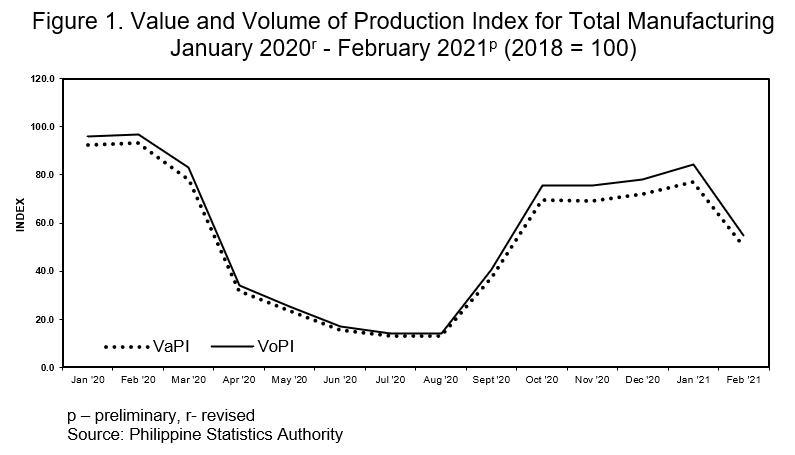
The Value of Production Index (VaPI) for manufacturing posted a downturn in February 2021 with an annual rate of -46.5 percent, from its previous month’s annual drop of -16.7 percent. The February 2021 figure was the fastest decline since October 2020. In February 2020, the annual decrease of VaPI was recorded at -2.6 percent. (Tables A and 1)
The decline in VaPI for manufacturing sector in this period was due to the negative annual growth rates in the indices of 20 out of 22 industry divisions. Of these, manufacture of coke and refined petroleum products was the major contributing factor with -89.3 percent decline. (Tables 1-A and 1)
Volume of Production Index dropped
The Volume of Production Index (VoPI), likewise, continued to drop at an annual rate of -43.6 percent in February 2021. This decline was faster than the -12.0 percent decrease registered in the previous month. In contrast, the annual rate for VoPI in February 2020 increased by 0.4 percent. (Tables A and 2)
The downturn in VoPI was brought about by the contractions in the indices of 19 industry divisions. Among these, the top contributor was manufacture of coke and refined petroleum products (-85.4%). (Tables 1-B and 2)
NET SALES
Value of Net Sales Index further declined
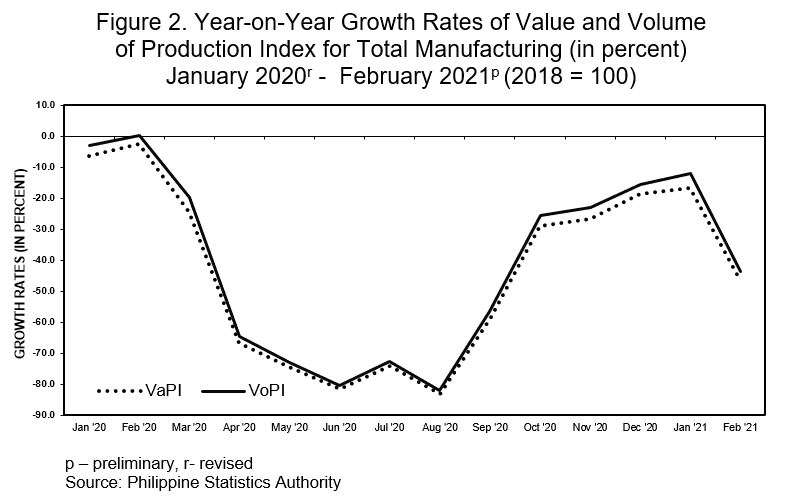
The Value of Net Sales Index (VaNSI) reflected an annual decline of -16.9 percent in February 2021. This decline was faster than the reported decreases in the previous month at -15.9 percent and in February 2020 at -2.4 percent. The decline in February 2021 was the 21st consecutive month of decrease for VaNSI. (Tables A and 3)
Contributory to the faster decline of VaNSI for manufacturing sector in February 2021 were the reductions in the indices of 17 out of the 22 industry divisions. The top three in terms of rate of annual decrease were manufacture of machinery and equipment except electrical (-53.7%), other manufacturing and repair and installation of machinery and equipment (-36.5%), and manufacture of tobacco products (-36.3%). (Tables 2-A and 3)
Volume of Net Sales Index also at a downtrend
The Volume of Net Sales Index (VoNSI) in February 2021, likewise, contracted at a faster rate of -12.3 percent compared with its -11.2 percent decrease in January 2021. In February 2020, a slight annual increase of 0.6 percent was observed. (Tables A and 4)
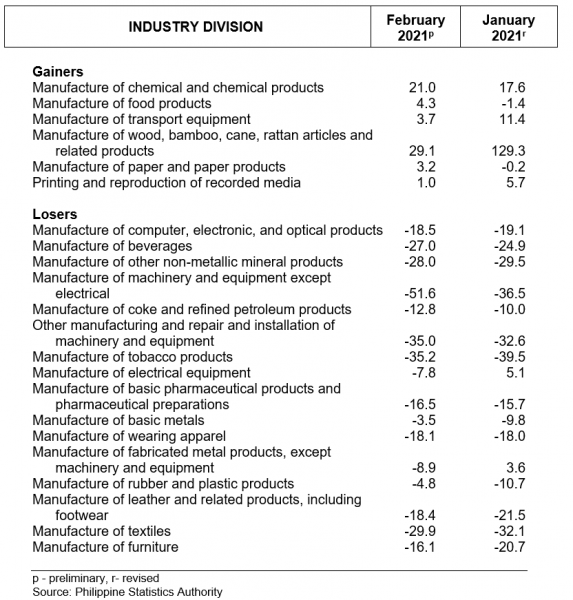
Out of the 22 industry divisions of manufacturing, 16 industry divisions posted negative growth rates in VoNSI. The top three in terms of rate of annual decline were manufacture of machinery and equipment except electrical (-51.6%), manufacture of tobacco products (-35.2%), and other manufacturing and repair and installation of machinery and equipment (35.0%). (Tables 2-B and 4)
CAPACITY UTILIZATION
Average capacity utilization rate for manufacturing slightly decreased
Based on responding establishments, the average capacity utilization rate for the manufacturing sector in February 2021 was posted at 53.8 percent from 56.7 percent in the previous month.
Fifteen (15) of the 22 industry divisions had at least 50 percent average capacity utilization rate, which were led by manufacture of furniture (72.7%), other manufacturing and repair and installation of machinery and equipment (65.0%), and manufacture of computer, electronic, and optical products (63.8%). (Table 6)
More than half of responding establishments operated below seventy percent capacity
The proportion of establishments that operated below 70 percent capacity was more than half (62.5%) of the total number of responding establishments. One-fourth operated at 70 to 89 percent capacity and only 12.5 percent operated at full capacity (90% to 100%). (Table B)
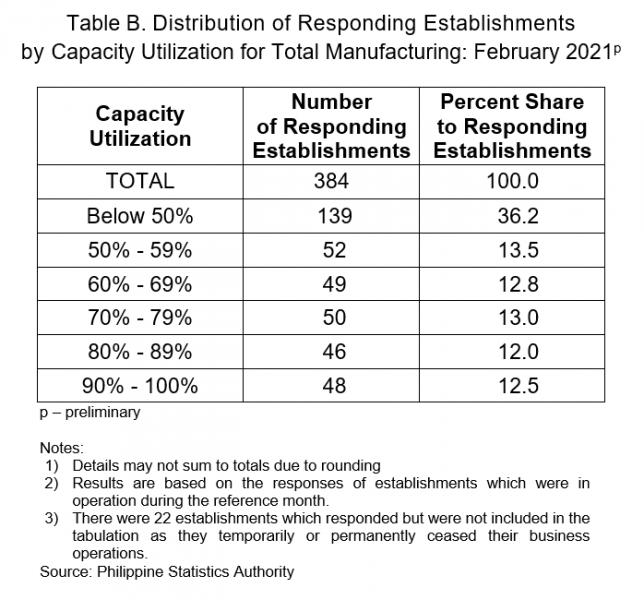
TABLE 1-A. Year-on-Year Growth Rate (%) of Value of Production Index
by Industry Division: February 2021p and January 2021r
(2018 = 100)
by Industry Division: February 2021p and January 2021r
(2018 = 100)
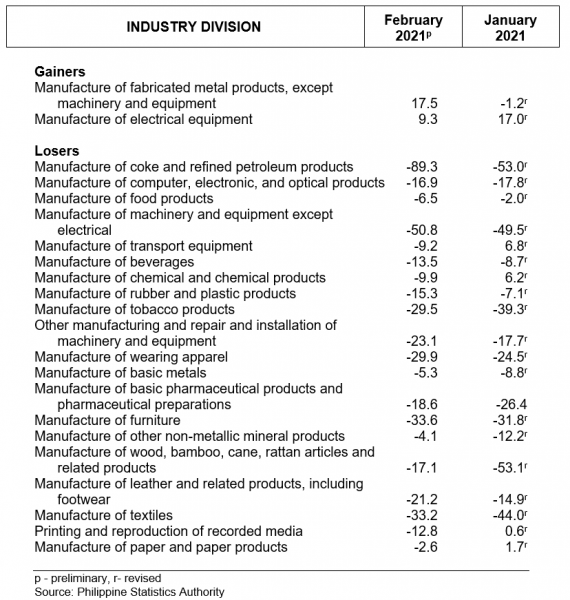
TABLE 1-B. Year-on-Year Growth Rate (%) of Volume of Production Index
by Industry Division: February 2021p and January 2021r
(2018 = 100)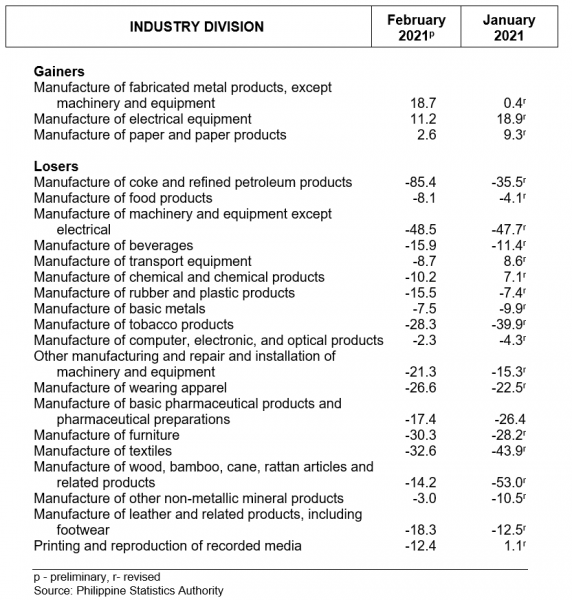
by Industry Division: February 2021p and January 2021r
(2018 = 100)
TABLE 2-A. Year-on-Year Growth Rate (%) of Value of Net Sales Index
by Industry Division: February 2021p and January 2021r
(2018 = 100)
by Industry Division: February 2021p and January 2021r
(2018 = 100)
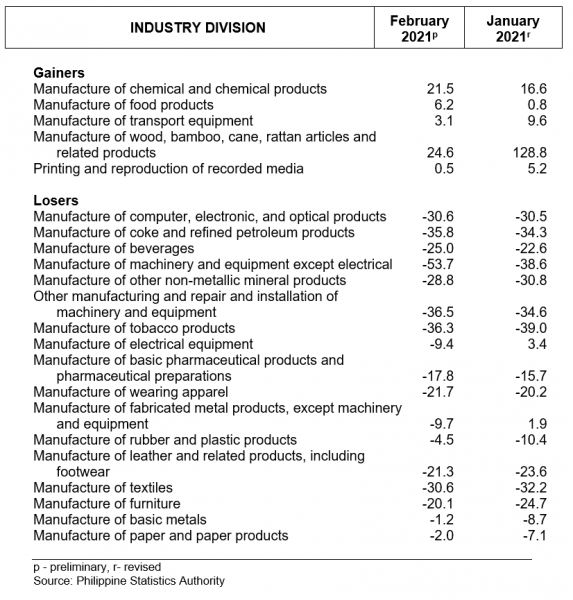
TABLE 2-B. Year-on-Year Growth Rate (%) of Volume of Net Sales Index
by Industry Division: February 2021p and January 2021r
(2018 = 100)
by Industry Division: February 2021p and January 2021r
(2018 = 100)
DENNIS S. MAPA, Ph. D.
Undersecretary
National Statistician and Civil Registrar General