Four out of Five Children Aged 5 to 24 Years Were Attending School for School Year 2022 to 2023
The 2020 Annual Poverty Indicators Survey (APIS) included questions related to the provision of adequate drinking water, sanitation, and hygiene (WASH) facilities similar to its first introduction in the 2017 APIS. The inclusion of WASH was primarily done to monitor the Sustainable Development Goal (SDG) national indicators. This report presents the WASH indicators based on the results of the 2020 APIS.
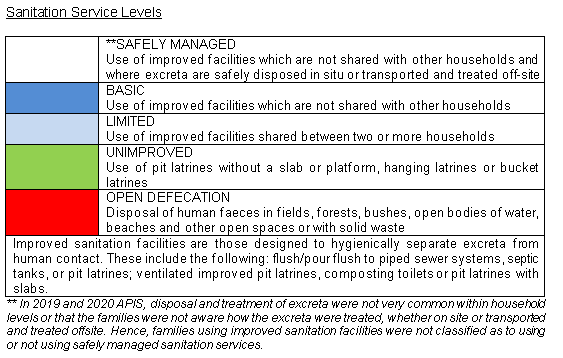
Sanitation
In 2020, about four out of five families (80.4%) had a basic sanitation service level or used an improved sanitation facility not shared with another household. Moreover, about one out of 10 families (13.5%) had a limited service level, or equivalent to using an improved sanitation facility but shared with two or more households. The remaining 3.3 percent families with no sanitation facility practice open defecation, and 2.6 percent families had an unimproved service level. (Table 1a)
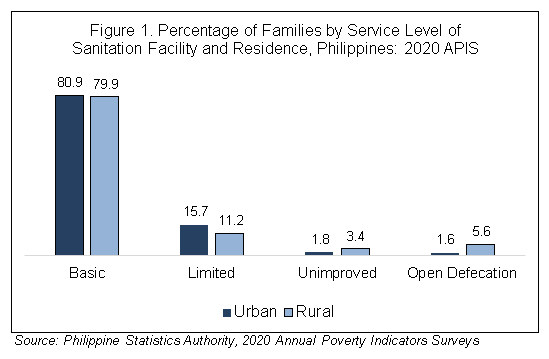
Urban (80.9%) and rural (79.9%) areas had almost similar proportion of families with access to basic sanitation facility. Urban area coverage with 15.7 percent of families using limited sanitation facility is higher than that in rural areas at 11.2 percent. On the contrary, the number of rural residents with families practicing open defecation (5.6%) is higher than that of urban residents (1.6%). (Table 2b, and Figure 1)
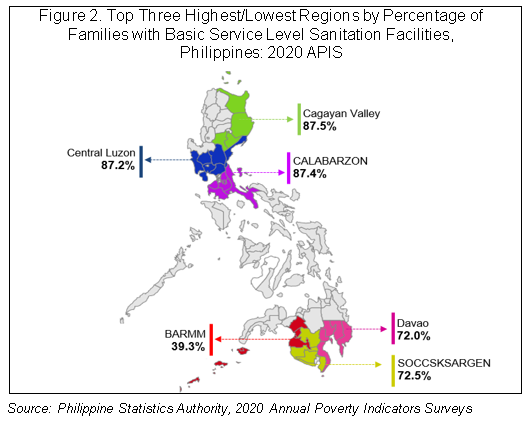
By region, the top three regions with the highest percentage of families with basic service sanitation facilities were Cagayan Valley (87.5%), CALABARZON (87.4%), and Central Luzon (87.2%). On the other hand, the three regions with the lowest percentage of families were Bangsamoro Autonomous Region in Muslim Mindanao or BARMM (39.3%), Davao Region (72.0%), and SOCCSKSARGEN (72.5%). In addition, BARMM had the highest percentage of families with unimproved service level facilities (24.4%), and families practicing open defecation with no toilet facility (19.6%). (Table 1b, and Figure 2)
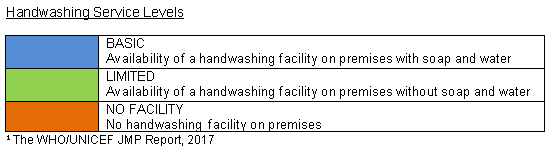
Hand Washing
Nine in every 10 (90.6%) of the 26 million Filipino families had a hand washing facility, mainly in the form of fixed facility with sink/tap (66.7%) in the dwelling unit. Among those with available handwashing facility, majority had available water (97.3%), and provision of bar/liquid soap (87.8%) and/or detergent soap (37.8%) in hand washing. (Table 2a)
By type of handwashing service level, most families (92.1 percent) had access to basic handwashing facilities or handwashing facilities on premises with soap and water. (Table 2b)
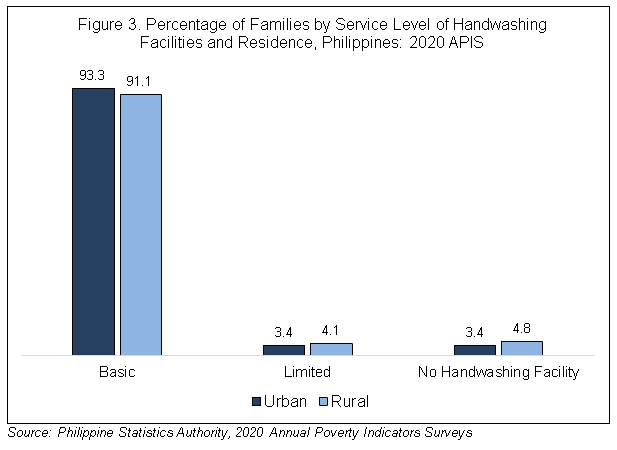
Comparison by residence status showed that an almost similar percentage of families had access to available handwashing service level facilities. To show, about 93.3 percent of families in urban areas had available basic service handwashing facilities which is closely followed by 91.1 percent of families in rural areas. The same is true for limited service level handwashing facilities with 3.4 percent in urban and 4.1 percent in rural areas. Further, about 3.4 percent of families had no handwashing facility in urban areas while 4.8 percent in rural areas. (Table 2a, and Figure 3)
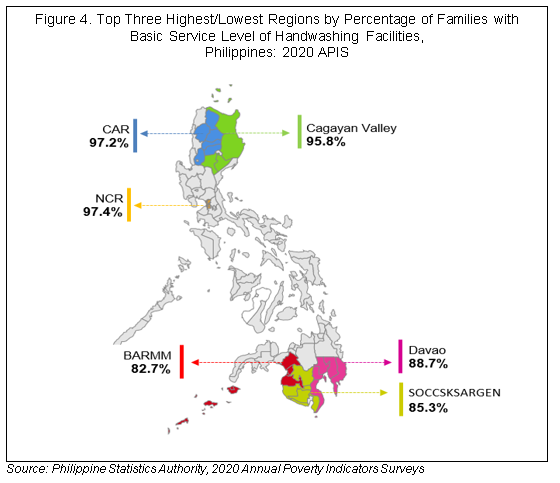
Across regions, the National Capital Region or NCR (97.4%) had the highest percentage of families with access to basic service handwashing facilities, followed by Cordillera Administrative Region (97.2%), and Cagayan Valley (95.8%). Regions with the lowest percentage of families were Davao Region (88.7%), SOCCSKSARGEN (85.3%), and BARMM (82.7%). (Table 2b, and Figure 4)
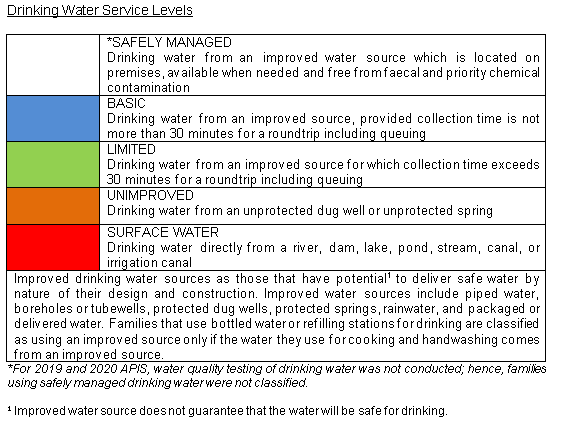
Drinking Water
Results of the 2020 APIS showed that majority of families had an improved source of drinking water (97.5%), with almost half of which were refilling stations (47.8%), and one-fifth came from water piped into dwelling unit (20.3%).
On the sufficiency of drinking water, majority of families reported that drinking water was sufficient (91.3 percent). However, four in every five families (80.2 percent) did not practice any method or treatment in ensuring that drinking water is safe to drink. (Table 3a)
About nine in every ten families (93.9 percent) had basic service level with drinking water from an improved source with roundtrip collection time not more than 30 minutes. (Table 3b)
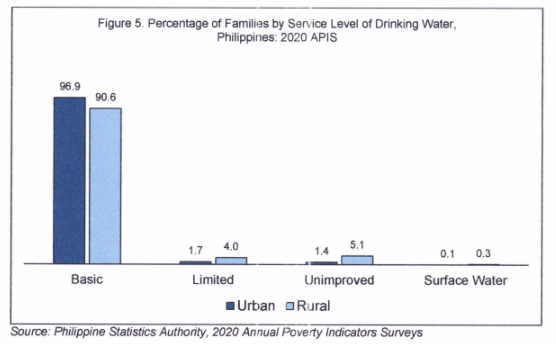
Percentage of families with basic drinking water service level in urban areas (96.9%) was higher than in rural areas (90.6%). The reverse is true for families with limited service level of which rural area coverage (4.0%) was higher than that in urban areas (1.7%). Likewise, those with unimproved service level in rural areas (5.1%) were higher than in urban areas (1.4%). (Table 3b, and Figure 5)
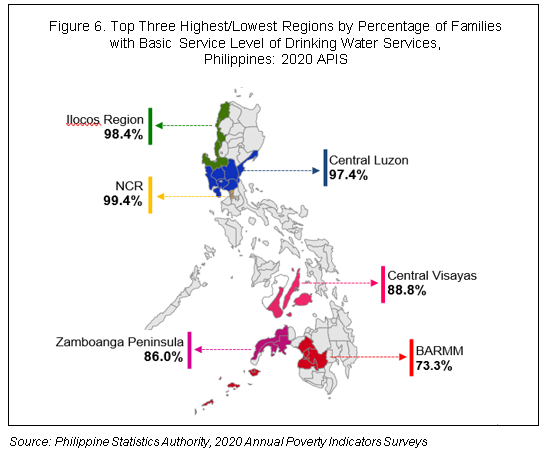
Across regions, the NCR (99.4%) had the highest percentage with almost all families had access to basic service level of drinking water, followed by Ilocos Region (98.4%), and Central Luzon (97.4%). Regions with lesser access to basic service level were BARMM (73.3%), Zamboanga Peninsula (86%), and Central Visayas (88.8%). Additionally, BARMM had the highest percentage of families with access to non-basic service level of drinking water, namely, limited service level (8.3%), unimproved service level (15.2%), and surface water (3.2%). (Table 3b, and Figure 6)
DENNIS S. MAPA, Ph.D.
Undersecretary
National Statistician and Civil Registrar General
Technical Notes
The Annual Poverty Indicators Survey (APIS) is a nationwide survey conducted by the Philippine Statistics Authority (PSA) that is designed to provide non-income indicators related to poverty at the national level. It also gathered data on the socio-economic profile of families and other information related to their living condition. In the 2020 APIS, around 44,000 sample households were covered nationwide.
In consonance with SDG monitoring on sanitation, hand washing, and drinking water services has been classified according to service levels classification to benchmark, and compare service levels across countries.1
1 The WHO/UNICEF JMP Report, 2017