(Click the link to view region highlights)
REGION:
NCR - National Capital Region
CAR - Cordillera Administrative Region
Region I - Ilocos Region
Region II - Cagayan Valley
Region III - Central Luzon
Region IV-A - CALABARZON
MIMAROPA REGION
Region V - Bicol Region
Region VI - Western Visayas
Region VII - Central Visayas
Region VIII - Eastern Visayas
Region IX - Zamboanga Peninsula
Region X - Northern Mindanao
Region XI - Davao Region
Region XII - SOCCSKSARGEN
Region XIII - Caraga
BARMM - Bangsamoro Autonomous Region in Muslim Mindanao
NCR - NATIONAL CAPITAL REGION [back to top]
NCR’s economy increases by 4.4 percent in 2021
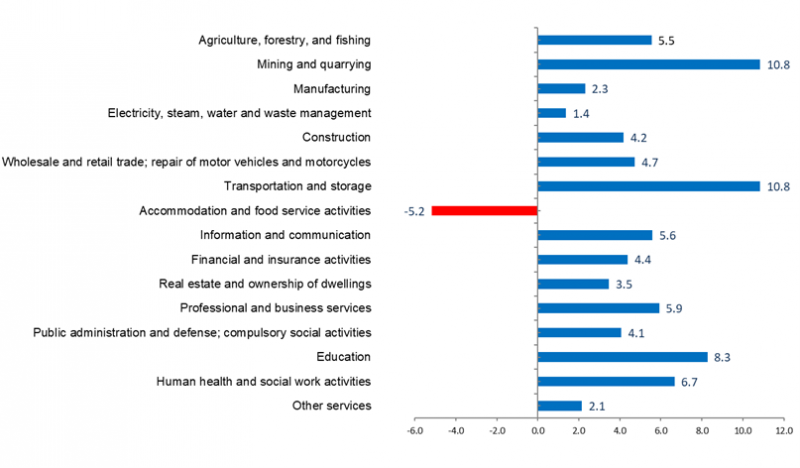
The economy of NCR rebounded from a -10.0 percent decline in 2020 to 4.4 percent growth in 2021. The top 3 sub-industries that recorded the fastest growths were the following: Mining and Quarrying with 10.8 percent; Transportation and Storage with 10.8 percent; and Education with 8.3 percent. Meanwhile, Accommodation and food service activities was the only sub-industry that posted a contraction with -5.2 percent. (Figure 10)
Figure 10. National Capital Region, Growth Rates by Industry: 2020 - 2021
At Constant 2018 Prices, in Percent
Source: Philippine Statistics Authority
Services accounted for 81.4 percent of the region’s total GRDP in 2021, followed by Industry with 18.6 percent share.
NCR contributed 1.4 percentage points to the total 5.7 percent growth in the country’s economy in 2021. This accounted for 31.5 percent of the total GDP, the highest among the regions.
Government spending in NCR grows by 7.7 percent in 2021
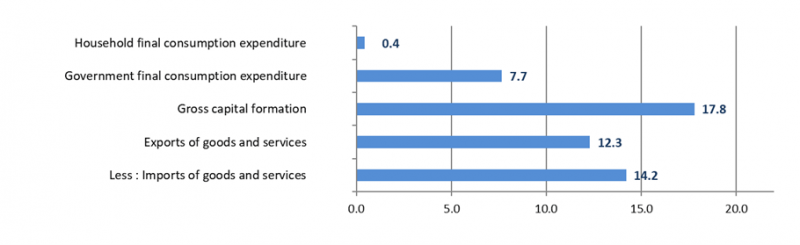
NCR’s government spending or Government final consumption expenditure sustained its growth by posting 7.7 percent in 2021, from 11.5 percent growth in 2020. Household final consumption expenditure grew by 0.4 percent in 2021 from -8.5 percent decline in 2020. Gross fixed capital formation likewise grew by 17.8 percent from -31.8 percent decline in the previous year. Lastly, Exports of goods and services to the Rest of the World (ROW) grew by 12.3 percent in 2021 from the -16.5 percent decline in 2020 and Imports of goods and services from ROW grew by 14.2 percent from the -19.1 percent decline. (Figure 11)
Figure 11. National Capital Region, Growth Rates by Expenditure Type: 2020 - 2021
At Constant 2018 Prices, in Percent
Source: Philippine Statistics Authority
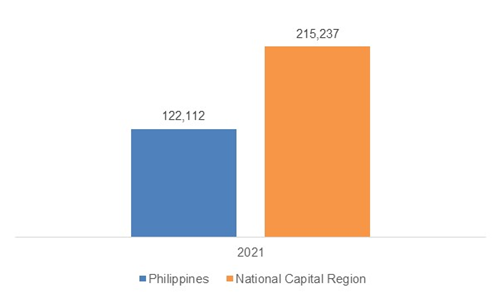
The per capita HFCE in the region was recorded at PhP 215,237 in 2021, higher than the national level per capita HFCE of PhP 122,112. (Figure 12)
Figure 12. Philippines and National Capital Region,
Per Capita Household Final Consumption Expenditure: 2021
At Constant 2018 Prices, in pesos
Source: Philippine Statistics Authority
CAR - CORDILLERA ADMINISTRATIVE REGION [back to top]
Cordillera’s economy recovers to 7.5 percent in 2021
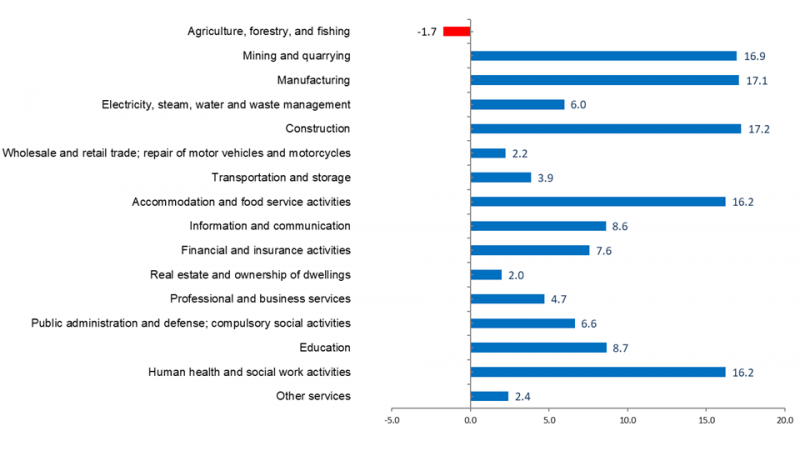
The economy of Cordillera Administrative Region (CAR) improved by 7.5 percent in 2021 from the -10.2 percent contraction during the previous year. The fastest growths were observed in the following: Construction with 17.2 percent; Manufacturing with 17.1 percent; Mining and quarrying with 16.9 percent; and Accommodation and food service activities and Human health and social work both with 16.2 percent. The biggest contributors to the growth of CAR’s economy were Manufacturing with 2.0 percentage points and Construction with 1.2 percentage points. (Figure 13)
Figure 13. Cordillera Administrative Region, Growth Rates by Industry: 2020 - 2021
At Constant 2018 Prices, in Percent
Source: Philippine Statistics Authority
Services accounted for more than half of the region’s total economy with 65.5 percent share followed by Industry with 25.2 percent share and Agriculture, forestry, and fishing with 9.2 percent share.
Of the 7.5 percent economic expansion of the country in 2021, CAR remained to be one of the least contributors with 0.1 percentage point. CAR’s economy accounted for only 1.7 percent of the total GDP.
Household final consumption expenditure of CAR grows; imports of goods and services declines in 2021
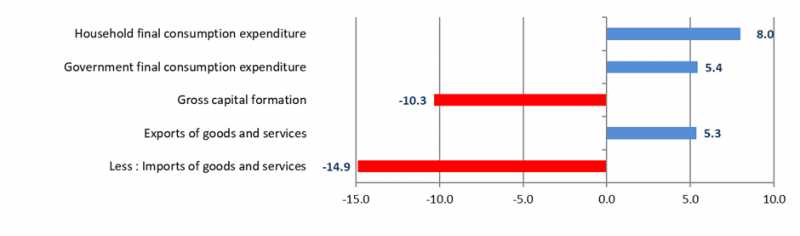
Household final consumption expenditure (HFCE) was the major driver of the 7.5 percent growth of the CAR economy in 2021. Among all the expenditure items, HFCE, Government final consumption expenditure (GFCE), and Exports of goods and services registered 8.0 percent, 5.4 percent, and 5.3 percent growths, respectively. On the other hand, the -14.9 percent and -10.3 percent contractions were observed from Imports of Goods and Services and Gross Capital Formation. (Figure 14)
Figure 14. Cordillera Administrative Region, Growth Rates by Expenditure Type: 2020 - 2021
At Constant 2018 Prices, in Percent
Source: Philippine Statistics Authority
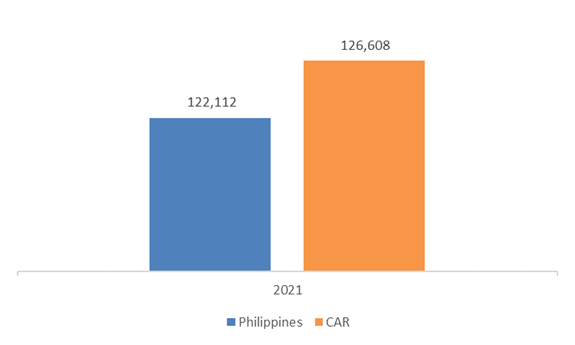
The per capita HFCE of CAR was estimated at PhP 126,608 in 2021. This was an increase from the previous year’s per capita HFCE of PhP 118,215. The per capita HFCE of CAR in 2021 was higher than the national per capita HFCE of PhP 122,112. (Figure 15)
CAR was among the eight regions that surpassed the 100,000 peso-mark in terms of per capita HFCE in 2021.
Figure 15. Philippines and Cordillera Administrative Region,
Per Capita Household Final Consumption Expenditure: 2021
At Constant 2018 Prices, in pesos
Source: Philippine Statistics Authority
REGION I - ILOCOS REGION [back to top]
Ilocos Region’s economy expands by 4.6 percent in 2021
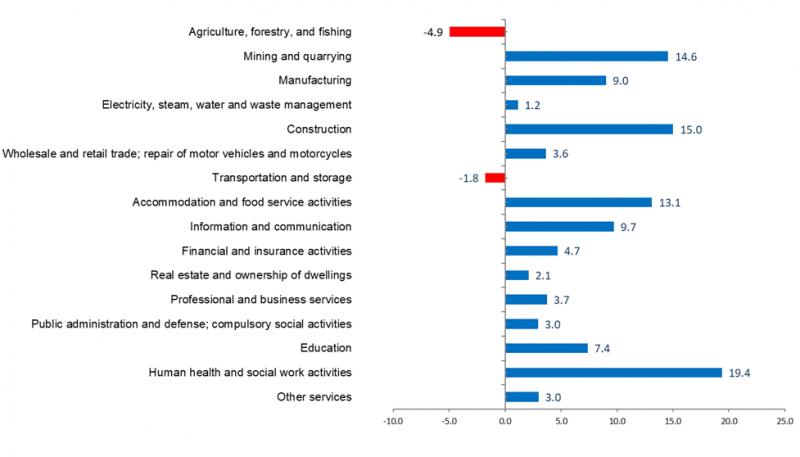
The economy of Ilocos Region grew by 4.6 percent in 2021 accounting to PhP 608.60 billion, from the PhP 581.88 billion in the previous year. The top three with the highest growth were Human health and social work activities with 19.4 percent, Construction with 15.0 percent, and Mining and quarrying with 14.6 percent. (Figure 16)
Meanwhile, there were two industries that registered decline in the regional economy: Agriculture, forestry, and fishing, -4.9 percent; and Transportation and storage, -1.8 percent. (Figure 16)
Figure 16. Ilocos Region, Growth Rates by Industry: 2020 - 2021
At Constant 2018 Prices, in Percent
Source: Philippine Statistics Authority
Among the major industries, Industry contributed 2.9 percentage points to the total growth in the economy, followed by Services with 2.7 percentage points. Meanwhile, Agriculture, forestry, and fishing pulled down the growth by -1.0 percentage point.
Of the 5.7 percent growth in the economy of the country, Ilocos Region contributed 0.2 percentage point, accounting for 3.3 percent share of the total GDP.
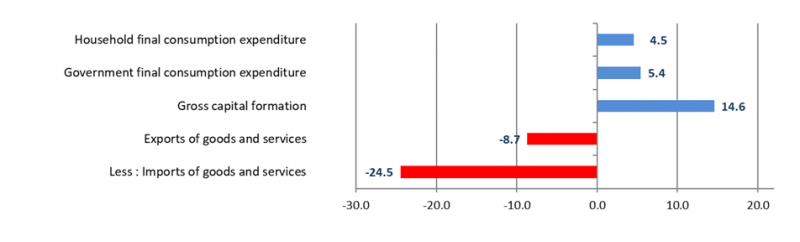
Ilocos Region’s household final consumption expenditure increases by 4.5 percent
Among major expenditure items, three registered positive growths: Gross capital formation with the highest growth rate of 14.6 percent; Government final consumption expenditure, 5.4 percent; and Household final consumption expenditure, 4.5 percent.
However, two major expenditure items posted contractions. Imports of goods and services from the rest of the world declined by -24.5 percent; and Exports of goods and services to rest of the world declined by -8.7 percent. (Figure 17)
Figure 17. Ilocos Region, Growth Rates by Expenditure Type: 2020 - 2021
At Constant 2018 Prices, in Percent
Source: Philippine Statistics Authority
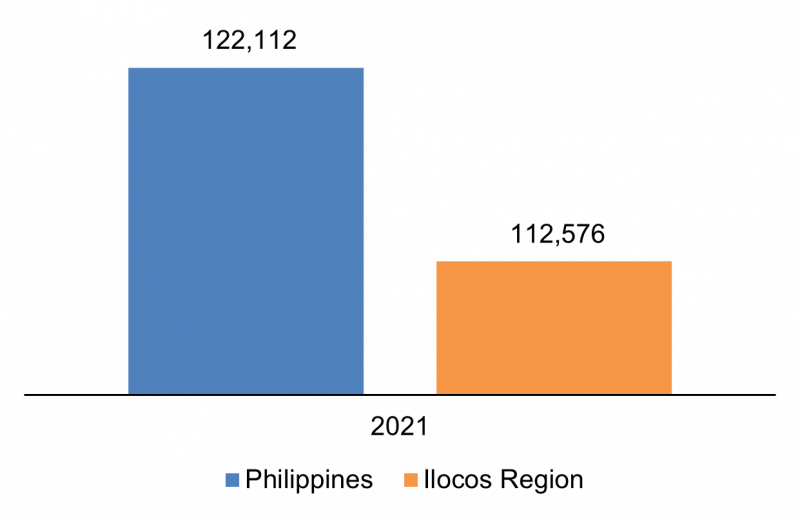
The per capita HFCE of Ilocos Region in 2021 was estimated at PhP 112,576, lower than the national level at PhP 122,112. (Figure 18)
Figure 18. Philippines and Ilocos Region,
Per Capita Household Final Consumption Expenditure: 2021
At Constant 2018 Prices, in pesos
Source: Philippine Statistics Authority
REGION II - CAGAYAN VALLEY [back to top]
Cagayan Valley’s economy rebounds to 5.1 percent in 2021
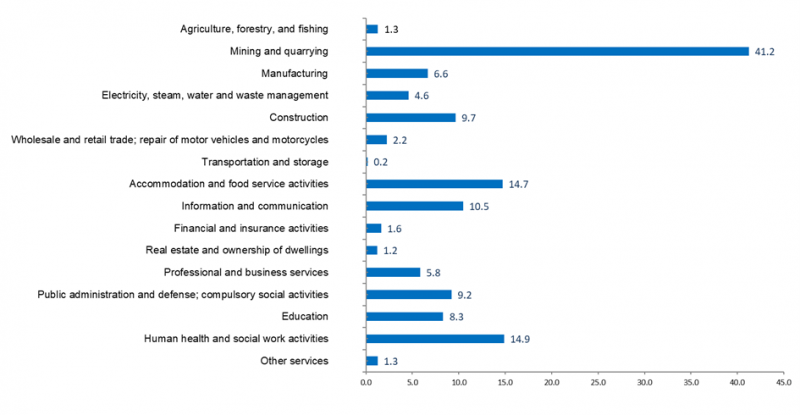
The economy of Cagayan Valley rebounded by 5.1 percent in 2021, from a contraction of -9.8 percent in the previous year. Sub-industries with the highest growth rates were: Mining and quarrying, 41.2 percent; Human health and social work activities, 14.9 percent; Accommodation and food service activities, 14.7 percent; Information and communication, 10.5 percent; and Construction, 9.7 percent. (Figure 19)
Figure 19. Cagayan Valley, Growth Rates by Industry: 2020 - 2021
At Constant 2018 Prices, in Percent
Source: Philippine Statistics Authority
Among the major industries, Services, which contributed 43.1 percent share to the regional economy, accelerated by 5.1 percent, boosted by Education, Information and communication, Human health and social work activities, and Wholesale and retail trade; repair of motor vehicles and motorcycles. Industry, which accounted for 27.0 percent share rebounded by 9.5 percent, boosted by Construction, and Manufacturing. Likewise, Agriculture, forestry, and fishing, which accounted for 30.0 percent share, grew by 1.3 percent, following a decline in the previous period.
Of the 5.7 percent economic growth in the country, Cagayan Valley contributed 0.1 percentage point while accounting for 2.1 percent of the total GDP.
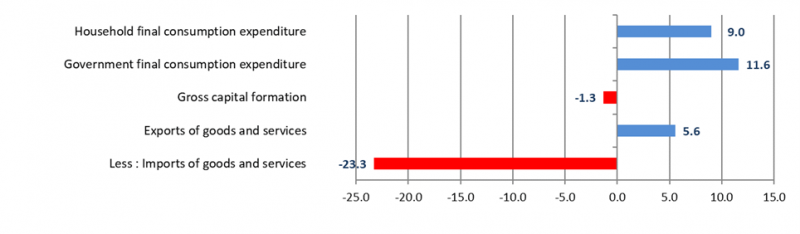
Cagayan Valley increases household spending in 2021
Cagayan Valley household spending, which grew by 9.0 percent, was the biggest contributor to the region’s increased spending in 2021. Moreover, government spending grew the fastest at 11.6 percent, followed by exports of goods and services to rest of the world which grew by 5.6 percent.
On the other hand, Cagayan Valley’s imports of goods and services from the rest of the world as well as the region’s gross capital formation pulled down the region’s total spending posting declines of -23.3 percent and -1.3 percent, respectively. (Figure 20)
Figure 20. Cagayan Valley, Growth Rates by Expenditure Type: 2020 - 2021
At Constant 2018 Prices, in Percent
Source: Philippine Statistics Authority
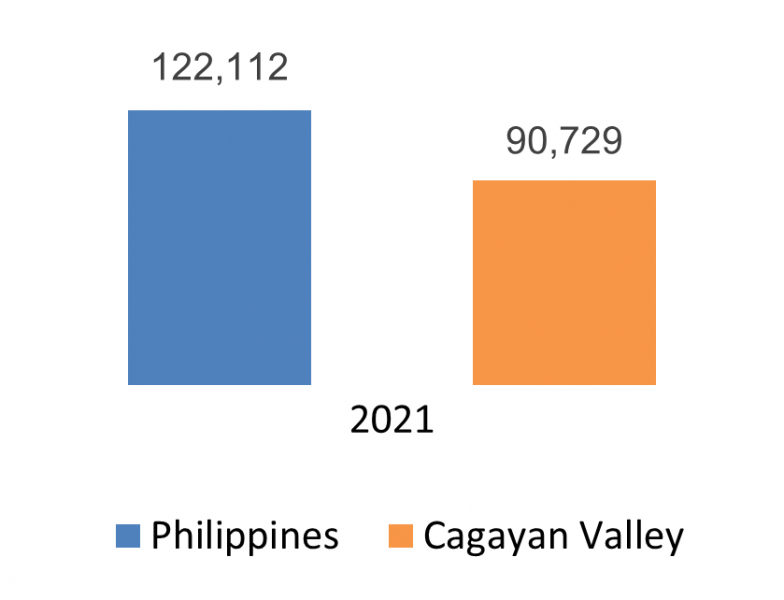
Real per capita HFCE increased by 7.9 percent in 2021. The real per capita HFCE in the region was recorded at PhP 90,729, lower than the national level per capita HFCE of PhP 122,112. (Figure 21)
Figure 21. Philippines and Cagayan Valley,
Per Capita Household Final Consumption Expenditure: 2021
At Constant 2018 Prices, in pesos
Source: Philippine Statistics Authority
REGION III - CENTRAL LUZON [back to top]
Rebound in Industry boosts Central Luzon’s Economy in 2021
The economy of Central Luzon rebounded to 7.4 percent in 2021 compared with the -13.9 percent in the previous year. The sub-industries with the highest growth rates were: Mining and quarrying, 41.4 percent; Human health and social work activities, 21.9 percent; and Manufacturing, 17.1 percent. On the other hand, Agriculture, forestry, and fishing further declined by -6.0 percent. (Figure 22)
Figure 22. Central Luzon, Growth Rates by Industry: 2020 - 2021
At Constant 2018 Prices, in Percent
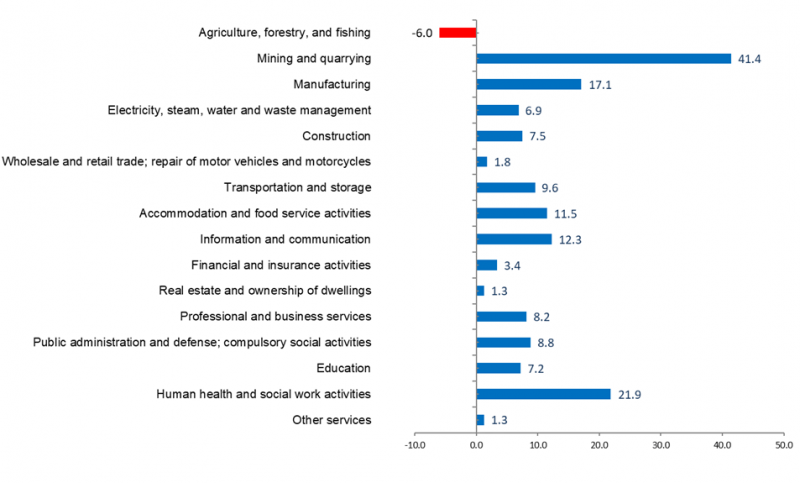
Source: Philippine Statistics Authority
Services accounted for 46.0 percent of the region’s total economy in 2021, followed by Industry with 42.2 percent and Agriculture, forestry, and fishing with 11.8 percent.
Services rebounded to 5.8 percent in 2021 from -10.5 percent in 2020. This was attributed to the increase in all its sub-industries mainly Human health and social work activities, Information and communication, and Accommodation and food service activities.
Of the 5.7 percent economic growth in the country, Central Luzon was the third largest contributor to the increase with 0.8 percentage point, accounting for 10.9 percent of the total GDP.
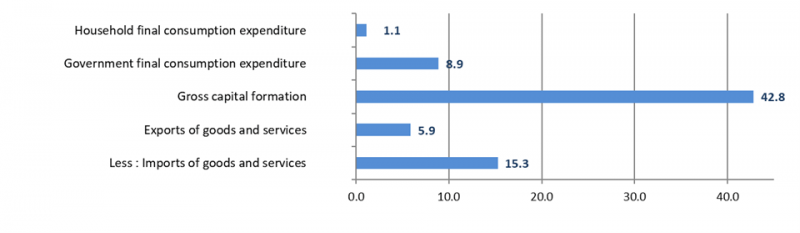
Central Luzon’s gross capital formation grows by 42.8 percent
Central Luzon's gross capital formation posted a growth of 42.8 percent in 2021. Household final consumption expenditure also grew by 1.1 percent compared from the decline of -7.1 percent during the previous year. Gross fixed capital formation increased significantly by 8.3 percent in 2021, from a -30.6 percent decline in 2020. Total exports of goods and services to rest of the world and Total imports of goods and services from ROW both registered increase of 5.9 percent and 15.3 percent, respectively. However, government spending in the region slowed down by 8.9 percent in 2021 from 9.1 percent in 2020. (Figure 23)
Figure 23. Central Luzon, Growth Rates by Expenditure Type: 2020 - 2021
At Constant 2018 Prices, in Percent
Source: Philippine Statistics Authority
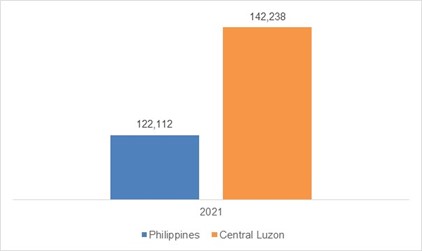
Real per capita HFCE in Central Luzon slightly dropped by -0.5 percent in 2021. It was recorded at PhP 142,238 in 2021, higher than the national level which amounted to PhP 122,112. (Figure 24)
Figure 24. Philippines and Central Luzon,
Per Capita Household Final Consumption Expenditure: 2021
At Constant 2018 Prices, in pesos
Source: Philippine Statistics Authority
REGION IVA - CALABARZON [back to top]
CALABARZON is the fastest growing region in 2021
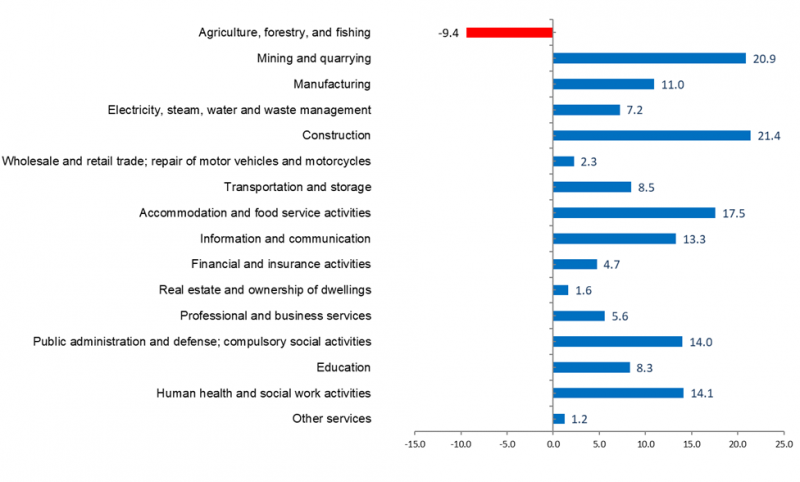
The economy of CALABARZON grew by 7.6 percent in 2021 from a decline of -10.5 percent in 2020. It recorded the fastest growth among the regions in the country during the period. The expansion was fueled by the high rebound in Manufacturing at 11.0 percent from a -11.7 percent contraction in the previous year.
All industries posted growth in 2021 with Construction recorded the highest growth at 21.4 percent. Meanwhile, Agriculture, forestry and fishing (AFF) registered a contraction of -9.4 percent. (Figure 25)
Figure 25. CALABARZON, Growth Rates by Industry: 2020 - 2021
At Constant 2018 Prices, in percent
Source: Philippine Statistics Authority
Industry comprised the biggest share of the region’s economy estimated at 51.0 percent. It expanded by 11.2 percent from a decline of -12.6 percent in 2020. Services, accounting for 44.1 percent of the total, increased by 5.9 percent. AFF had the least share of 4.8 percent.
Of the 5.7 percent growth of GDP of the country, CALABARZON contributed 1.1 percentage points, the second highest among the regions. The region was also the second largest in terms of share, accounting for 14.7 percent of total GDP.
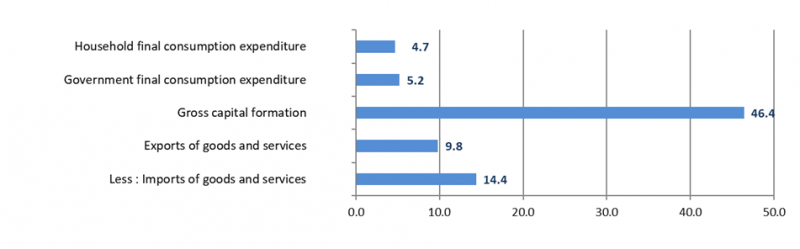
CALABARZON’s Gross capital formation expands by 46.4 percent
CALABARZON’s spending on Gross capital formation posted the fastest growth at 46.4 percent in 2021. Other expenditure items also posted expansion. Total Imports and total Exports of goods and services from Rest of the World (ROW) grew by 14.4 and 9.8 percent, respectively. HFCE increased by 4.7 percent from a contraction of -8.0 percent in the previous year. On the other hand, government spending in the region slowed down to 5.2 percent in 2021 from a 10.1 percent growth in 2020. (Figure 26)
Figure 26. CALABARZON, Growth Rates by Expenditure Type: 2020 - 2021
At Constant 2018 Prices, in Percent
Source: Philippine Statistics Authority
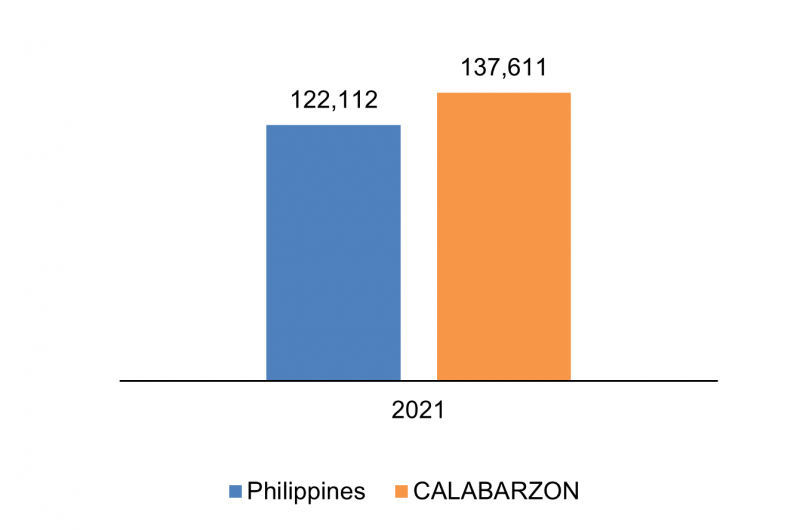
Real per capita HFCE grew by 2.7 percent in 2021. The real per capita HFCE in the region was recorded at PhP 137,611, higher than the national level which was estimated at PhP 122,112. (Figure 27)
Figure 27. Philippines and CALABARZON,
Per Capita Household Final Consumption Expenditure: 2021
At Constant 2018 Prices, in pesos
Source: Philippine Statistics Authority
MIMAROPA REGION [back to top]
MIMAROPA’s economy grows by 3.3 percent in 2021
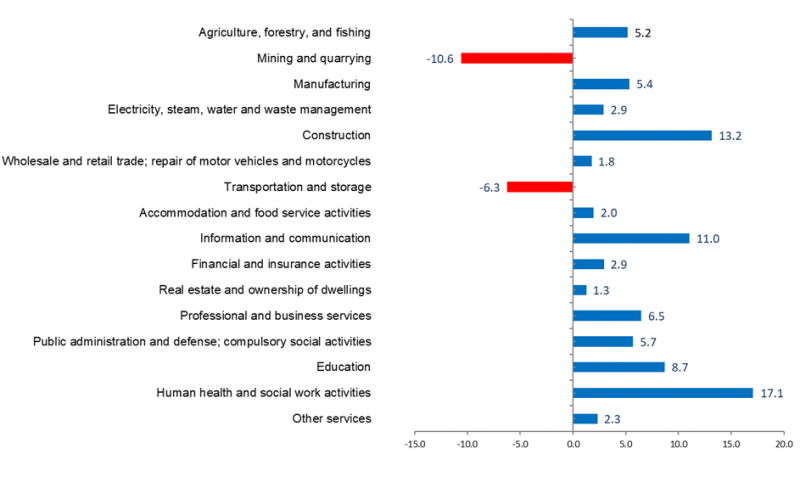
The economy of MIMAROPA rebounded to a 3.3 percent growth in 2021, from a decline of -7.5 percent in 2020. Industries with fastest growth rates were: Human health and social work activities with 17.1 percent; Construction with 13.2 percent; and Information and communication with 11.0 percent.
On the other hand, the industries that contributed to the decline of the economy includes Mining and quarrying with -10.6 percent and Transportation and storage with -6.3 percent. (Figure 28)
Figure 28. MIMAROPA, Growth Rates by Industry: 2020 - 2021
At Constant 2018 Prices, in Percent
Source: Philippine Statistics Authority
Among the major industries, Services accounted for 45.6 percent of the region’s economy, followed by Industry with 34.8 percent share and Agriculture, forestry and fishing with 19.6 percent share.
Services grew by 3.5 percent in 2021 from a contraction of -9.1 percent in 2020. This was mainly attributed to the growth in ten of its eleven industries under it, which include Human health and social work activities; Information and communication; and Education. Agriculture, forestry and fishing grew by 5.2 percent in 2021 from a -2.0 percent decline in 2020. Industry grew by 2.2 percent in 2021 from a drop of -8.2 percent in the previous year. Among its sub-industries, only Mining and quarrying posted a decline. Yet, despite the decline, MIMAROPA region remains to have the largest gross value added in Mining and quarrying in the country with a 21.4 percent share.
Among the 17 regions in the country, ten regions registered higher growth than the national economy. Of the 5.7 percent economic growth of the country in 2021, MIMAROPA region was one of the least contributors with 0.1 percentage point. MIMAROPA region accounted for 2.0 percent share to the national GDP.
MIMAROPA Region’s gross capital formation accelerates in 2021
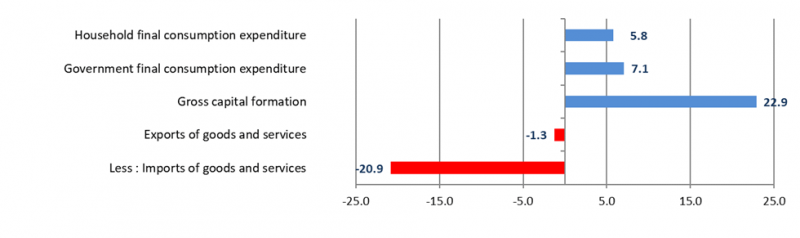
MIMAROPA Region’s gross capital formation accounted for the fastest growth among the expenditure items, with 22.9 percent. Government final consumption expenditure and household final consumption expenditure also posted positive growths in 2021, with 7.1 percent and 5.8 percent, respectively. On the other hand, imports of goods and services from rest of the world had a lower contraction of -20.9 percent from a drop of -28.8 percent in 2020. Exports of goods and services to rest of the world also declined by -1.3 percent in 2021 from a -46.0 percent decline in 2020. (Figure 29)
Household final consumption expenditure posted the highest contribution to the growth of the regional economy, contributing 4.9 percentage points. On the other hand, total net exports had the largest negative contribution at the expenditure side with -6.3 percentage points.
Figure 29. MIMAROPA, Growth Rates by Expenditure Type: 2020 - 2021
At Constant 2018 Prices, in Percent
Source: Philippine Statistics Authority
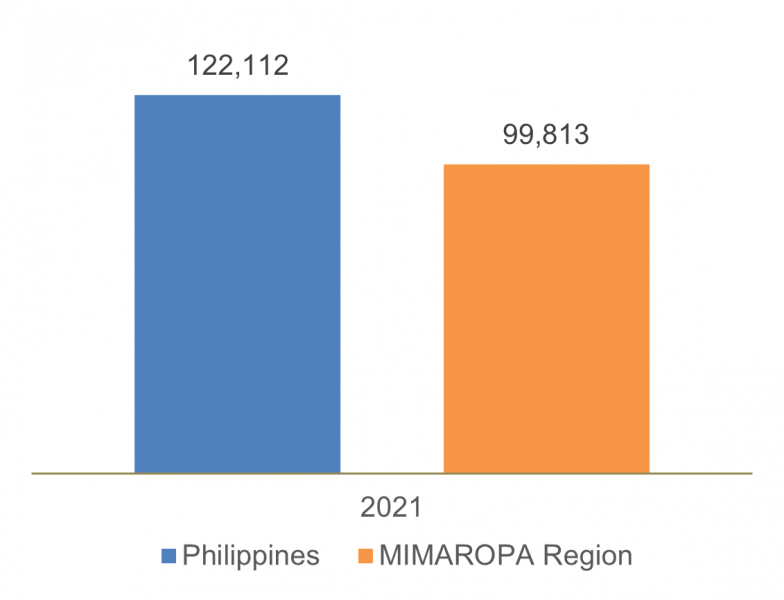
The per capita household final consumption expenditure in the region increased by 4.6 percent. The recorded per capita HFCE of PhP 99,813 was lower than the national level which amounted to PhP 122,112. (Figure 30)
Figure 30. Philippines and MIMAROPA,
Per Capita Household Final Consumption Expenditure: 2021
At Constant 2018 Prices, in pesos
Source: Philippine Statistics Authority
REGION V - BICOL REGION [back to top]
Bicol Region’s economy rebounds to 4.3 percent in 2021
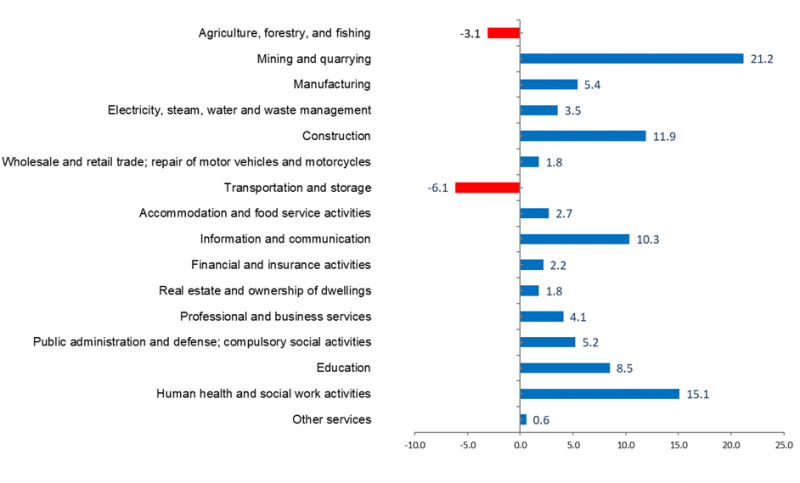
The economy of Bicol Region rebounded to 4.3 percent in 2021 compared with the -8.3 percent decline in 2020. The top three fastest growing industries were: Mining and quarrying with 21.2 percent; Human health and social work activities with 15.1 percent; and Construction with 11.9 percent. (Figure 31)
Figure 31. Bicol Region, Growth Rates by Industry: 2020 - 2021
At Constant 2018 Prices, in Percent
Source: Philippines Statistics Authority
Services remained to account for the largest share in the region’s economy in 2021 at 47.7 percent, followed by Industry with 35.7 percent and Agriculture, forestry, and fishing with 16.6 percent share.
Among the major economic industries, Industry and Services posted positive growths of 8.8 percent and 3.9 percent respectively, while Agriculture, forestry and fishing further declined by -3.1 percent.
Of the 5.7 percent economic growth of the country, Bicol Region contributed with 0.1 percentage point.
Bicol Region’s gross capital formation grows by 8.3 percent
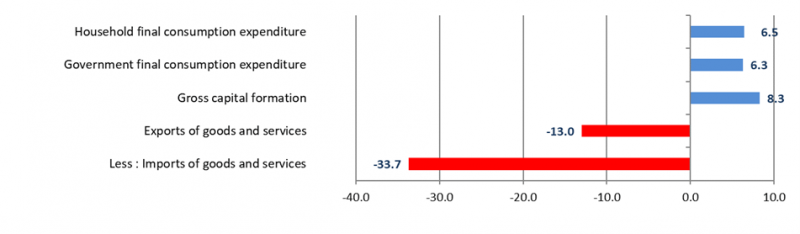
By expenditure item, Gross capital formation posted the highest growth at 8.3 percent. Household final consumption expenditure grew by 6.5 percent and Government final consumption expenditure increased by 6.3 percent.
Exports of goods and services to the Rest of the World declined by -13.0 percent and Imports of goods and services from the Rest of the World decreased by -33.7 percent. (Figure 32)
Figure 32. Bicol Region, Growth Rates by Expenditure Type: 2020 - 2021
At Constant 2018 Prices, in Percent
Source: Philippines Statistics Authority
Real per capita HFCE was higher by 5.5 percent in 2021. The real per capita HFCE in the region was recorded at PhP 93,645 in 2021 which was lower than the national per capita level of PhP 122,112. (Figure 33)
Figure 33. Philippines and Bicol Region,
Per Capita Household Final Consumption Expenditure: 2021
At Constant 2018 Prices, in pesos
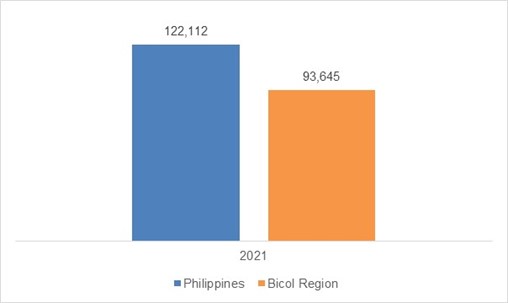
Source: Philippines Statistics Authority
REGION VI - WESTERN VISAYAS [back to top]
Western Visayas’ economy expands by 5.9 percent in 2021
The economy of Western Visayas rebounded to 5.9 percent in 2021 from the decline of -9.7 percent in 2020. The main drivers for the increase were observed in the following: Wholesale and retail trade; repair of motor vehicles and motorcycles with 7.3 percent; Agriculture, forestry, and fishing, 4.1 percent; and Construction, 13.1 percent. (Figure 34)
Likewise, all industries contributed to the growth of the region’s economy.
Figure 34. Western Visayas, Growth Rates by Industry: 2020 - 2021
At Constant 2018 Prices, in percent
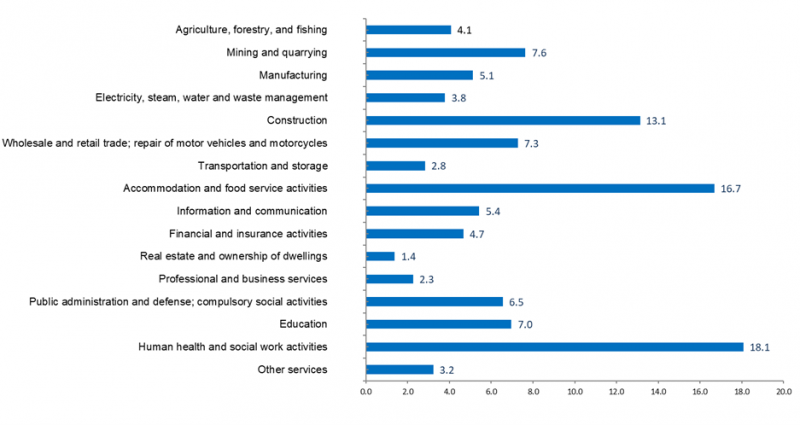
Source: Philippine Statistics Authority
Among the major industries, Services accounted for 59.0 percent of the region’s total economy in 2021. Industry shared 21.5 percent while AFF shared 19.5 percent.
Of the 5.7 growth of the GDP of the country, Western Visayas was the seventh contributor with 0.3 percentage point, and accounting for 4.7 percent share to the national GDP.
Western Visayas’ household spending expands by 7.5 percent
Western Visayas’ household spending expanded by 7.5 percent in 2021. The growth bounced back after a contraction of -8.5 percent in 2020.
Expansions in the following expenditure items were also observed: Imports of goods and services from Rest of the World, 27.2 percent; Government final consumption expenditure, 6.0 percent; Exports of goods and services to ROW, 4.4 percent; and Gross capital formation, 1.0 percent. (Figure 35)
Figure 35. Western Visayas, Growth Rates by Expenditure Type: 2020 - 2021
At Constant 2018 Prices, in Percent
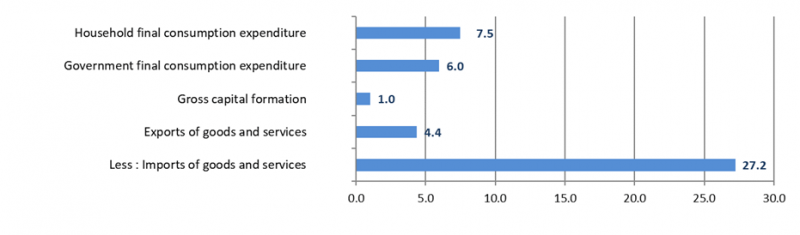
Source: Philippine Statistics Authority
Household spending of each individual in the region increased by 6.6 percent in 2021. The real per capita HFCE of the region was recorded at PhP 101,617, lower than the PhP 122,112 national per capita level.(Figure 36)
Figure 36. Philippines and Western Visayas,
Per Capita Household Final Consumption Expenditure: 2021
At Constant 2018 Prices, in pesos
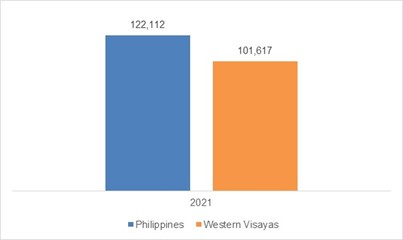
Source: Philippine Statistics Authority
REGION VII - CENTRAL VISAYAS [back to top]
Central Visayas’ economy rebounds to 5.4 percent in 2021
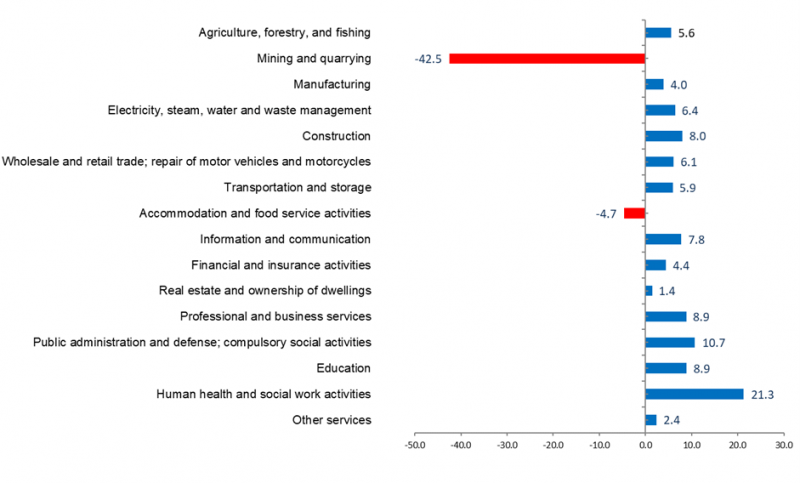
The economy of Central Visayas recorded a 5.4 percent growth in 2021 compared with the contraction of -9.5 percent in 2020. The main contributors to the 2021 growth were: Wholesale and retail trade; repair of motor vehicles and motorcycles at 6.1 percent; Manufacturing at 4.0 percent; Education at 8.9 percent; and Professional and Business Services at 8.9 percent. (Figure 37)
Figure 37. Central Visayas, Growth Rates by Industry: 2020 - 2021
At Constant 2018 Prices, in percent
Source: Philippine Statistics Authority
Among the three major industries, Services accounted the highest share of 68.1 percent in the region’s total GRDP in 2021, followed by Industry with 24.5 percent, and AFF with 7.4 percent.
In 2021, AFF grew by 5.6 percent from the 4.2 percent growth registered in 2020. Meanwhile, Services rebounded to 5.9 percent from a contraction of -7.7 percent in 2020.
Moreover, Industry grew by 3.8 percent in 2021 compared to the decline of -17.1 percent in 2020. This was mainly attributed to the increase in Manufacturing and Construction.
Of the 5.7 percent growth in the country’s economic performance, Central Visayas contributed 0.3 percentage point and remained to be the fourth largest economy with a 6.5 percent share of the total GDP in 2021.
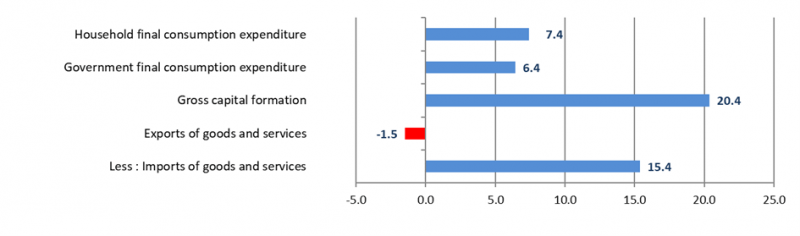
Central Visayas’ Gross capital formation registers the fastest growth in 2021
In 2021, all major expenditure items posted positive growths except Exports of Goods and Services to the Rest of the World which posted a decline of -1.5 percent. Gross capital formation had the fastest growth with 20.4 percent, a rebound from a decline of -33.5 percent in 2020. This was followed by Imports of Goods and Services from the Rest of the World with 15.4 percent growth from a decline of 21.8 percent in 2020. Both HFCE and GFCE of Central Visayas increased by 7.4 percent and 6.4 percent, respectively. (Figure 38)
Figure 38. Central Visayas, Growth Rates by Expenditure Type: 2020 - 2021
At Constant 2018 Prices, in Percent
Source: Philippine Statistics Authority
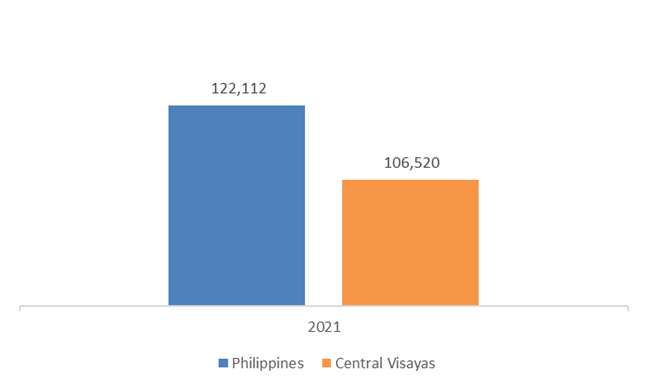
Real per capita HFCE increased by 6.1 percent in 2021 compared with a decline of -9.0 percent in 2020. The real per capita HFCE in the region was recorded at PhP 106,520, which was lower than the national level of PhP 122,112. (Figure 39)
Figure 39. Philippines and Central Visayas,
Per Capita Household Final Consumption Expenditure: 2021
At Constant 2018 Prices, in pesos
Source: Philippine Statistics Authority
REGION VIII - EASTERN VISAYAS [back to top]
Eastern Visayas’ economy rebounds to 6.0 percent in 2021
Eastern Visayas Region’s economy rebounded to 6.0 percent in 2021 from a contraction of -7.4 percent in 2020. The economic growth was driven by the positive performance of all the sub-industries. (Figure 40)
Figure 40. Eastern Visayas, Growth Rates by Industry: 2020 - 2021
At Constant 2018 Prices, in percent
Source: Philippine Statistics Authority
Industry and Services contributed 3.2 percentage points and 2.8 percentage points, respectively to the region’s 6.0 percent growth in 2021. AFF contributed 0.02 percentage point.
Services shared 45.7 percent of the region’s economy, followed closely by Industry at 40.4 percent. AFF had the smallest share at 13.9 percent.
Eastern Visayas contributed 0.1 percentage point to the country’s 5.7 percent economic growth in 2021. The region accounted for 2.5 percent of the Philippine economy.
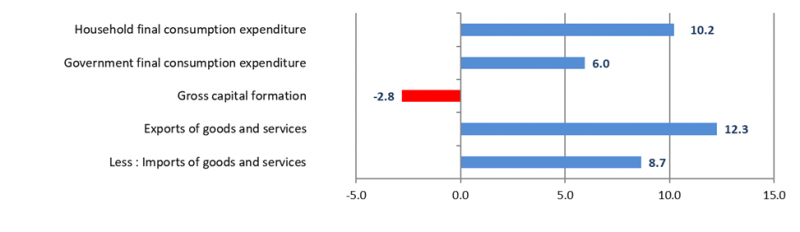
Eastern Visayas posts 10.2 percent growth in household spending in 2021
Eastern Visayas registered the second highest growth rate in household spending at 10.2 percent in 2021. The HFCE growth was a rebound from the -7.9 percent contraction in 2020.
Exports of goods and services to Rest of the World as well as the Imports of goods and services from ROW also grew by 12.3 percent and 8.7 percent, respectively. The growth of the region’s Government final consumption expenditure (GFCE) decelerated to 6.0 percent.
Meanwhile, Gross Capital Formation suffered -2.8 percent drop in 2021. (Figure 41)
Figure 41. Eastern Visayas, Growth Rates by Expenditure Type: 2020 - 2021
At Constant 2018 Prices, in Percent
Source: Philippine Statistics Authority
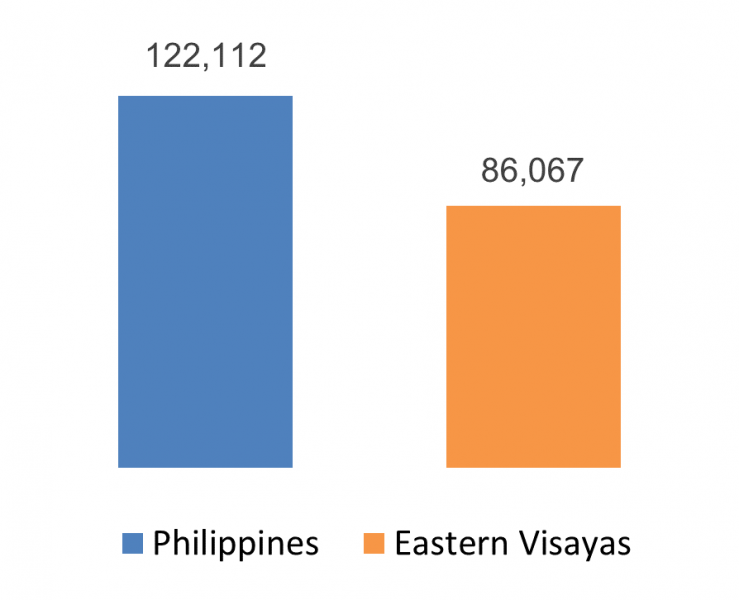
The real per capita HFCE of the region was estimated at PhP 86,067 in 2021. This was higher than the previous year’s per capita household spending amounting to
PhP 79,102. The region’s real per capita HFCE was lower than the national level estimated at PhP 122,112. (Figure 42)
Figure 42. Philippines and Eastern Visayas,
Per Capita Household Final Consumption Expenditure: 2021
At Constant 2018 Prices, in pesos
Source: Philippine Statistics Authority
REGION IX - ZAMBOANGA PENINSULA [back to top]
Zamboanga Peninsula’s economy grows by 5.7 percent in 2021
Zamboanga Peninsula’s economy recovered from a decline of -5.2 percent in 2020 to an expansion of 5.7 percent in 2021. The growth in the region’s economy in 2021 was caused by the expansion in all of the industries. Human health and social work activities had the highest increase with 16.1 percent, followed by Mining and quarrying with 13.7 percent, and Construction with 10.4 percent. (Figure 43)
Figure 43. Zamboanga Peninsula, Growth Rates by Industry: 2020 - 2021
At Constant 2018 Prices, in percent
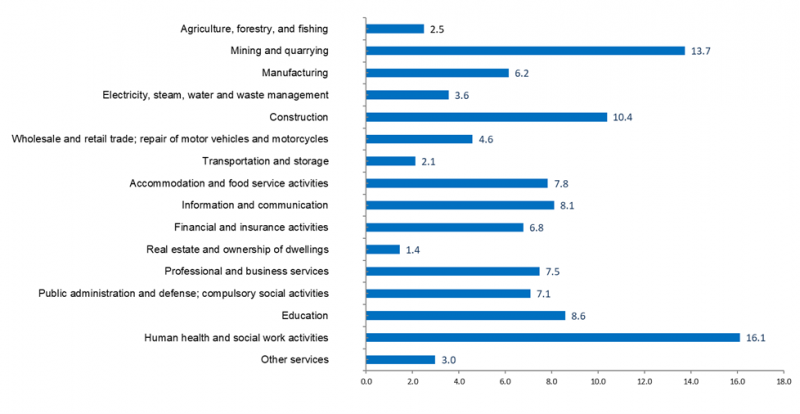
Source: Philippine Statistics Authority
Services accounted for 51.6 percent share to the total regional economy, followed by Industry with 29.7 percent share and Agriculture, forestry, and fishing with 18.7 percent share.
Services expanded by 6.0 percent in 2021, which was a rebound from the contraction of -8.3 percent in 2020. This was mainly attributed to the growth observed in all of its sub-industries. Wholesale and retail trade; repair of motor vehicles and motorcycles, with 22.0 percent share to the regional economy, grew by 4.6 percent in 2021 from a decline of -4.7 percent in 2020.
Of the 5.7 percent economic growth of the country in 2021, Zamboanga Peninsula contributed 0.1 percentage point while accounting for 2.1 percent share of the national GDP.
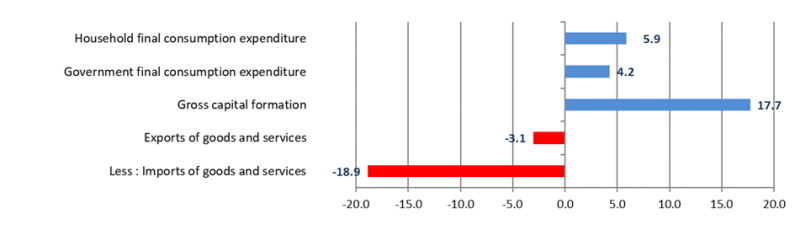
Zamboanga Peninsula’s gross capital formation rebounds in 2021
Zamboanga Peninsula’s GCF rebounded in 2021 with a 17.7 percent growth in 2021 from a -14.2 percent decline in 2020. Likewise, HFCE turned around from a -7.7 percent decrease in 2020 to a 5.9 percent growth in 2021. GFCE decelerated from a 12.4 percent growth in 2020 to 4.2 percent in 2021.
Meanwhile, Exports of goods and services to Rest of the World and Imports of goods and services from ROW both improved but still registered declines with -3.1 percent and -18.9 percent, respectively. (Figure 44)
Figure 44. Zamboanga Peninsula, Growth Rates by Expenditure Type: 2020 - 2021
At Constant 2018 Prices, in Percent
Source: Philippine Statistics Authority
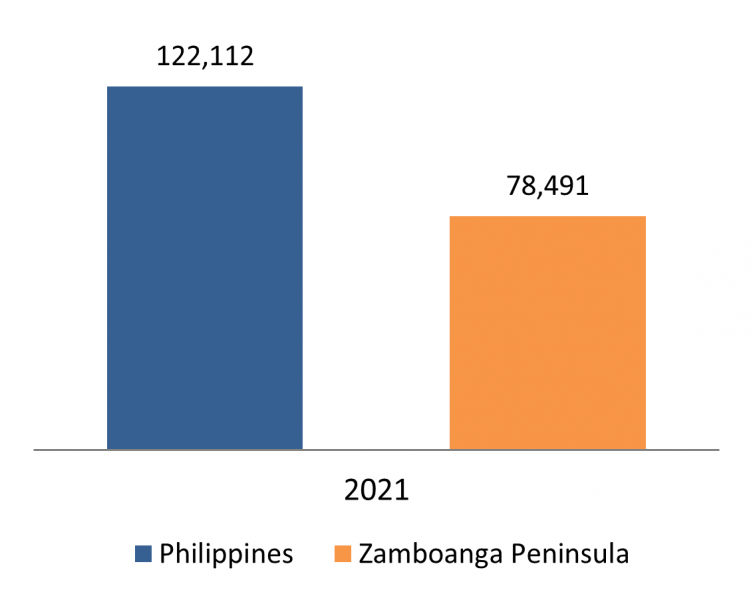
Real per capita HFCE grew by 5.1 percent in 2021. It was recorded at PhP 78,491 in 2021, which was lower than the national level of PhP 122,112. (Figure 45)
Figure 45. Philippines and Zamboanga Peninsula,
Per Capita Household Final Consumption Expenditure: 2021
At Constant 2018 Prices, in pesos
Source: Philippine Statistics Authority
REGION X - NORTHERN MINDANAO [back to top]
Northern Mindanao’s economy recovers as it gains PhP 51.50 billion in 2021
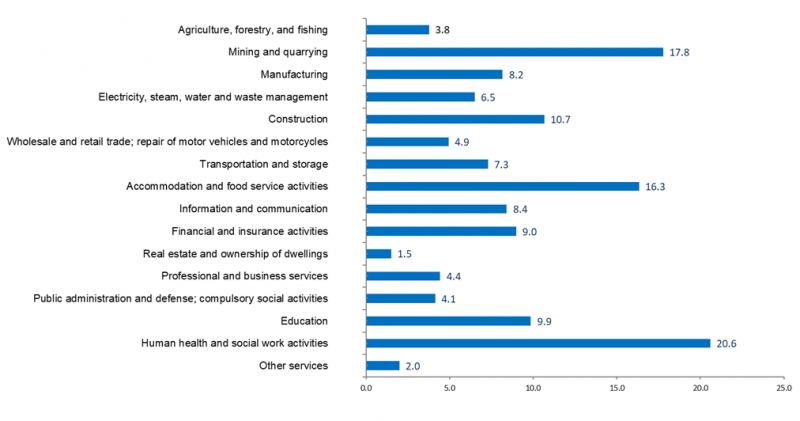
The economy of the region posted a growth of 6.3 percent in 2021, a rebound from a decline of -5.3 percent in the previous year. The 2021 GRDP was higher than the pre-pandemic GRDP level of PhP 867.43 billion in 2019. The 6.3 percent economic growth translated to an economic gain of PhP 51.50 billion, enough to recover from the economic loss of PhP 46.00 billion in 2020. The sub-industries with the highest growths were: Human health and social work activities which grew by 20.6 percent, Mining and quarrying, 17.8 percent; and Accommodation and food service activities, 16.3 percent. Region X was the sixth fast-growing regional economy in 2021. (Figure 46)
Figure 46. Northern Mindanao, Growth Rates by Industry: 2020 - 2021
At Constant 2018 Prices, in Percent
Source: Philippine Statistics Authority
Region X economy remained to have the 7th biggest share of the Philippine economy at 4.7 percent. Moreover, Region X contributed 0.3 percentage point to the GDP growth of 5.7 percent in 2021. Region X was the 5th biggest contributor among the regions to the expansion of the Philippine economy.
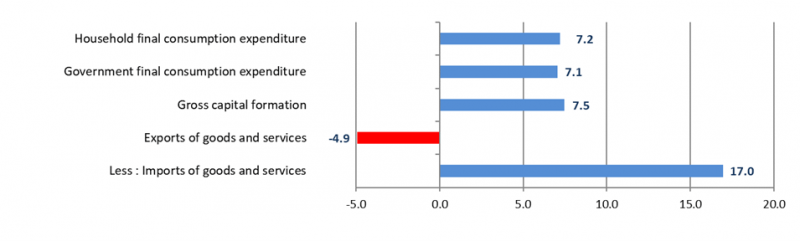
Imports of goods and services record the highest increase in spending in Northern Mindanao
With the recorded increase in Northern Mindanao’s GRDP, all major expenditure items recorded an increase in 2021 except Exports of goods and services which declined by -4.9 percent. Imports of goods and services had the largest increase of 17.0 percent, followed by investment spending or Gross capital formation with a recorded increase of 7.5 percent. (Figure 47)
Figure 47. Northern Mindanao, Growth Rates by Expenditure Type: 2020 - 2021
At Constant 2018 Prices, in percent
Source: Philippine Statistics Authority
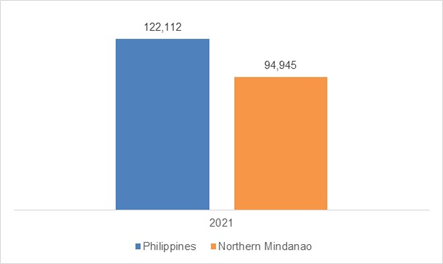
Real per capita HFCE increased by 6.0 percent in 2021. The real per capita HFCE in the region was recorded at PhP 94,945 in 2021. This was lower than the national level real per capita HFCE of PhP 122,112. (Figure 48)
Figure 48. Philippines and Northern Mindanao,
Per Capita Household Final Consumption Expenditure: 2021
At Constant 2018 Prices, in pesos
Source: Philippine Statistics Authority
REGION XI - DAVAO REGION [back to top]
Davao Region’s economy posts 5.9 percent growth in 2021
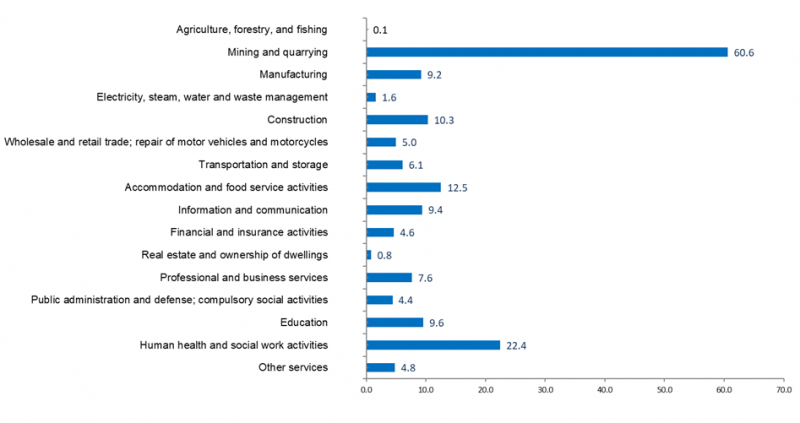
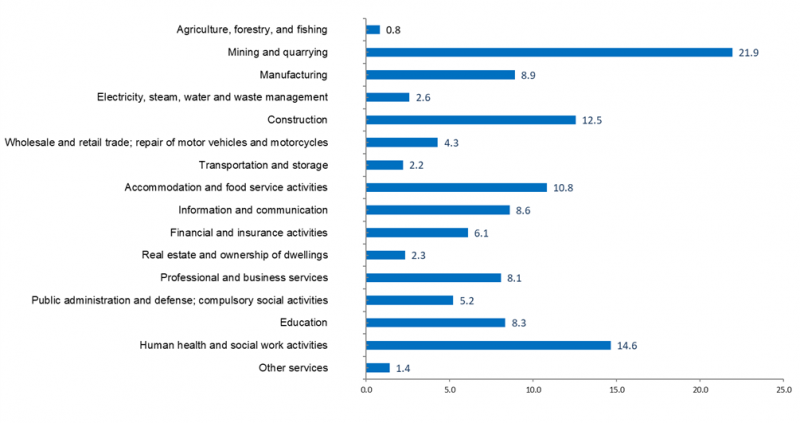
The economy of Davao Region grew by 5.9 percent in 2021. All the 16 industries of GRDP posted positive growths in 2021. Among the industries, Mining and quarrying recorded the fastest growth, with 21.9 percent. It was followed by Human health and social work activities, with 14.6 percent; Construction, with 12.5 percent; and Accommodation and food service activities, with 10.8 percent. (Figure 49)
Figure 49. Davao Region, Growth Rates by Industry: 2020 - 2021
At Constant 2018 Prices, in Percent
Source: Philippine Statistics Authority
Services, which contributed 58.7 percent share to the regional economy, increased by 5.6 percent in 2021. Industry, which accounted for 25.2 percent share, grew by 9.9 percent. Agriculture, forestry, and fishing, which had the least contribution to the total economy of the region with 16.1 percent share posted 0.8 percent growth.
Of the overall 5.9 percent economic performance of the region, 3.3 percentage points came from Services, 2.5 percentage points from Industry, and 0.1 percentage point contributed by Agriculture, forestry and fishing.
Davao Region’s investment spending posts highest growth in 2021
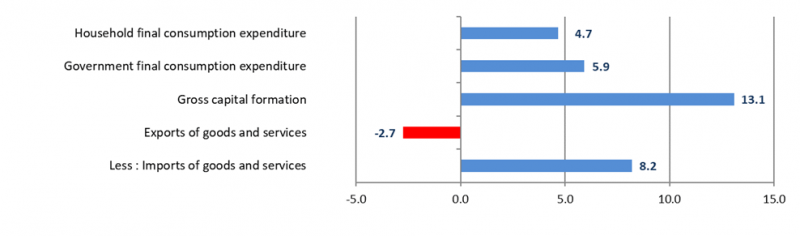
Among the expenditure items, Gross capital formation or investment spending posted the highest growth in 2021, with 13.1 percent. It was followed by: Imports of goods and services from the Rest of the World, with 8.2 percent; Government final consumption, with 5.9 percent; and HFCE, with 4.7 percent. (Figure 50)
Figure 50. Davao Region, Growth Rates by Expenditure Type: 2020 - 2021
At Constant 2018 Prices, in Percent
Source: Philippine Statistics Authority
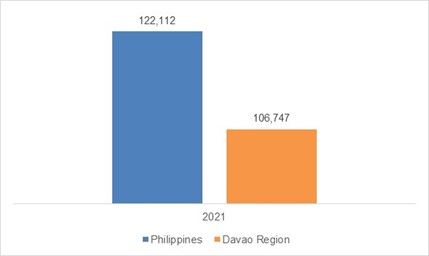
Real per capita HFCE or the household spending of every person increased by 3.1 percent from PhP 103,522 in 2020 to PhP 106,747 in 2021. This was lower than the national level real per capita HFCE of PhP 122,112. (Figure 51)
Figure 51. Philippines and Davao Region,
Per Capita Household Final Consumption Expenditure: 2021
At Constant 2018 Prices, in pesos
Source: Philippine Statistics Authority
REGION XII - SOCCSKSARGEN [back to top]
SOCCSKSARGEN’s economy recovers by 5.2 percent in 2021
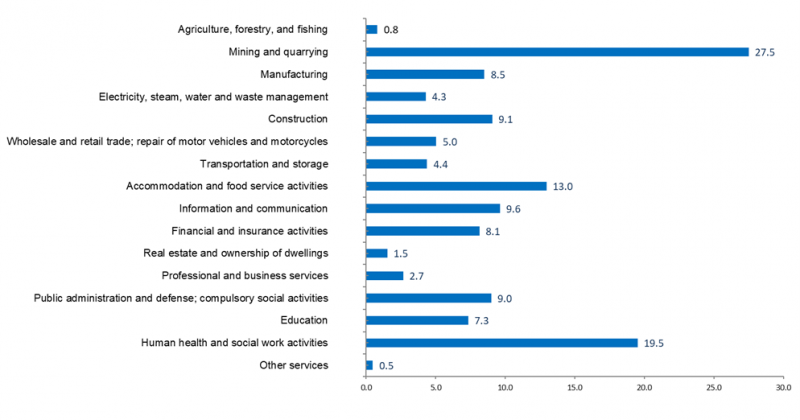
The economy of SOCCSKSARGEN rebounded to 5.2 percent in 2021 from a contraction of -4.4 percent in 2020 as both Industry and Services recovered from a slump in 2020. All sub-industries recorded expansions in 2021 with Mining and Quarrying posting the fastest growth at 27.5 percent. (Figure 52)
Figure 52. SOCCSKSARGEN, Growth Rates by Industry: 2020 - 2021
At Constant 2018 Prices, in Percent
Source: Philippine Statistics Authority
Services, which contributed 47.0 percent to the regional economy, increased by 6.7 percent. Industry, which shared 25.4 percent, expanded by 7.4 percent. Moreover, Agriculture, forestry, and fishing grew at a slower pace at 0.8 percent.
Services and Industry were the biggest contributors to growth at 3.1 percentage points and 1.8 percentage points, respectively. Agriculture, forestry, and fishing contributed 0.3 percentage point to the region’s economic growth.
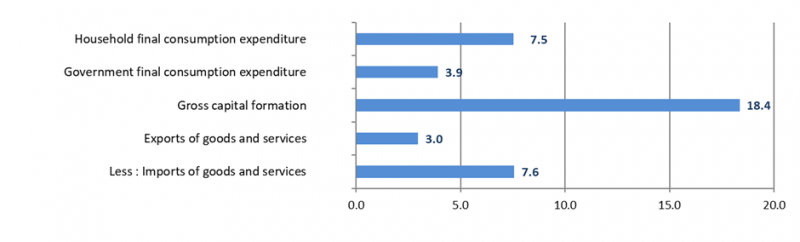
SOCCSKSARGEN posts 18.4 percent growth in gross capital formation in 2021
SOCCSKSARGEN’s Gross capital formation expanded by 18.4 percent in 2021, an improvement from a decline of -15.0 percent from the previous year’s level. Household final consumption expenditure, the main driver of the regional economy, rebounded to 7.5 percent. Total imports of goods and services from Rest of the World turned around by 7.6 percent. Government final consumption expenditure grew by 3.9 percent. Total exports of goods and services to Rest of the World went up by 3.0 percent. (Figure 53)
Figure 53. SOCCSKSARGEN, Growth Rates by Expenditure Type: 2020 - 2021
At Constant 2018 Prices, in Percent
Source: Philippine Statistics Authority
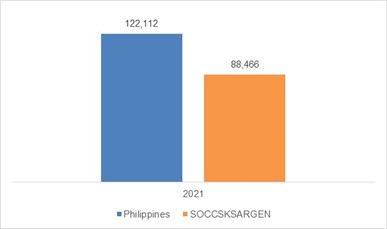
The real per capita Household final consumption expenditure in the region was estimated at PhP 88,466, higher than the PhP 83,325 recorded in 2020. It was about PhP 33,645 lower than the national average of PhP 122,112. (Figure 54)
Figure 54. Philippines and SOCCSKSARGEN,
Per Capita Household Final Consumption Expenditure: 2021
At Constant 2018 Prices, in pesos
Source: Philippine Statistics Authority
REGION XIII - CARAGA [back to top]
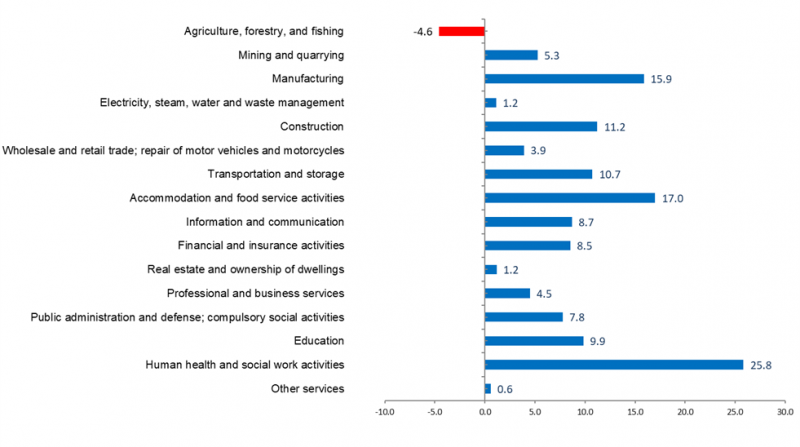
Caraga’s economic performance expands by 7.2 percent in 2021
The economy of Caraga increased by 7.2 percent in 2021 compared with the -6.9 percent decline in 2020. The top three sub-industries with the highest growth rates in 2021 were: Human health and social work activities, which grew by 25.8 percent; Accommodation and food service activities at 17.0 percent; and Manufacturing at 15.9 percent.
Meanwhile, AFF contracted by -4.6 percent in 2021 from a growth of 3.4 percent in 2020. AFF contributes 12.6 percent to the regional economy. (Figure 55)
Figure 55. CARAGA Region, Growth Rates by Industry: 2020 - 2021
At Constant 2018 Prices, in Percent
Source: Philippine Statistics Authority
Of the 5.7 percent economic growth of the country, Caraga’s contribution to the increase was estimated at 0.1 percentage point while accounting for 1.6 percent of the total GDP.
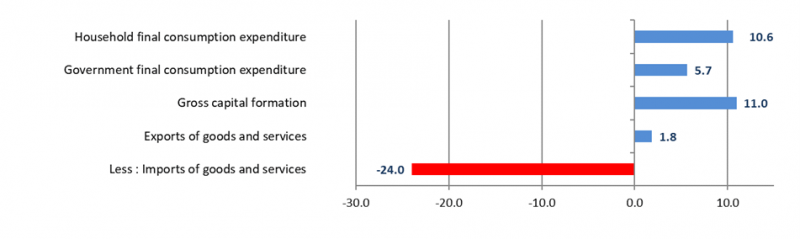
Caraga’s Gross capital formation (GCF) posts the highest growth in the region
Caraga’s GCF recorded 11.0 percent growth in 2021. Other expenditure items showed increase except for the Imports of goods and services from the Rest of the World which posted a decline of -24.0 percent. On the other hand, Government final consumption expenditure grew by 5.7 percent, contributing 1.0 percentage point to the growth of the region. Meanwhile, region’s household spending, which accounted to 76.7 percent of the region’s economy, increased by 10.6 percent in 2021. (Figure 56)
Figure 56. CARAGA Region, Growth Rates by Expenditure Type: 2020 - 2021
At Constant 2018 Prices, in Percent
Source: Philippine Statistics Authority
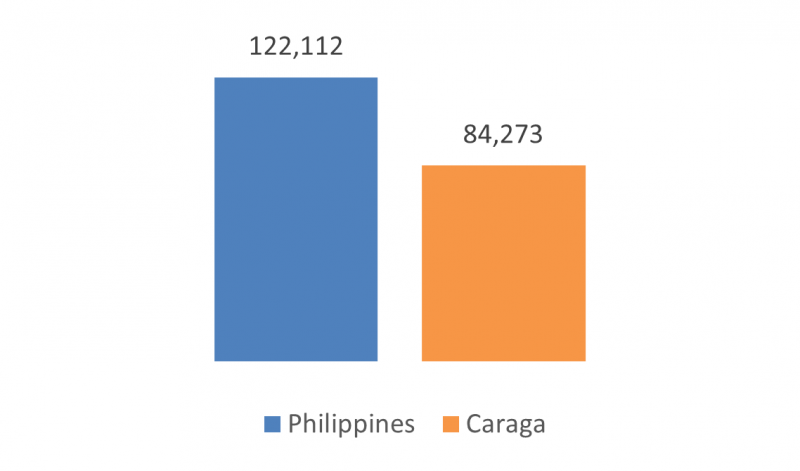
The per capita HFCE of Caraga in 2021 was estimated at PhP 84,273, higher than the PhP 77,026 recorded in 2020. It was about PhP 37,839 lower than the national level of P122,112. (Figure 57)
Figure 57. Philippines and Caraga,
Per Capita Household Final Consumption Expenditure: 2021
At Constant 2018 Prices, in pesos
Source: Philippine Statistics Authority
BARMM - BANGSAMORO AUTONOMOUS REGION IN MUSLIM MINDANAO [back to top]
BARMM's economy increases by 7.5 percent and records the second-fastest growing region
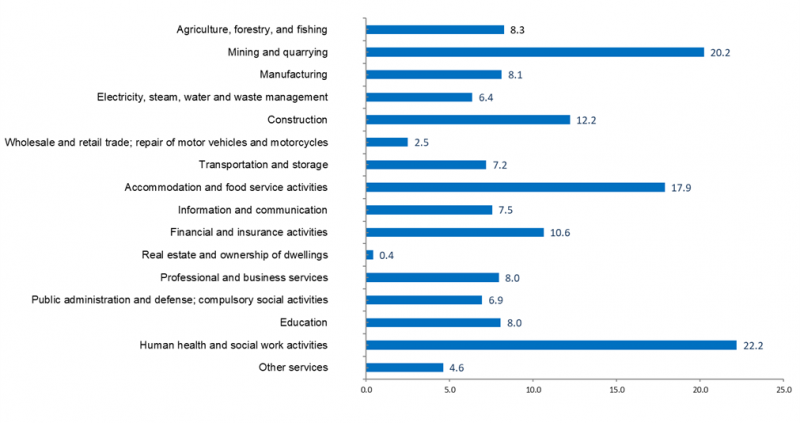
The economic performance of Bangsamoro Autonomous Region in Muslim Mindanao (BARMM) increased by 7.5 percent in 2021 and recorded the second-fastest growth among all regions. The top industries that registered the highest growths were: Human health and social work activities, 22.2 percent; Mining and quarrying, 20.2 percent; Accommodation and food service activities, 17.9 percent; Construction, 12.2 percent; and Financial and insurance activities, 10.6 percent. All other industries also registered positive growths. (Figure 58)
Figure 58. Bangsamoro Autonomous Region in Muslim Mindanao,
Growth Rates by Industry:2020 - 2021, At Constant 2018 Prices, in percent
Source: Philippine Statistics Authority
With the 5.7 percent GDP growth of the country, BARMM contributed 0.1 percentage point to the country’s economic growth in 2021.
BARMM’s Imports of goods and services and Gross capital formation contribute to the growth
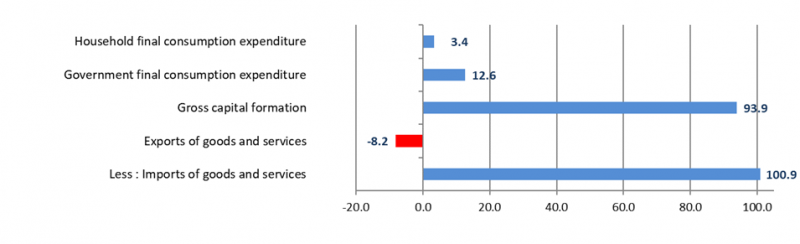
At the expenditure side, Imports of goods and services from the Rest of the World posted the highest growth among the expenditure items with 100.9 percent, followed by Gross capital formation with 93.9 percent, Government final consumption expenditure with 12.6 percent, and Household final consumption expenditure with 3.4 percent.
On the other hand, Exports of goods and services to Rest of the World posted a decline at -8.2 percent. (Figure 59)
Figure 59. Bangsamoro Autonomous Region in Muslim Mindanao,
Growth Rates by Expenditure Type: 2020 - 2021 At Constant 2018 Prices, in Percent
Source: Philippine Statistics Authority
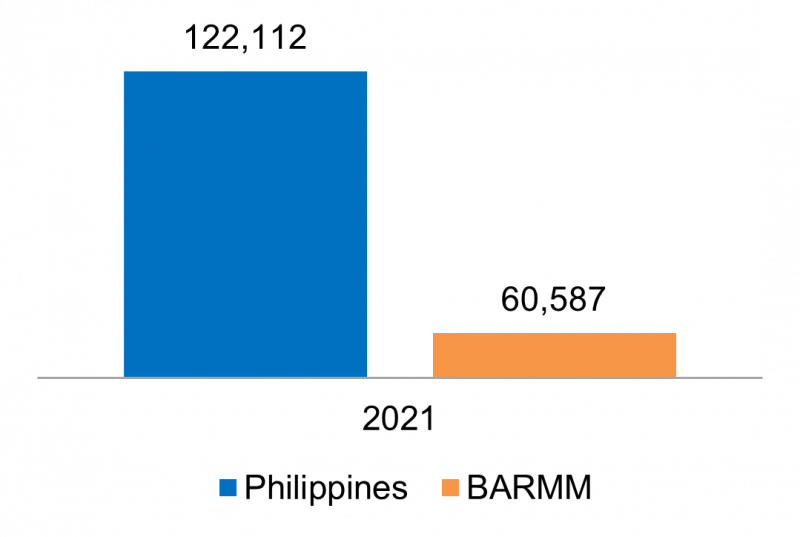
In 2021, BARMM’s per capita Household final consumption expenditure of BARMM in 2021 was estimated at PhP 60,587, higher than the previous year which was estimated at PhP 59,773. (Figure 60)
Figure 60. Philippines and Bangsamoro Autonomous Region in Muslim Mindanao,
Per Capita Household Final Consumption Expenditure: 2021
At Constant 2018 Prices, in pesos
Source: Philippine Statistics Authority