Water Accounts of the Philippines
The country’s total water abstraction, or the amount of water that was removed from its source either permanently or temporarily, increased by 0.8 percent, from 216.85 billion cubic meters (bcm) in 2019 to 218.46 bcm in 2020. From 2010 to 2020, on the average, 98.1 percent of the total abstraction was from surface water such as lakes, artificial reservoirs, rivers and streams, and the remaining 1.9 percent came from groundwater reservoirs. On the average, 98.6 percent of the abstracted water was for own use while the remaining 1.4 percent was intended for distribution to other economic units. (Figure 1, and Tables 1.1 to 1.11)

Water abstracted for own use also increased from 213.34 bcm in 2019 to 214.79 bcm in 2020. From 2010 to 2020, the largest amount of self-abstracted water was for the power sector (58.6%). This was followed by the agriculture, forestry and fishing sector (33.8%), mining and quarrying, manufacturing, and construction (5.3%), and the services sector and households (2.4%). It should be noted that the power sector, specifically hydropower, uses water in a non-consumptive manner. That is, water remains in or is immediately returned to the location from which it was extracted. (Figure 2, and Tables 1.1 to 1.11)
Similarly, the amount of distributed water also increased from 2.65 bcm in 2019 to 2.75 bcm 2020. From 2010 to 2020, more than half of the distributed water was used by households (51.0%). This was followed by the services sector (36.7%) then mining and quarrying, manufacturing, and construction (11.1%). The smallest amount of distributed water was used by the sectors of agriculture, forestry and fishing, and power. Generally, the services sector and households are connected to municipal water systems that facilitate water collection, treatment, and distribution. (Figure 3, and Tables 1.1 to 1.11)

During the 11-year period, households consistently had the largest share of expenses on water. In 2020, households’ expenses on water amounted to PhP 66.72 billion. This was followed by the services sector and then mining and quarrying, manufacturing, and construction, amounting to PhP 48.47 billion and PhP 23.65 billion, respectively. (Figure 4, and Tables 2.1 to 2.11)

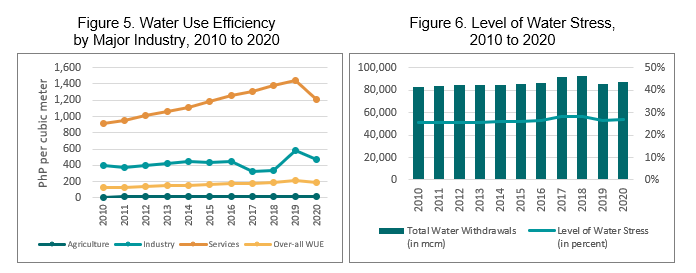
Water use efficiency (WUE), or the value added per volume of water used, decreased from PhP 217.42 per cubic meter of water used in 2019 to PhP 192.39 per cubic meter in 2020. The services sector consistently had the largest WUE from 2010 to 2020, followed by the industry sector and irrigated agriculture sector. It is notable that for the same period, the services sector contributed 62.3 percent to the total gross value added but, at the same time, shared 8.8 percent only to the total water used. On the other hand, the sectors of industry and irrigated agriculture correspondingly contributed 30.9 and 6.8 percent to the total gross value added while sharing 12.4 percent and 78.8 percent to the total water used, respectively. (Figure 5 and Table 3)
The level of water stress, or freshwater withdrawal as a proportion of available freshwater resources, slightly increased from 26.3 percent in 2019 to 26.7 percent in 2020. The highest level from 2010 to 2020 was observed in 2018 at 28.2 percent. The annual level of water stress since 2010 consistently fell within the low-level classification range of 25 to 50 percent. (Figure 6 and Table 4)
It should be noted that freshwater withdrawals for both indicators exclude hydropower generation due to its non-consumptive use. Also, Water Supply and Waste Management is included in the services sector, in alignment with the global methodology for Sustainable Development Goal 6.4.1. Additionally, parameters on the available water resources of the Philippines, particularly the total renewable freshwater resources and environmental flow requirements are adopted from the AQUASTAT database of the Food and Agriculture Organization of the United Nations, the international custodian agency for SDG 6.4.
The supply and use of water resources follow the System of Environmental-Economic Accounting (SEEA) 2012 Central Framework which was adopted as an international statistical standard and is aligned with the System of National Accounts. The water accounts provide information on the rate of extraction and the use of water by different economic units.
DENNIS S. MAPA, Ph.D.
Undersecretary
National Statistician and Civil Registrar General