The second component of the Compendium focuses on environmental resources and the benefits they provide to humanity. These resources include minerals, energy, land and soil, water, and biological resources.
Mineral Resources
As of 2020, gold had the largest amount among all metallic resources and reserves in the country, with over 4.42 billion metric tons (MT) and 0.44 billion MT in resources and reserves, respectively. The largest gold resource was found in Region XII, while the largest gold reserve was in the Cordillera Administrative Region (Table 2.1.1).
Meanwhile, limestone was the most abundant among all non-metallic resources and reserves, with over 4.55 billion MT and 0.90 billion MT in resources and reserves, respectively. The largest limestone resource and reserve were both found in Region VII. (Table 2.1.2) Among metallic mineral products, nickel mixed sulfides posted the highest increase in production during the ten-year period from 41,383 dry metric tons (DMT) in 2012 to 75,400 DMT in 2021, or an 82.2 percent increase. On the other hand, iron ore products decreased from 1,148,232 DMT in 2012 to 77,536 DMT in 2021. For non-metallic mineral products, production of pozzolan increased from 21,142 MT in 2012 to 1,113,044 MT in 2020. On the contrary, the production of aggregates declined from 5.91 million cubic meters to 1.30 million cubic meters during the same period. (Table 2.2)
Stocks of commercially recoverable mineral resources decreased in 2021 compared to their level in 2013. Copper stocks, which had the largest drop, decreased by -60.2 percent from 8.20 million MT in 2013 to 3.26 million MT in 2021. Chromite, which had the least decrease, declined from 40.30 million MT to 35.97 million MT in the same year, or a 10.8 percent decrease. (Table 2.3)
In 2021, a total of 23.11 billion kilograms (kg) of minerals was imported. The largest share came from salt, sulfur, earths and stone, plastering materials, lime, and cement. This was followed by ores, slag, and ash. On the other hand, the least share was contributed by inorganic chemicals, organic compounds or precious metals, or rare-earth metals, of radioactive elements or of isotopes. (Table 2.4) Of the total 50.16 billion kg of minerals exported, 89.6 percent of which came from ores, slag, and ash. (Table 2.5)
Energy Resources
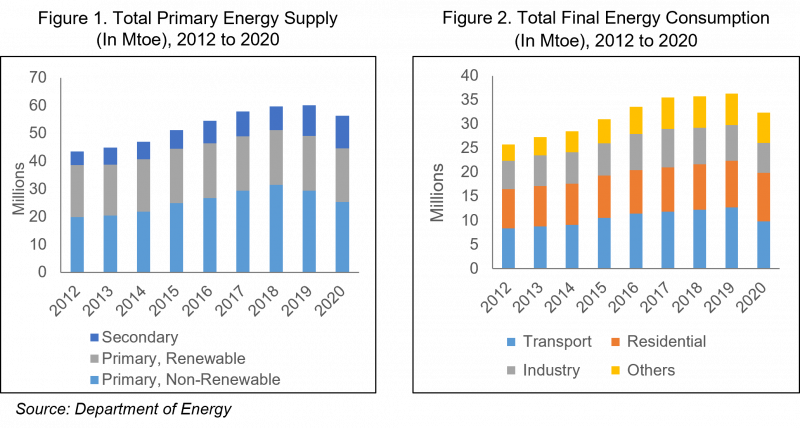
The total primary energy supply increased by 29.5 percent from 43.52 million tons of oil equivalent (Mtoe) in 2012 to 56.37 Mtoe in 2020. The largest share in the total primary energy supply, with an average of 48.3 percent, came from non-renewable energy resources, namely: coal, oil, natural gas, and condensate. This was followed by renewable energy resources such as hydro, geothermal, solar, wind, and biomass with an average of 36.5 percent. The smallest share, with an average of 15.2 percent was from secondary energy products, including kerosene, diesel, and liquefied petroleum gas, among others. (Table 2.7 and Figure 1)
Meanwhile, total final energy consumption increased by 25.6 percent during the same period, from 25.77 Mtoe in 2012 to 32.39 Mtoe in 2020. The top three consumers of energy in the country from 2012 to 2020 were transport, residential, and industry sectors. (Table 2.7 and Figure 2)
Land Resources
As of 2020, the total reforested area through government efforts reached 47,187 hectares (ha), while the non-government sector reforested area has a total of 114 ha. Reforested area decreased in 2020 compared to its level in 2012. The highest reforested area was recorded in 2015 with 360,357 ha while the lowest which had 21,925 ha was recorded in 2019. (Table 2.9)
Biological Resources
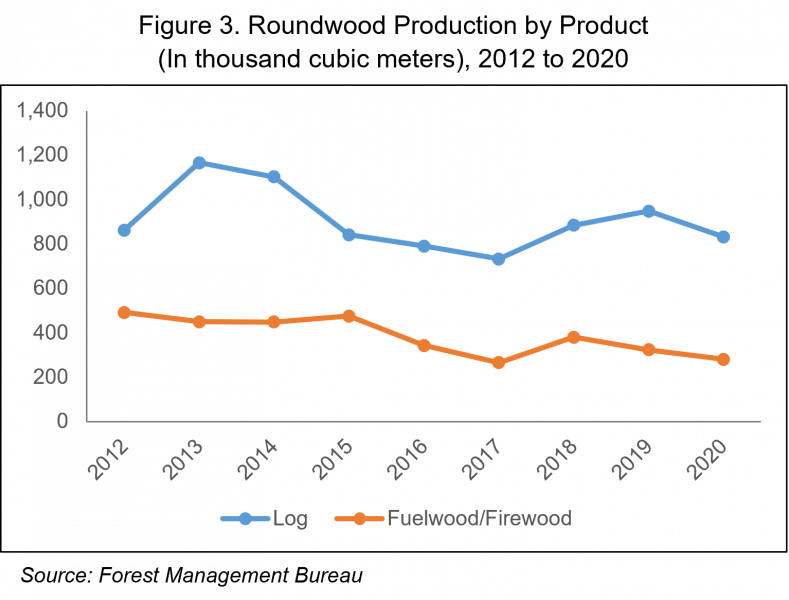
Log production decreased from 862 thousand cubic meters in 2012 to 832 thousand cubic meters in 2020. The highest log production was recorded in 2013, reaching 1.17 million cubic meters. Fuelwood production declined in 2020 compared to its level in 2012. In 2017, fuelwood production reached its lowest with a value of 266 thousand cubic meters. (Table 2.11.1 and Figure 3)
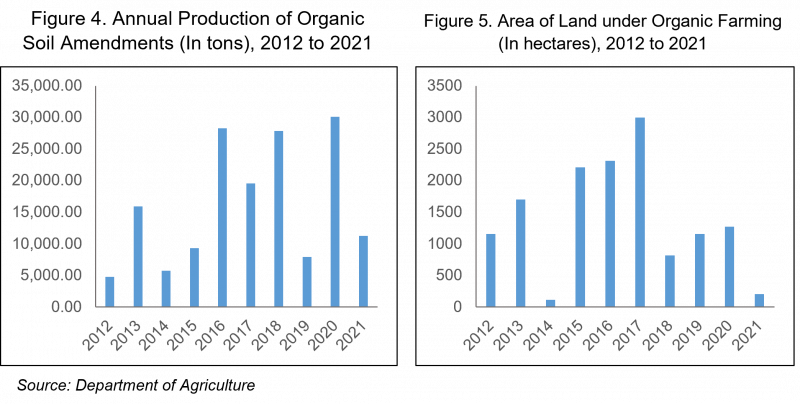
The total annual production of organic soil amendments reached 11.25 thousand tons in 2021. It went up by 136.4 percent from the 4.76 thousand tons annual production in 2012. The largest increase in production was reported in 2020 which reached 30.13 million tons. (Table 2.22.1 and Figure 4)
Meanwhile, the total area of land under organic farming decreased from 1,158.26 ha in 2012 to 206.37 ha in 2021. (Table 2.22.2 and Figure 5)
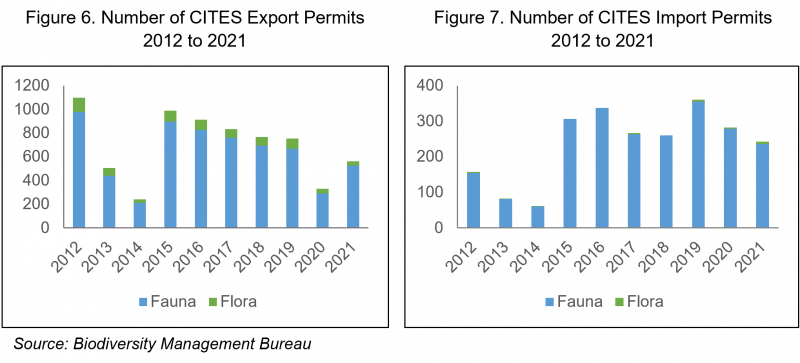
The number of export permits for species listed in the Convention on International Trade of Endangered Species (CITES) declined to 564 in 2021 compared to 1,099 in 2012. The highest number of export permits issued was in 2012 and registered its lowest since then in 2014 with 242 permits. (Table 2.30.1 and Figure 6)
On the other hand, the number of CITES import permits issued increased to 243 in 2021 compared to 158 in 2012. Similar to exports, the lowest value of import permits issued was in 2014, then it increased in 2015. (Table 2.30.2 and Figure 7)
DIVINA GRACIA L. DEL PRADO, Ph.D.
(Assistant National Statistician)
Officer-in-Charge, Deputy National Statistician
Sectoral Statistics Office