
Population growth rate increased to 1.35 percent
Surigao del Sur, one of the four provinces comprising the Caraga Region registered a total population of 501,808 persons. This figure translated to an annual growth rate of 1.35 percent, higher by 0.57 percentage point from that of the 1990 to 1995 period. The number of households also rose to 94,028, higher by 5,455 households from the 1995 figure. The average household size was 5.33, higher than the national average of five persons.
Bislig was the biggest municipality
Of the 19 municipalities comprising Surigao del Sur, Bislig contributed the biggest proportion (19.50 percent) to the total provincial population. Tandag, the provincial capital, contributed 8.83 percent. Hinatuan (7.21 percent) and Barobo (6.89 percent) followed. The other municipalities had a share of less than seven percent each. The least populous was Bayabas with 1.54 percent share to the total provincial population.
Surigao del Sur ranked second in Caraga
Among the four provinces comprising the Caraga Region (Agusan del Norte, Agusan del Sur, Surigao del Sur, Surigao del Norte) and one highly urbanized city (Butuan City), Surigao del Sur ranked second in terms of population size contributing 23.95 percent to the 2.1 million population of the region. At the national level, the province shared 0.66 percent to the total population of 76.5 million as recorded in the 2000 Census of Population and Housing.
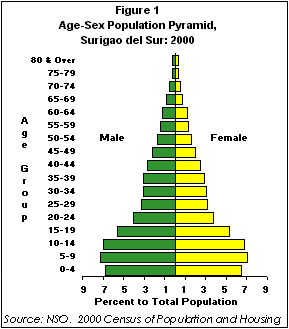
Surigao del Sur had a median age of 19 years
In 2000, Surigao del Sur had a median age of 19 years, higher than the 1995 median age of 18 years.
Male population outnumbered their female counterparts with a sex ratio of 103.94 males for every 100 females. There were more males than females in the age group 0 to 69 years. On the other hand, females dominated their male counterparts in the aged group 70 years and over.
Dependency ratio was 82
The overall dependency ratio in 2000 was 81.85. This meant that for every 100 persons aged 15 to 64 years; there were about 82 dependents (75 persons aged 0 to 14 years - young dependents; and 7 persons aged 65 years and over - old dependents). In 1995, dependency ratio was recorded at 86.0 percent.
Majority of the Post Baccalaureate Graduates were Females
Of the total household population five years old and over, almost half (49.47 percent) had completed elementary education. Twenty seven percent had finished high school while 7.84 percent finished college. Only 2.91 percent were academic degree holders. Males dominated at the elementary level with 53.32 percent. Females on the other hand, dominated at the high school, college and post baccalaureate levels with 51.91, 52.01 and 60.65 percent, respectively.
Majority were Kamayos and Surigaonons
Majority (52.6 percent) of the household population in Surigao del Sur classified themselves as Kamayo (26.4 percent) and Surigaonon (26.3 percent). About 16.3 percent considered themselves as Bisaya/Binisaya, and 12.9 percent as Cebuano. A relatively small percentage classified themselves as Boholano (4.8 percent) or belonged to other ethnic groups (13.1 percent).
Almost half were still single
Almost half of the household population 10 years old and over were single (45.56 percent) while 44.11 percent were married. The remaining ten percent were either widowed, divorced/separated, common law/live-in or with unknown marital status.
Housing unit occupancy rate up by 2.95 percent
The total housing units in Surigao del Sur was 92,593, of which 92,575 were occupied. This registered an increase of 2.95 percentage points from 1990 and recorded a ratio of 1.02 household per occupied housing unit or a ratio of 5.41 persons per occupied housing unit.
Single houses were most preferred
Majority (94.7 percent) of the occupied housing units were single houses. About three out of five housing units needed no repair/minor repair, and 37.7 percent were built from 1996-2000.
More than half of the occupied housing units had roof made of cogon/nipa/anahaw
As to the construction materials used for housing units, 54.4 percent of the occupied housing units had roof made of cogon/nipa/anahaw as compared to 65.4 percent in 1990. Majority had wood (70.1 percent) as the construction materials of the outer walls.
| (Sgd.) CARMELITA N. ERICTA Administrator | ||||||||||||||||||||||||||||||||||||||||||||||||||||||||||||||||||||||||||||||||
SURIGAO DEL SUR Surigao del Sur was formerly part of Southern Mindanao Region (Region XI). It is bounded on the north by the province of Surigao del Norte, on the west by the province of Agusan del Sur and on the south by the province of Davao Oriental. The province of Surigao del Sur lies along the Philippine Fault, leaving it vulnerable to earthquakes. The province lies outside the typoon belt but experience continuous rainfall throughout the year. Precipitation is heaviest from November to January. The administrative capital of the province is Tandag. In 1914, the Americans separated Agusan from Surigao. In 1960, the province of Surigao was divided into Surigao del Norte and Surigao del Sur by Republic Act No. 2786. The province was originally inhabited by Mamanwas, Manobos and Tagabaloyes tribes closely related to the Mandayas. Migrants from the Visayas flocked to the province, attracted by stories of gold. |
Table 1. Total Population Distribution by Municipality and Sex: Surigao del Sur, 2000
| Municipalities | Total Population | Percent | Male | Female |
| Surigao del Sur | 501,808 | 100.00 | 255,753 | 246,055 |
| Barobo | 34,558 | 6.89 | 17,267 | 16,931 |
| Bayabas | 7,706 | 1.54 | 4,002 | 3,704 |
| Bislig | 97,860 | 19.50 | 49,819 | 48,041 |
| Carmen | 9,551 | 1.90 | 4,764 | 4,787 |
| Cagwait | 18,577 | 3.70 | 9,593 | 8,984 |
| Cantilan | 26,553 | 5.29 | 13,455 | 13,098 |
| Carrascal | 13,157 | 2.62 | 6,523 | 6,634 |
| Cortes | 14,825 | 2.95 | 7,461 | 7,364 |
| Hinatuan | 36,170 | 7.21 | 18,504 | 17,666 |
| Lanuza | 10,057 | 2.00 | 5,125 | 4,932 |
| Lianga | 25,014 | 4.98 | 12,757 | 12,257 |
| Lingig | 26,487 | 5.28 | 13,718 | 12,769 |
| Madrid | 14,066 | 2.80 | 6,911 | 7,155 |
| Marihatag | 16,394 | 3.27 | 8,269 | 8,125 |
| San Agustin | 14,845 | 2.96 | 7,566 | 7,279 |
| San Miguel | 27,883 | 5.56 | 14,416 | 13,467 |
| Tagbina | 34,057 | 6.79 | 17,610 | 16,447 |
| Tago | 29,721 | 5.92 | 15,409 | 14,312 |
| Tandag | 44,327 | 8.83 | 22,224 | 22,103 |
Source: NSO, 2000 Census of Population and Housing
Table 2. Total Population by Age Group, Sex and Sex Ratio: Surigao del Sur, 2000
| Age Group | Total Population | Male | Female | Sex Ratio |
| Surigao del Sur | 501,808 | 255,753 | 246,055 | 103.94 |
| Under 1 | 13,065 | 6,698 | 6,367 | 105.20 |
| 1 to 4 | 53,301 | 27,361 | 25,940 | 105.48 |
| 5 to 9 | 71,475 | 36,231 | 35,244 | 102.80 |
| 10 to 14 | 68,790 | 34,722 | 34,068 | 101.92 |
| 15 to 19 | 54,345 | 27,918 | 26,427 | 105.64 |
| 20 to 24 | 38,898 | 20,068 | 18,830 | 106.57 |
| 25 to 29 | 32,352 | 16,556 | 15,796 | 104.81 |
| 30 to 34 | 30,888 | 15,598 | 15,290 | 102.01 |
| 35 to 39 | 29,819 | 15,334 | 14,485 | 105.86 |
| 40 to 44 | 25,969 | 13,370 | 12,599 | 106.12 |
| 45 to 49 | 21,250 | 11,001 | 10,249 | 107.34 |
| 50 to 54 | 16,722 | 8,537 | 8,185 | 104.30 |
| 55 to 59 | 13,868 | 7,128 | 6,740 | 105.76 |
| 60 to 64 | 11,835 | 5,966 | 5,869 | 101.65 |
| 65 to 69 | 7,825 | 3,949 | 3,876 | 101.88 |
| 70 to 74 | 5,474 | 2,634 | 2,840 | 92.75 |
| 75 to 79 | 3,174 | 1,473 | 1,701 | 86.60 |
| 80 & Over | 2,758 | 1,209 | 1,549 | 78.05 |
Source: NSO, 2000 Census of Population and Housing
Table 3. Household Population 5 Years Old and Over by Highest Educational Attainment and Sex: Surigao del Sur, 2000
| Highest Educational Attainment | Household Population 5 Years Old & Over | Male | Female |
| Surigao del Sur | 434,774 | 221,100 | 213,674 |
| No Grade Completed | 26,540 | 14,186 | 12,354 |
| Pre-School | 11,268 | 5,725 | 5,543 |
| Elementary | 215,065 | 114,675 | 100,390 |
| High School | 115,441 | 55,514 | 59,927 |
| Post Secondary | 10,251 | 5,172 | 5,079 |
| College Undergraduate | 34,086 | 16,359 | 17,727 |
| Academic Degree Holder | 12,651 | 4,940 | 7,711 |
| Post Baccalaureate | 2,277 | 896 | 1,381 |
| Not Stated | 7,195 | 3,633 | 3,562 |
Source: NSO, 2000 Census of Population and Housing
Table 4. Total Population 10 Years Old and Over by Age Group and Marital Status: Surigao del Sur, 2000
| Age Group | Total Population 10 Yrs Old & Over | Single | Married | Widowed | Divorced | Others | Unknown |
| Surigao del Sur | 363,967 | 165,821 | 160,560 | 15,367 | 2,776 | 17,256 | 2,187 |
| Below 20 | 123,135 | 118,009 | 2,086 | 108 | 79 | 1,530 | 1,323 |
| 20 - 24 | 38,898 | 26,128 | 8,959 | 80 | 213 | 3,209 | 309 |
| 25 - 29 | 32,352 | 10,913 | 17,874 | 168 | 273 | 2,947 | 177 |
| 30 - 34 | 30,888 | 4,784 | 22,991 | 354 | 343 | 2,339 | 77 |
| 35 - 39 | 29,819 | 2,441 | 24,499 | 525 | 360 | 1,950 | 44 |
| 40 - 44 | 25,969 | 1,245 | 21,941 | 820 | 398 | 1,521 | 44 |
| 45 - 49 | 21,250 | 738 | 17,813 | 1,075 | 341 | 1,259 | 24 |
| 50 - 54 | 16,722 | 498 | 13,659 | 1,411 | 272 | 854 | 28 |
| 55 - 59 | 13,868 | 339 | 10,949 | 1,740 | 186 | 628 | 26 |
| 60 - 64 | 11,835 | 254 | 8,682 | 2,282 | 122 | 460 | 35 |
| 65 - 69 | 7,825 | 155 | 5,388 | 1,910 | 74 | 270 | 28 |
| 70 - 74 | 5,474 | 129 | 3,216 | 1,901 | 55 | 151 | 22 |
| 75 - 79 | 3,174 | 81 | 1,569 | 1,401 | 32 | 76 | 15 |
| 80 & over | 2,758 | 107 | 934 | 1,592 | 28 | 62 | 35 |
Source: NSO, 2000 Census of Population and Housing
Table 5. Household Population by Ethnicity and Sex: Surigao del Sur, 2000
| Ethnicity | Both Sexes | Male | Female |
| Surigao del Sur | 501,135 | 255,158 | 245,977 |
| Surigaonon | 131,628 | 66,587 | 65,041 |
| Cebuano | 64,774 | 33,362 | 31,412 |
| Kamayo | 132,069 | 66,879 | 65,190 |
| Boholano | 23,937 | 12,433 | 11,504 |
| Bisaya/Binisaya | 81,923 | 41,225 | 40,668 |
| Others | 65,624 | 34,072 | 31,582 |
| Other Foreign Ethnicity | 205 | 107 | 98 |
| Not Reported | 975 | 493 | 482 |
Source: NSO, 2000 Census of Population and Housing
Table 6. Total Occupied Housing Units, Households, Household Population and Ratio of Household and Household Population to Occupied Housing Unit by Type of Building: Surigao del Sur, 2000
| TYPE OF BUILDING | Occupied Housing Unit | Household | Household Population | RATIO OF HOUSEHOLDS AND HOUSEHOLD POPULATION | |
| Household to Occupied Housing Unit | Household Population to Occupied Housing Unit | ||||
| Surigao del Sur | 92,575 | 94,028 | 501,135 | 1.02 | 5.41 |
| Single House | 87,665 | 88,937 | 475,051 | 1.01 | 5.42 |
| Duplex | 2,408 | 2,487 | 12,524 | 1.03 | 5.20 |
| Multi-Unit Residential | 1,529 | 1,624 | 7,928 | 1.06 | 5.19 |
| Commercial/Industrial/Agriculture | 202 | 205 | 926 | 1.01 | 4.58 |
| Institutional Living Quarters | 14 | 14 | 54 | 1.00 | 3.86 |
| Other Housing Unit | 11 | 11 | 57 | 1.00 | 5.18 |
| Not Reported | 746 | 750 | 4,595 | 1.01 | 6.16 |
Source: NSO, 2000 Census of Population and Housing
TECHNICAL NOTES Average Household Size - average number of people who live in the household Growth Rate - the rate at which the population is increasing (or decreasing) in a given year due to natural increase and net migration, expressed as a percentage of the base population Median Age - the age at which exactly half of the population is young and half is old Sex Ratio -the ratio of males to females in a given population expressed as the number of males per 100 females Age-Dependency Ratio - the ratio of persons in the "dependent" ages (under 15 years and over 64 years) to those in the "economically productive" ages (15 to 64 years old) in the population Household - a social unit consisting of a person or a group of persons who sleep in the same housing unit and have common arrangements in the preparation and consumption of food --o0o-- The 2000 Census of Population and Housing (Census 2000) was undertaken by the National Statistics Office (NSO) in May 2000, as mandated by Commonwealth Act No.591, Batas Pambansa Blg. 72 and Executive Order No. 121. It was the 11th census of population and 5th census of housing undertaken in this country since the first census in 1903. It was designed to take an inventory of the total population and housing units all over the Philippines and to collect information about their characteristics. Census day for the Census 2000 was May 1, 2000 (12:01 a.m.). Enumeration started on May 1, 2000 and lasted for about 30 days. |
--- o0o ---