
| Total Manufacturing | November 2010 | October 2010 |
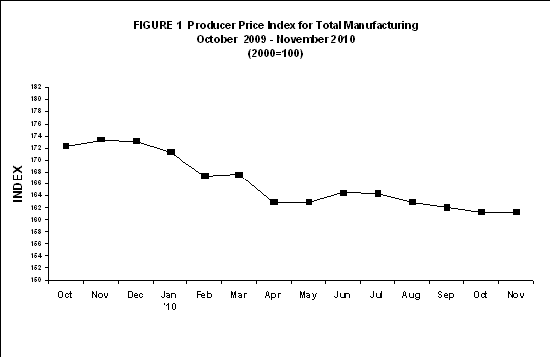
| Producer Price Index (2000=100) | 161.3 | 161.3r |
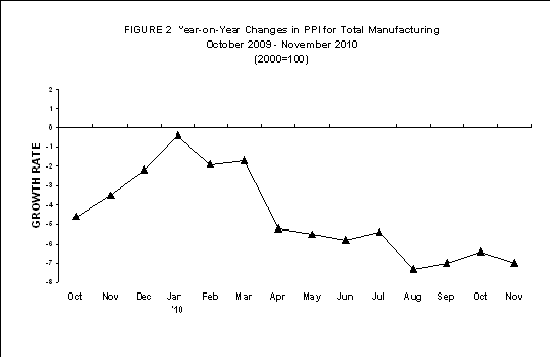
| Year-on-Year Growth | -7.0 | -6.4r |
| Month-on-Month Growth | 0.01 | -0.4r |
r-revised
- Producer Price Index continue to posts decrements
The Producer Price Index (PPI, 2000=100) for the manufacturing industry further decelerated to -7.0 percent in November 2010 compared with the year ago level, according to the preliminary results of the monthly Producer Price Survey. This was brought about by significant decreases posted by three major sectors namely: machinery except electrical (-19.5%), electrical machinery (-18.4%) and furniture and fixtures (-12.1%). However, increases in PPI were observed in eleven major sectors led by leather products (14.9%) and footwear and wearing apparel (11.4%). Refer to Tables 1 and 1-B.
On a month-on month basis, PPI slightly inched up to .01 percent in November 2010, due to price increases of 17 major sectors led by petroleum products (5.1%). Refer to Tables 1 and 1-B.
- Response Rate
The response rate for November 2010 is 87.2 percent, which corresponds to the retrieval of 280 sample establishments� reports. Refer to Table 2.
Response Rates for Total Manufacturing
(In percent)
| November 2010 | October 2010 (revised) |
| 87.2 | 96.3r |
The National Statistics Office generates various price indices, one of this is the Producer Price Index. (PPI). The PPI is generated through the results of the Producers Price Survey (PPS) conducted nationwide. The survey gathers monthly actual producer prices of selected products included in the market basket. PPI utilizes the Paasche-type method of index computation with weights computed from the production concentration ratio of the Census of Philippine Business and Industry (CPBI)/ Annual Survey of Philippine Business and Industry (ASPBI). The weights are updated as soon as new results of the ASPBI/CPBI are available and applied at the beginning of each survey year. Hence, the weights of the major sectors and sub-sectors for the 2009 PPI were computed from the results of the 2006 CPBI for Manufacturing Establishments of total employment of 20 and over, which is the latest census results. Moreover, for industry classification, the 2010 PPI utilizes the amended 1994 Philippine Standard Industry Classification. There are 20 major sectors covered by the 2010 PPS with three consisting of subsectors. Non-responding sample establishments are estimated using cold-deck imputation method. Revisions to the preliminary estimates are done upon receipt of actual reports from late respondents.
TABLE 1-A. PRODUCER PRICE INDEX, OCTOBER 2010 - NOVEMBER 2010
TABLE 1-B. PRODUCER PRICE INDEX, OCTOBER 2010 - NOVEMBER 2010
Note: * - new sector in the 2000-based series Sectors are ranked according to their contribution to the overall 2000-based growth rate. Year-on-year growth rates are computed by dividing the current month index by previous year same month index less 1. Month-on-month growth rates are computed by dividing the current month index by previous month index less 1 Source: National Statistics Office Manila, Philippines |
||||||||||||||||||||||||||||||||||||||||||||||||||||||||||||||||||||||||||||||||||||||||||||||||||||||||||||||||||||||||||||||||||||||||||||||||||||||||||||||||
| Attachment | Size |
|---|---|
|
|
35.91 KB |
|
|
6.31 KB |