
A. TOTAL EXTERNAL TRADE AND BALANCE OF TRADE
1. Total external trade decreased by 3.5 percent
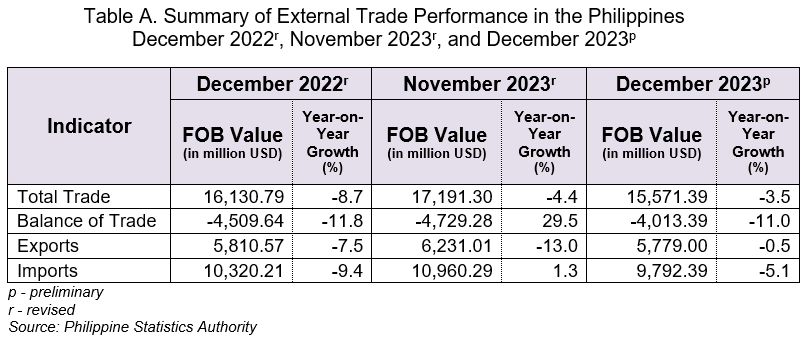
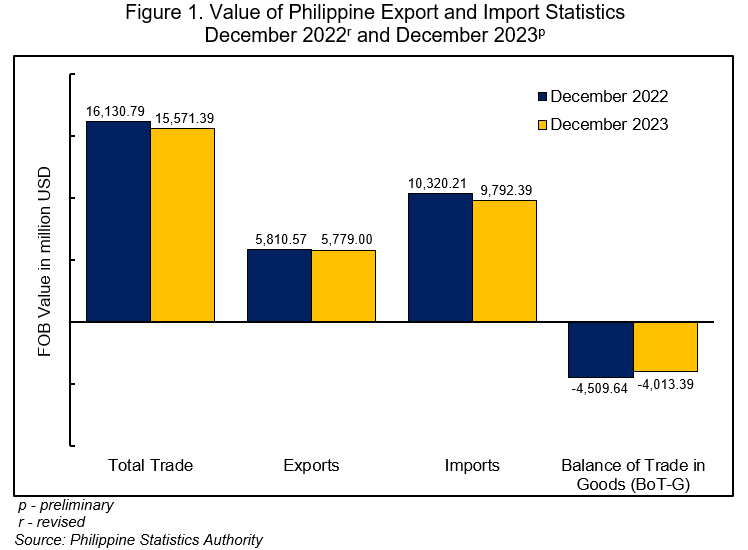
In December 2023, the country’s total external trade in goods amounted to USD 15.57 billion, which indicates an annual decline of 3.5 percent from the USD 16.13 billion total external trade in the same period of the previous year. In November 2023, total external trade in goods registered an annual decrease of 4.4 percent, while an annual decrease of 8.7 percent was registered in December 2022. (Figure 1, and Tables A and 1)
Of the total external trade in December 2023, 62.9 percent were imported goods, while the remaining were exported goods.
2. Trade deficit posted an annual decrease
The balance of trade in goods (BoT-G) is the difference between the value of exports and imports. The BoT-G in December 2023 amounted to USD -4.01 billion, indicating a trade deficit with an annual decrease of 11.0 percent. In November 2023, the trade deficit recorded an annual increase of 29.5 percent, while an annual decline of 11.8 percent was posted in December 2022. (Figure 1, and Tables A and 4)
B. EXPORTS
1. Sales from export posted a negative growth
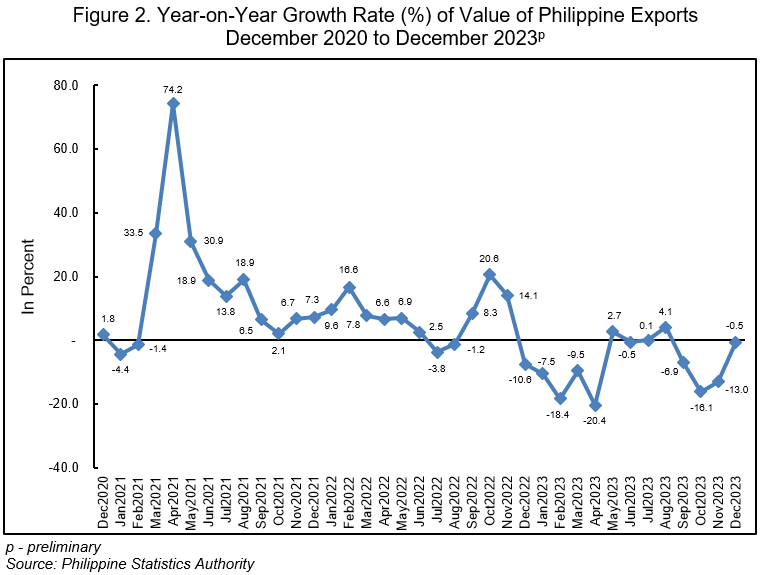
The country’s total export sales in December 2023 amounted to USD 5.78 billion, indicating an annual decrease of 0.5 percent from the USD 5.81 billion total exports in the same month of the previous year. In November 2023, the total exports recorded an annual decrease of 13.0 percent, while it posted an annual decline of 7.5 percent in December 2022. (Figures 1 and 2, and Tables A and 3)
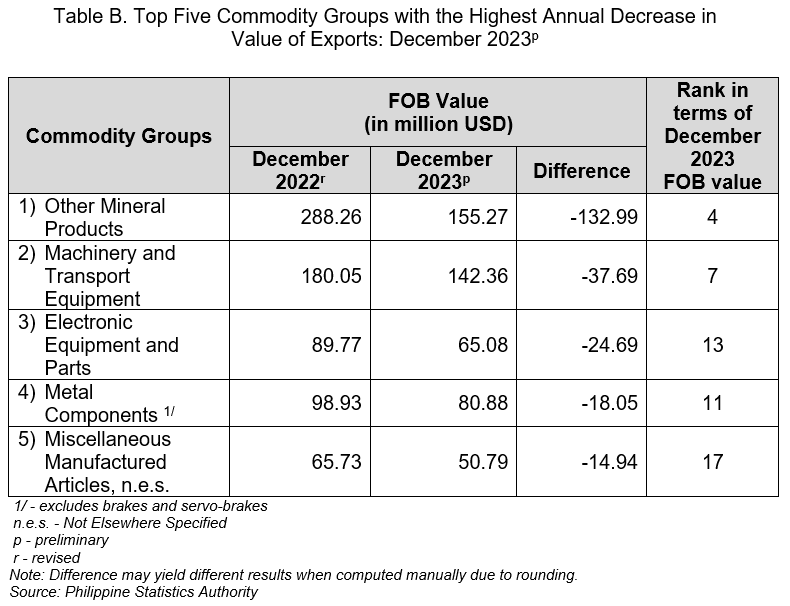
The commodity group with the highest annual decrement in the value of exports in December 2023 was other mineral products with USD 132.99 million. This was followed by machinery and transport equipment with an annual decline of USD 37.69 million, and electronic equipment and parts with an annual decrease of USD 24.69 million. (Tables B and 5)
2. Year-to-date annual total exports decreased
The year-to-date annual total value of exports, that is from January to December 2023, amounted to USD 73.52 billion. This represents an annual decrease of 7.6 percent from the year-to-date annual total export value of USD 79.57 billion in January to December 2022. (Tables 3 and 6)
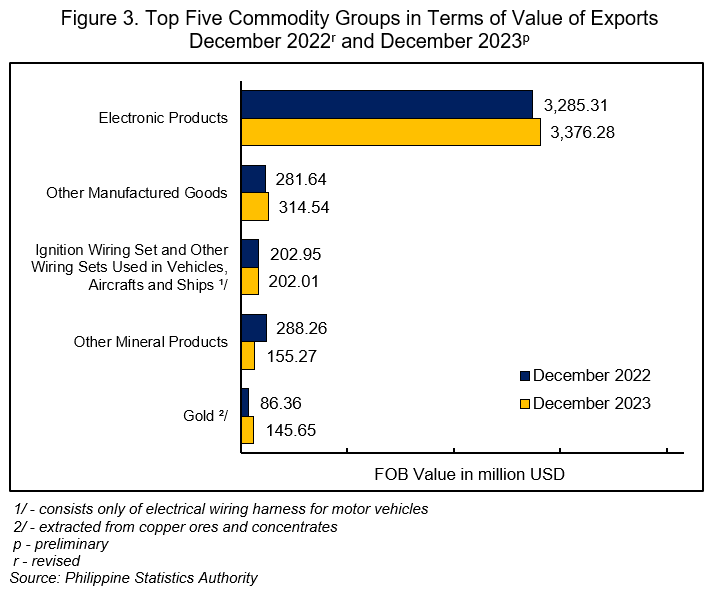
3. Electronic products commodity group remained the highest on export sales
By commodity group, electronic products continued to be the country’s top exports in December 2023 with total earnings of USD 3.38 billion or 58.4 percent of the country’s total exports during the period. This was followed by other manufactured goods with an export value of USD 314.54 million (5.4%), and ignition wiring set and other wiring sets used in vehicles, aircrafts and ships with USD 202.01 million (3.5%). (Figure 3 and Table 5)
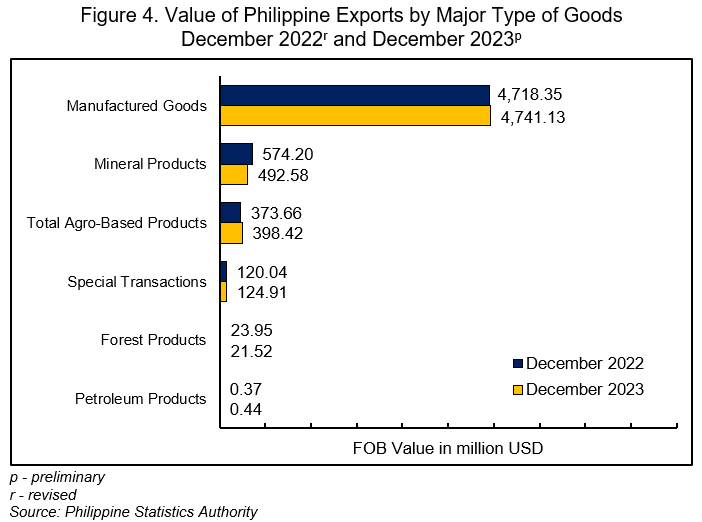
4. Manufactured goods still comprised the largest portion of total exports among major types of goods
By major type of goods, exports of manufactured goods contributed the largest to the country’s total exports in December 2023 amounting to USD 4.74 billion or a share of 82.0 percent. This was followed by mineral products with a share of USD 492.58 million (8.5%), and total agro-based products, which contributed USD 398.42 million (6.9%). (Figure 4 and Table 7)
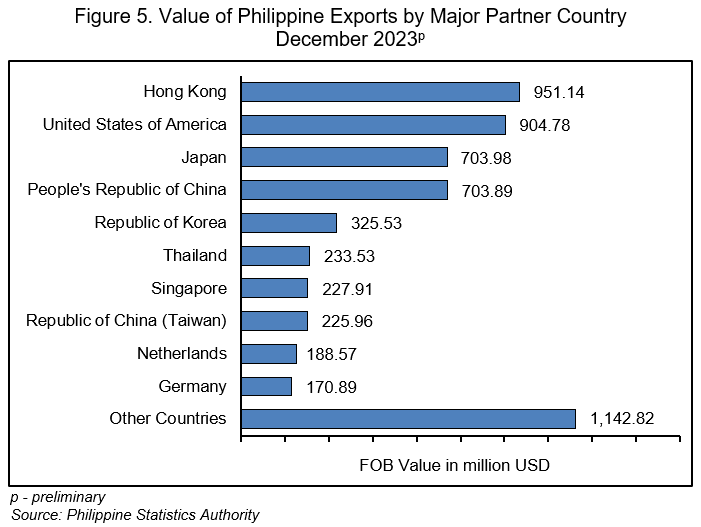
5. Hong Kong contributed the highest to the total export value
By major trading partner, exports to Hong Kong comprised the highest export value amounting to USD 951.14 million or a share of 16.5 percent to the country’s total exports in December 2023.
Completing the top five major export trading partners for this month with their export values and percent shares to the total exports were:
a. United States of America (USA), USD 904.78 million (15.7%);
b. Japan, USD 703.98 million (12.182%);
c. People’s Republic of China, USD 703.89 million (12.180%); and
d. Republic of Korea, USD 325.53 million (5.6%). (Figure 5 and Table 9)
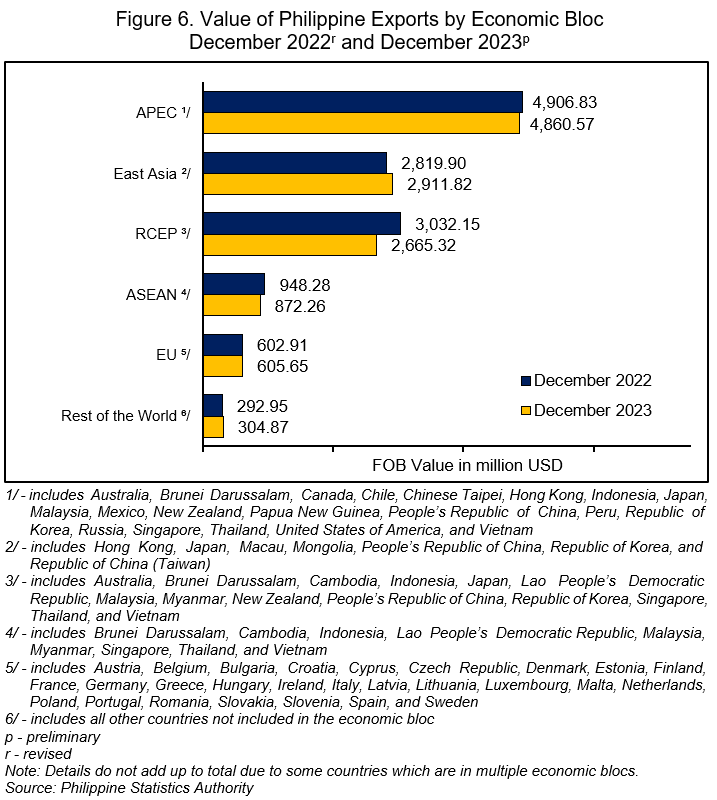
6. Majority of exports were for Asia-Pacific Economic Cooperation (APEC) countries
By economic bloc, majority of the country’s merchandise exports in December 2023 went to APEC countries with a share of USD 4.86 billion or 84.1 percent to the country’s total exports. This was followed by East Asia at USD 2.91 billion (50.4%), and Regional Comprehensive Economic Partnership (RCEP), valued at USD 2.67 billion (46.1%). (Figure 6, and Tables 10 and 18)
7. East Asia contributed the highest export value by geographic region
By geographic region, East Asia comprised the highest export value in December 2023 amounting to USD 2.91 billion (50.4%). This was followed by Northern America with an export value of USD 942.44 million (16.3%) and Southeast Asia with USD 872.27 million (15.1%) worth of exports. (Figure 7 and Table 19)

C. IMPORTS
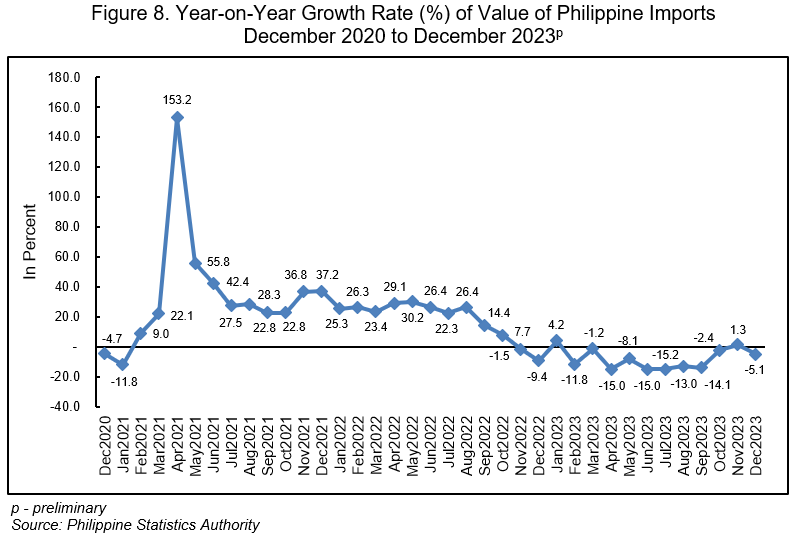
1. Import value decreased in December 2023
The total imported goods in December 2023 amounted to USD 9.79 billion, indicating an annual decrease of 5.1 percent from the USD 10.32 billion import value in the same month of the previous year. In November 2023, import value recorded an annual increase of 1.3 percent, while in December 2022, it exhibited an annual decrease of 9.4 percent. (Figures 1 and 8, and Tables A and 2)
In December 2023, the commodity group with the highest annual decrement in the value of imported goods was mineral fuels, lubricants and related materials with USD 472.37 million. This was followed by electronic products, which declined by USD 328.45 million, and industrial machinery and equipment with an annual decrease of USD 48.99 million. (Tables C and 11)

2. Year-to-date annual total import value decreased
The year-to-date annual total import value, that is from January to December 2023, amounted to USD 125.95 billion. This represents an annual decrement of 8.2 percent from the total import value of USD 137.22 billion in January to December 2022. (Tables 2 and 12)
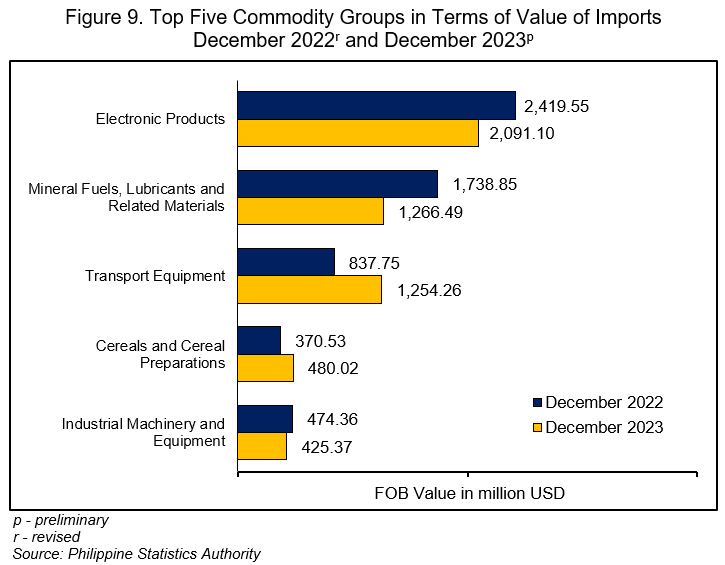
3. Electronic products recorded the highest import value among commodity groups
The commodity group with the highest import value in December 2023 was electronic products, which amounted to USD 2.09 billion or a share of 21.4 percent to the country’s total imports. This was followed by mineral fuels, lubricants and related materials at USD 1.27 billion (12.9%), and transport equipment at USD 1.25 billion (12.8%). (Figure 9 and Table 11)
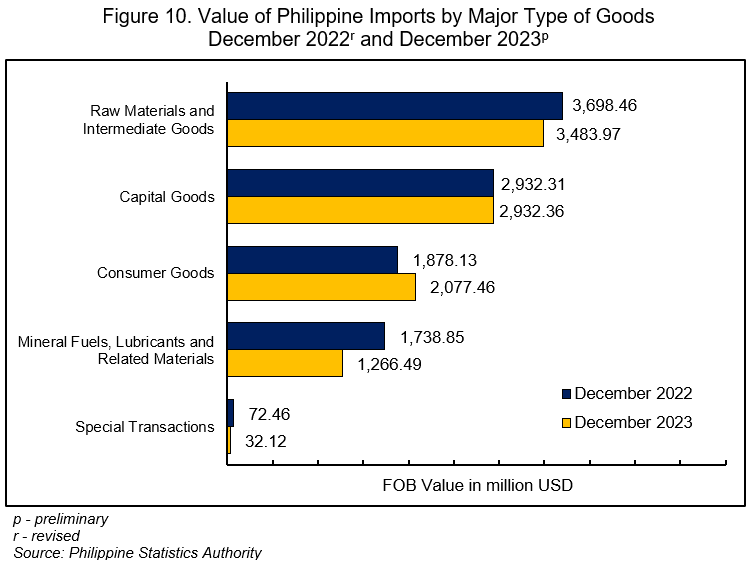
4. Imports of raw materials and intermediate goods contributed the highest among major types of goods
By major type of goods, imports of raw materials and intermediate goods accounted for the largest share of the country’s total imports in December 2023 amounting to USD 3.48 billion (35.6%). Imports of capital goods ranked second with a share of USD 2.93 billion (29.9%), followed by consumer goods with an import value of USD 2.08 billion (21.2%). (Figure 10 and Table 13)
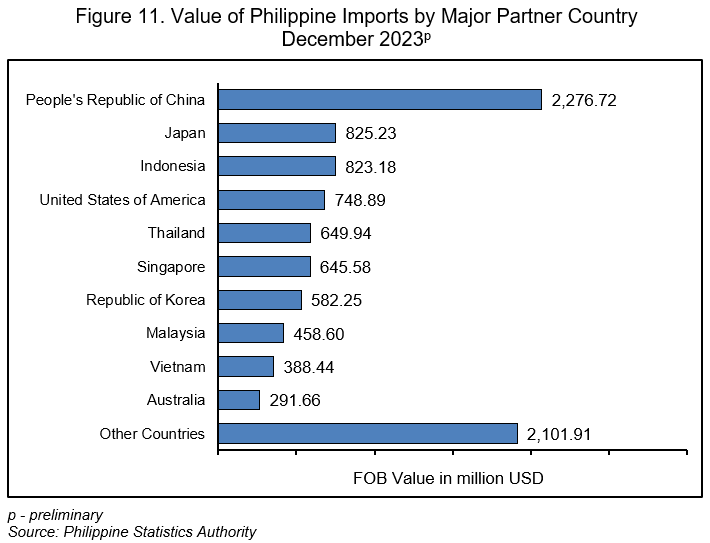
5. People’s Republic of China had the highest import value
People’s Republic of China was the country’s largest supplier of imported goods valued at USD 2.28 billion or 23.2 percent of the country’s total imports in December 2023.
Completing the top five major import trading partners for this month with their corresponding import values and percent shares to the total imports were:
a. Japan, USD 825.23 million (8.43%);
b. Indonesia, USD 823.18 million (8.41%);
c. USA, USD 748.89 million (7.6%); and
d. Thailand, USD 649.94 million (6.6%). (Figure 11 and Table 15)
6. Imports came largely from APEC member countries
By economic bloc, APEC countries were the largest suppliers of the country’s imported goods in December 2023 with a share of USD 8.29 billion (84.6%). This was followed by RCEP with an import value of USD 7.02 billion (71.7%) and East Asia with USD 4.09 billion (41.8%). (Figure 12, and Tables 16 and 18)

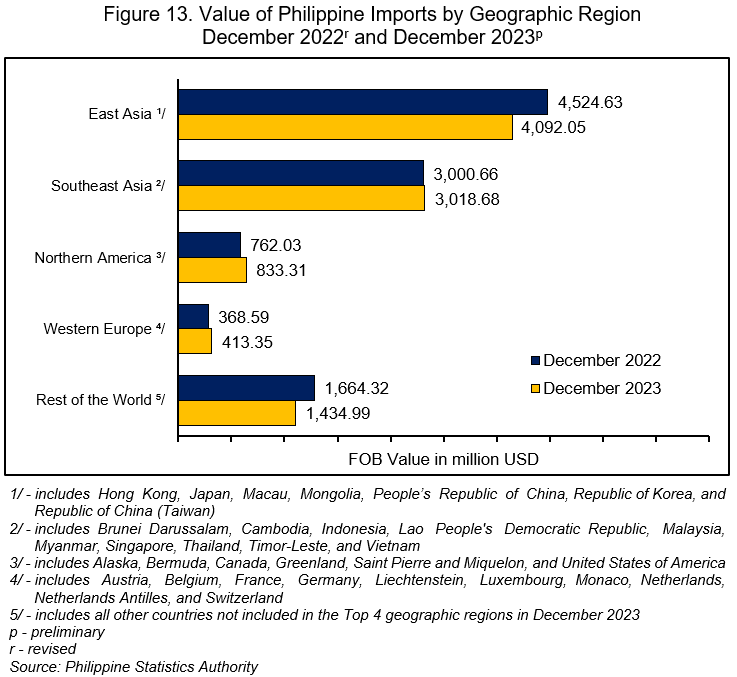
7. East Asia contributed the highest import value among geographic regions
By geographic region, East Asia had the highest import value of USD 4.09 billion (41.8%) in December 2023. This was followed by Southeast Asia with an import value amounting to USD 3.02 billion (30.8%) and Northern America valued at USD 833.31 million (8.5%). (Figure 13 and Table 19)
CLAIRE DENNIS S. MAPA, PhD
Undersecretary
National Statistician and Civil Registrar General
| Attachment | Size |
|---|---|
|
|
361.07 KB |
|
|
131.47 KB |
|
|
135.49 KB |