
Table A. Year-on-Year Growth Rates of the GRPI in NCR
All Items, In Percent
(2012=100)
|
|
|
|
|---|---|---|---|
| 5.1 | 4.4 | 3.9 | 5.3 |
*Year-on-year change of average GRPI for January to July, 2023 vs. 2022
Source: Philippine Statistics Authority, Retail Price Survey of Selected Commodities for the
Generation of Retail Price Index
Figure 1. Growth Rates of the GRPI in NCR, All Items
July 2022 - July 2023
(2012=100)
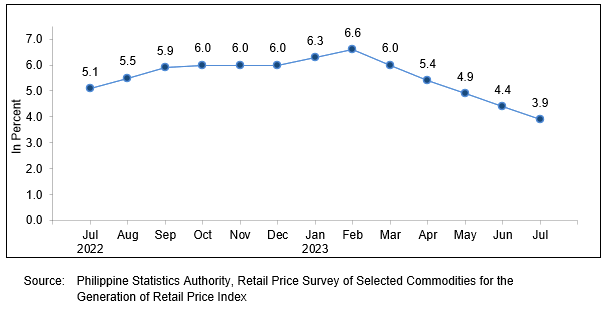
GRPI in NCR continued to increase at a slower pace in July 2023
The annual growth of GRPI in NCR continued its downtrend as it decelerated further to 3.9 percent in July 2023 from 4.4 percent in June 2023, marking its fifth consecutive month of deceleration. In July 2022, its year-on-year increment was recorded at 5.1 percent. (Figure 1, and Tables A, 2, and 4)
The downtrend in the annual growth of GRPI in NCR was primarily influenced by the slower annual increase in the heavily-weighted food index at 8.2 percent in July 2023 from 9.5 percent in the previous month. In addition, slower annual increments were observed in the indices of the following commodity groups during the month:
Moreover, compared with their annual growth rates in the previous month, lower annual hikes were observed in the indices of the following commodity groups during the month:
a. Beverages and tobacco, 6.1 percent from 6.4 percent;
b. Crude materials, inedible except fuels, 4.0 percent from 4.5 percent;
c. Chemicals, including animal and vegetable oils and fats, 3.1 percent from 3.7 percent; and
d. Manufactured goods classified chiefly by materials, 2.5 percent from 2.6 percent.
On the other hand, the index of mineral fuels, lubricants and related materials recorded a slower annual decline of -15.3 percent during the month from -16.1 percent in the previous month.
Meanwhile, the indices of machinery and transport equipment, and miscellaneous manufactured articles retained their previous month’s annual growth rates at 1.4 percent and 1.7 percent, respectively. (Table 2)
See more at the General Retail Price Index Main page.
| Attachment | Size |
|---|---|
|
|
65.64 KB |
|
|
733.68 KB |
|
|
1.17 MB |