
Based on the 2020 Census of Population and Housing (2020 CPH), the Philippines had a household population of 108,667,043 persons. Of this total, the household population ten years old and over comprised 79.4 percent or 86,333,513 persons.
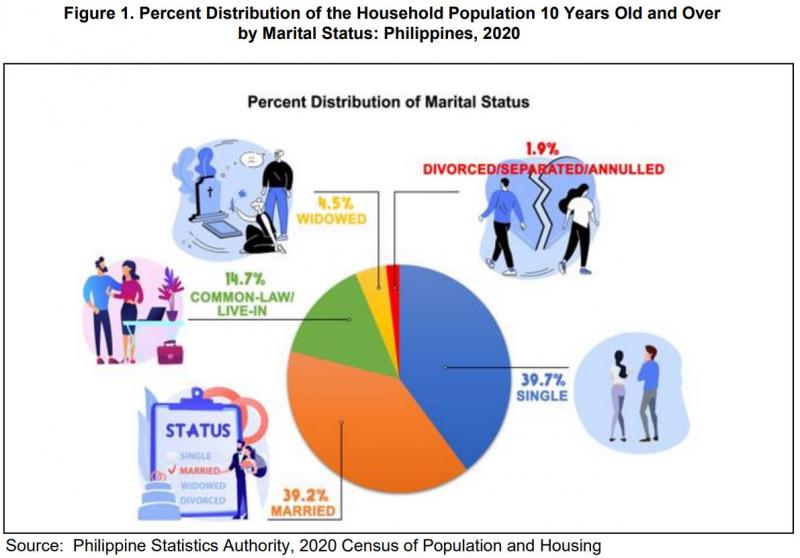
Of the 86.33 million persons aged ten years and over in 2020, 34.26 million persons (39.7%) were never married, while 33.87 million persons (39.2%) were married. The rest of the population was categorized as follows: in common-law/live-in marital arrangement with 14.7 percent, widowed with 4.5 percent, and divorced/separated/annulled with 1.9 percent. (Figure 1)
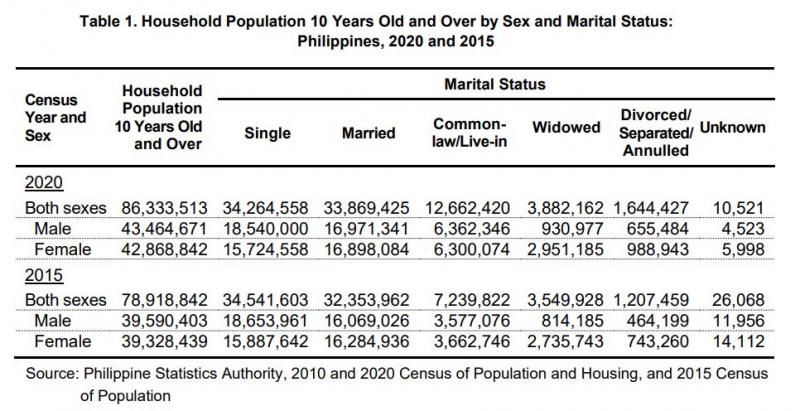
Number of married persons increases by 1.52 million from 32.35 million in 2015 to 33.87 million in 2020 while couples in common-law/live-in marital arrangements increase by 5.5 percentage points
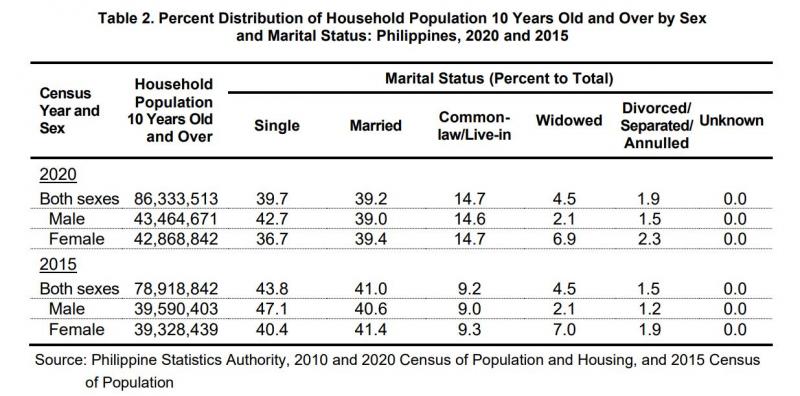
A decline of 4.1 percentage points in single or never-married persons was observed between 2015 and 2020 from 43.8 percent in 2015 to 39.7 percent in 2020. (Table 2)
The percentage of married persons in 2020 was very close to that in 2015. However, despite such close ratios, their number increased by 1.52 million from 32.35 million in 2015 to 33.87 million in 2020. (Tables 1 and 2)
Among individuals in common-law/live-in marital arrangements, the percentage increased to 14.7 percent in 2020 from 9.2 percent in 2015. The same trend was observed among those divorced/separated/annulled, registering 1.9 percent in 2020 from 1.5 percent in 2015. On the other hand, the percentage of widows remained the same in 2015 and 2020 at 4.5 percent. (Table 2)
In terms of distribution by sex, 42.7 percent of households were composed of single men, while 36.7 percent were composed of single women. On the other hand, 39.0 percent of males and 39.4 percent of females were married. Similarly, 14.6 percent of males and 14.7 percent of females were in common-law/live-in marital arrangements. The remaining percentage was distributed between divorced and widowed, reaching 1.5 percent for divorced/separated/annulled males and 2.3 percent for their female counterparts. Meanwhile, the percentage of widowed males and females was 2.1 percent and 6.9 percent, respectively. (Table 2)
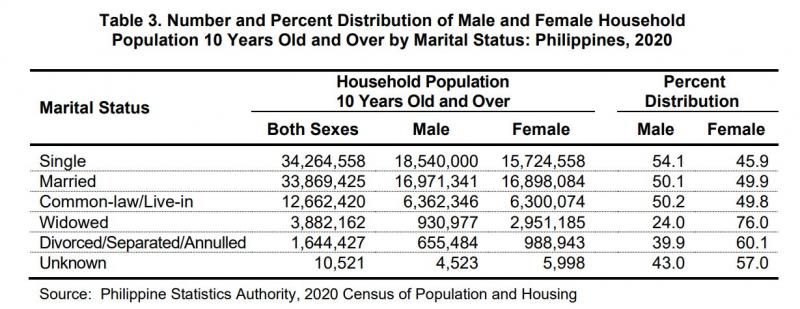
There are more males than females among the never-married persons, married persons, and common-law/live-in marital arrangements
Among the never-married persons, a higher proportion of males (54.1%) were reported in 2020. The same trend was observed among married persons and those in common-law/live-in marital arrangements with 50.1 percent and 50.2 percent, respectively. (Table 3)
Meanwhile, the proportion of females was higher than males among widowed (76.0%) and divorced/separated/annulled (60.1%). (Table 3)
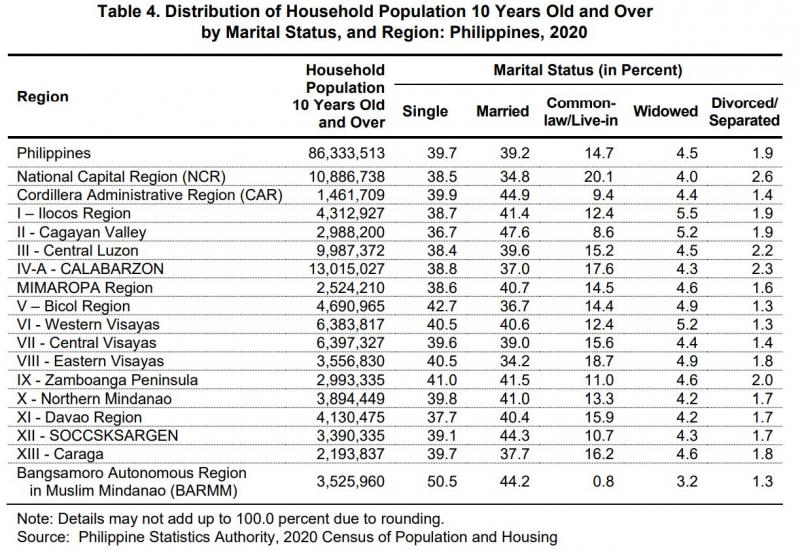
BARMM posts the highest proportion of single individuals; Region II for married individuals
By region, the proportion of single or never-married individuals was highest in Bangsamoro Autonomous Region in Muslim Mindanao (BARMM) at 50.5 percent. This was followed by Region V-Bicol with 42.7 percent and Region IX-Zamboanga Peninsula with 41.0 percent. Meanwhile, Region II- Cagayan Valley posted the lowest proportion of never-married individuals at 36.7 percent. (Table 4)
Region II posted the highest proportion of married persons with 47.6 percent. This was followed by Cordillera Administrative Region (CAR) with 44.9 percent, Region XII–SOCCSKSARGEN with 44.3 percent, BARMM with 44.2 percent, and Region IX with 41.5 percent. The lowest proportion of married persons, on the other hand, was observed in Region VIII-Eastern Visayas at 34.2 percent. (Table 4)
Common-law/live-in marital arrangements and divorced/separated/annulled are most prevalent in NCR while the proportion of widowed is highest in Region I
The proportion of persons in common-law/live-in marital arrangements was highest in the National Capital Region (NCR) at 20.1 percent, followed by Region VIII at 18.7 percent, and Region IV-A-CALABARZON at 17.6 percent. The lowest proportion was in BARMM with 0.8 percent. (Table 4)
Meanwhile, the prevalence of divorced/separated/annulled individuals was highest in the NCR at 2.6 percent. (Table 4)
On the other hand, the proportion of widowed persons was highest in Region I-Ilocos Region, at 5.5 percent, followed by Region II and Region VI-Western Visayas with 5.2 percent each. The lowest proportion of widowed persons was in BARMM with 3.2 percent. (Table 4)
Three in every five persons aged 30-54 years are married
- Among married persons, 61.0 percent were aged 30-54 years, broken down with the following age groups: 40-44 years with 13.2 percent, 35-39 years with 13.1 percent, 30-34 years with 12.1 percent, 45-49 years with 11.9 percent, and 50-54 years with 10.7 percent. (Figure 2)
- Among married males, the highest proportion was reported in the age group 40-44 years with 6.7 percent. Meanwhile, married females had a higher proportion among age group 35-39 years with 6.6 percent. (Figure 2)
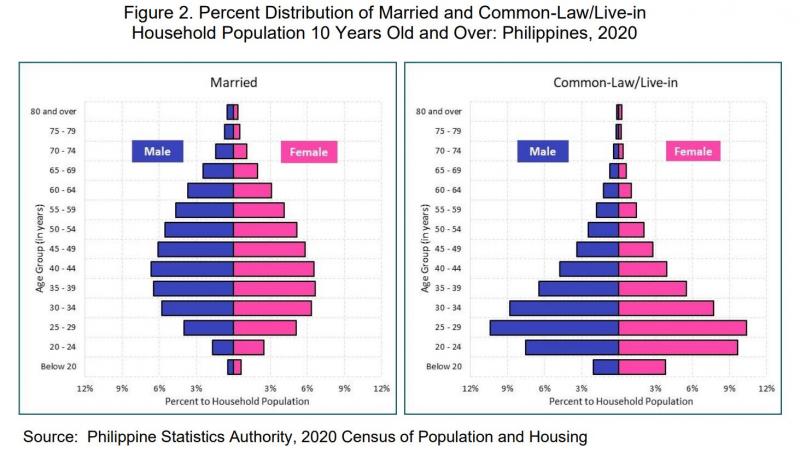
- Among the age groups of individuals in common-law/live-in arrangements, the highest proportion was reported in age group 25-29 years with 20.8 percent. The same distribution was reported among males and females with 10.4 percent each. (Figure 3)
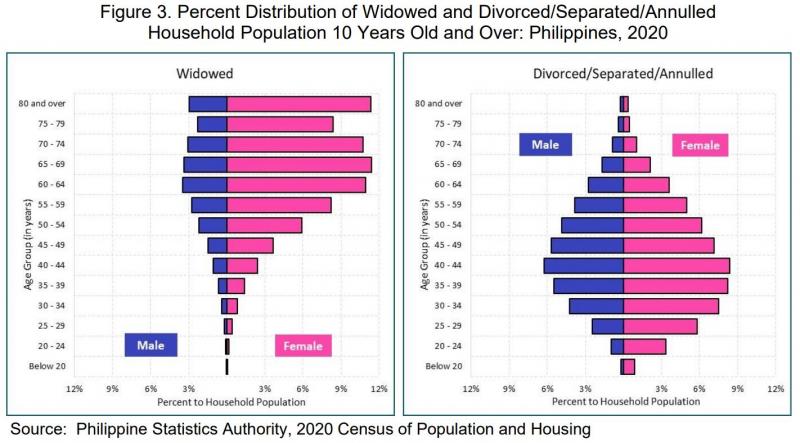
- The proportion of persons reported as widowed was higher among females than males across all age groups. The same trend was observed among individuals who were divorced/separated/annulled. (Figure 3)
The statistics presented in this report were based on the information provided by the respondent or any responsible household member who answered the questions and gave correct information about all the household members.
In the 2020 CPH, data on the marital status of every household member 10 years old and over were collected by asking the respondents, “Is _______ single, married, common-law/live-in, widowed, or divorced/separated/annulled?”.
DENNIS S. MAPA, Ph.D.
Undersecretary
National Statistician and Civil Registrar General
| Attachment | Size |
|---|---|
|
|
612.82 KB |
|
|
63.11 KB |
|
|
441.68 KB |