More than 60 percent of the population 15 years old and over were in the labor force
In January 2020, the working age population (15 years old and over) was estimated at 72.8 million. Among these, 61.7 percent were in the labor force. This translates to approximately 44.9 million Filipinos in the labor force; that is, either employed or unemployed (Table 1, and Table 3). At the regional level, Region X (Northern Mindanao) had the highest reported labor force participation rate (LFPR) estimated at 70.0 percent while Bangsamoro Autonomous Region in Muslim Mindanao (BARMM) had the lowest LFPR at 50.8 percent (Table 1, and Figure 1).
Employment rate registered at 94.7 percent
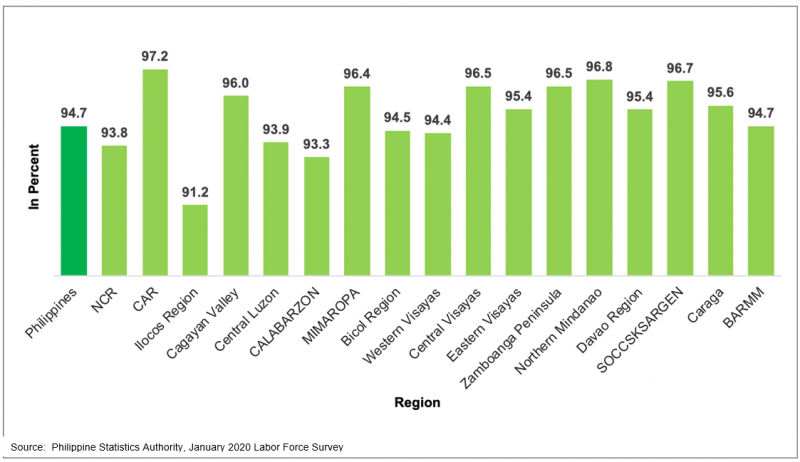
Employment rate or the proportion of employed persons to total labor force was at 94.7 percent (Table 1), equivalent to 42.5 million Filipinos employed in January 2020 (Table 2).
Among the regions, Cordillera Administrative Region (CAR) had the highest employment rate with 97.2 percent. Six (6) of the 17 regions registered employment rates lower than the national average of 94.7 percent. These regions are the following: Region I (Ilocos Region) (91.2%), Region IV-A (CALABARZON) (93.3%), National Capital Region (NCR) (93.8%), Region III (Central Luzon) (93.9%), Region VI (Western Visayas) (94.4%), and Region V (Bicol Region) (94.5%) (Table 1, and Figure 2).
Figure 1. Labor Force Participation by Region: January 2020
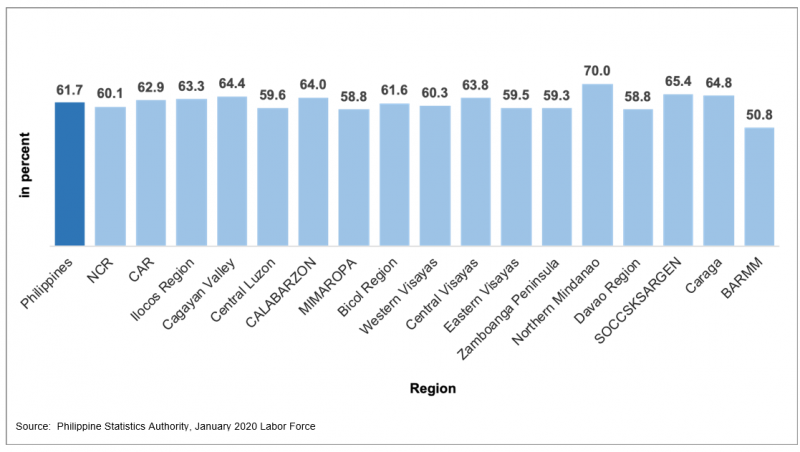
Figure 2. Employment Rate by Region: January 2020
More males were employed than females
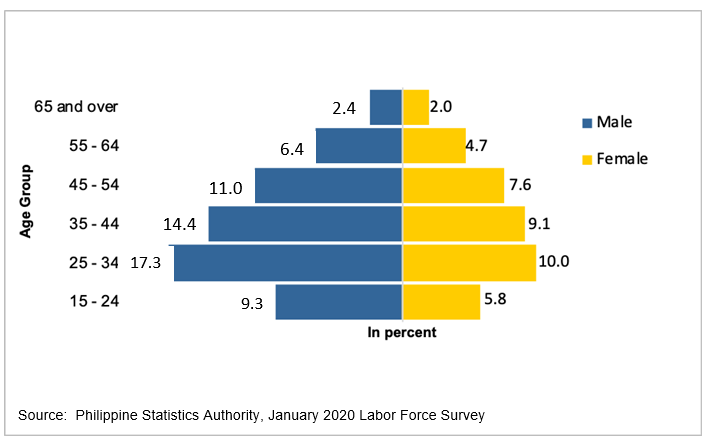
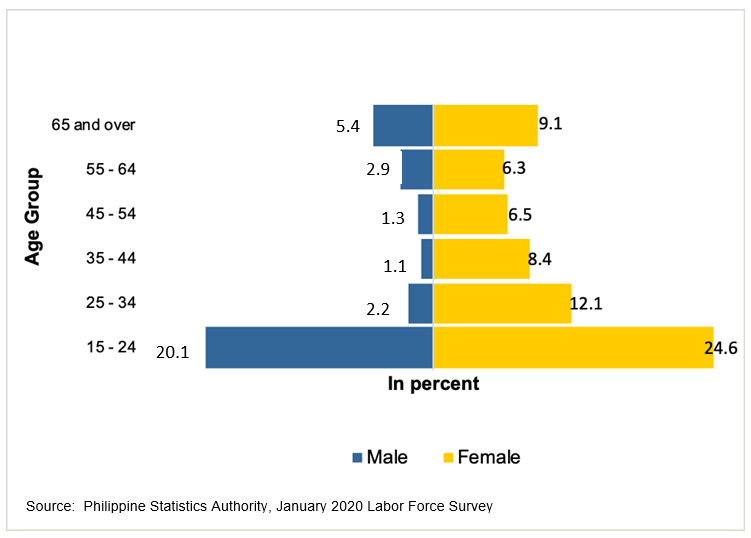
Employment rate was higher among men compared to women. In January 2020, more than sixty percent (60.8%) of the estimated 42.5 million employed persons were males while employed females were reported at 39.2 percent. Those 25-34 years old age group made up the biggest share of the employed at 27.3 percent, followed by the 35-44 years old group at 23.4 percent, while 65 years old and over shared the least at 4.5 percent. (Table 3, and Figure 3).
Figure 3. Percent Distribution of Employed Persons by Sex and Age Group: January 2020
More than half of employed persons were in the services sector
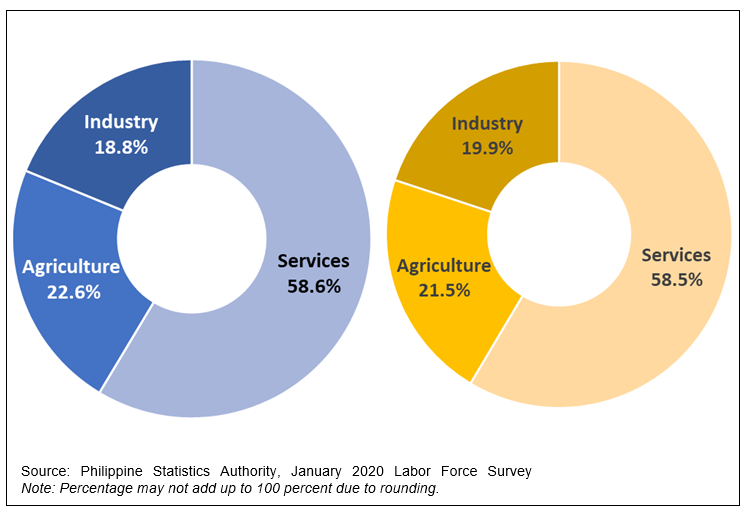
Employed persons were grouped into three broad sectors, namely: agriculture, industry, and services. In January 2020, services sector still comprised the largest share of the population who are employed accounting for more than half at 58.6 percent of the total employed. In January 2019, it was estimated at 58.5 percent.
Workers in the agriculture sector comprised the second largest group with 22.6 percent in January 2020 from 21.5 percent in January 2019. On the other hand, workers in the industry sector account for the smallest employment contribution at 18.8 percent in January 2020, which is lower than January 2019 at 19.9 percent. (Table 4, and Figure 4).
Among workers in the services sector, those engaged in wholesale and retail trade; repair of motor vehicles and motorcycles made up the largest percentage with 20.2 percent of the total employed (Table 4).
Figure 4. Percent Distribution of Employed Persons by Major Industry Group: January 2020 and January 2019
More than one-fourth of employed persons were in elementary occupations
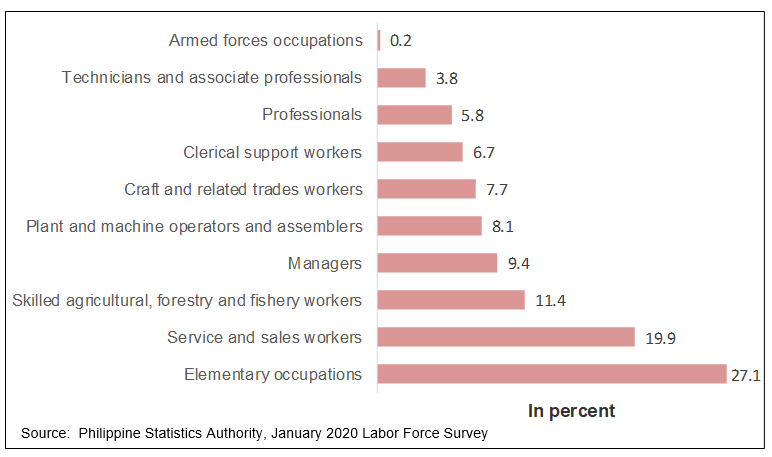
Across occupation groups, workers in elementary occupations remained the largest group at 27.1 percent of the total employed population in January 2020 from 26.6 percent in the same period a year ago. Service and sales workers comprised the second largest occupation group at 19.9 percent, followed by skilled agricultural, forestry, and fishery workers which was accounted at 11.4 percent (Table 5, and Figure 5).
Figure 5. Percent Distribution of Employed Persons by Major Occupation Group January 2020
Majority of employed persons were wage and salary workers
Employed persons fall into any of these categories: (1) wage and salary workers, (2) self-employed workers without any paid employee, (3) employers in own family-operated farm or business, and (4) unpaid family workers.
Wage and salary workers are those who work for private households, private establishments, government and government-controlled corporations, and those who work with pay in own family-operated farm or business. In January 2020, 65.2 percent of the total employed were wage and salary workers, with those working in private establishments consistently account for the largest share at 51.5 percent while those working in government and government-controlled corporations accounted for 9.2 percent of the total employed persons. The share of self-employed workers without any paid employee in total employed in January 2020 was at 26.2 percent; which was slightly higher than January 2019 at 26.0 percent (Table 6).
Classified according to broad industry group, 54.2 percent of unpaid family workers were in the agriculture sector. On the other hand, about three in every five (61.8%) wage and salary workers were in the services sector. Further, majority or 56.1 percent of the self-employed workers without any paid employees were in the services sector while more than forty percent (46.1%) of those who were employer in own-family operated farm or business were in agriculture (Table 7, and Figure 6).
Majority of employed persons worked full-time
Employed workers are classified as either full-time or part-time workers. Full-time workers are those who work for 40 hours or more while part-time workers work for less than 40 hours during the reference week. Of the total employed workers in January 2020, full-time workers comprised 67.6 percent, a decrease from 72.2 percent in January 2019. Those who worked for 40 to 48 hours accounted the larger proportion of 47.3 percent, while those who worked more than 48 hours comprised 20.4 percent. In January 2020, part-time workers comprised 31.6 percent of the total employed, which was an increase from 27.2 percent in January 2019. On average, in January 2020, workers worked 41.3 hours per week, a drop from the average of 43.4 in January 2019 (Table 8).
Underemployment rate was registered at 14.8 percent
Underemployed persons are employed persons who express the desire to have additional hours of work in their present job or to have additional job, or have a new job with longer working hours. Underemployed persons were estimated at 14.8 percent of the total employed persons, this can be translated to 5.3 million in January 2020 (Tables 1, and 2).
Underemployed persons or part-time workers (worked for less than 40 hours in a week) are called visibly underemployed persons. They accounted more than half or 58.8 percent of the total underemployed in January 2020. Among those who worked less than 40 hours in a week, majority or 77.9 percent were in the agriculture sector (Table 9).
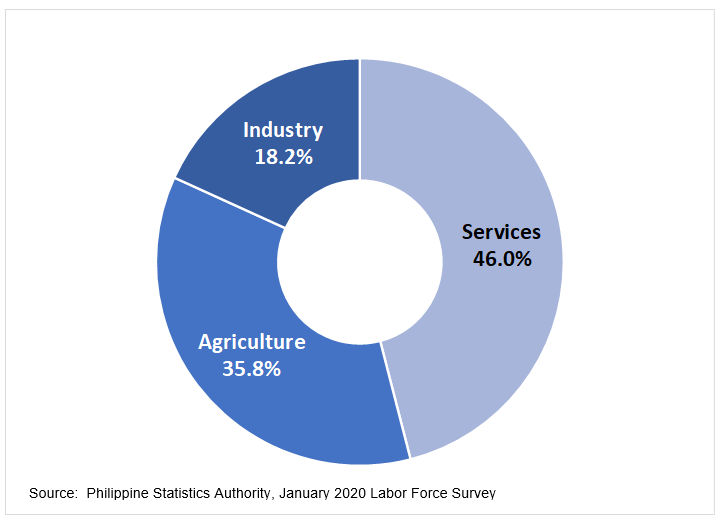
By broad industry group, underemployed persons were mostly in the services sector at 46.0 percent share, while 35.8 percent were in the agriculture sector, and 18.2 percent were in the industry sector (Table 9, and Figure 7).
Figure 6. Percent Distribution of Employed Persons by Class of Worker and Broad Industry Group: January 2020
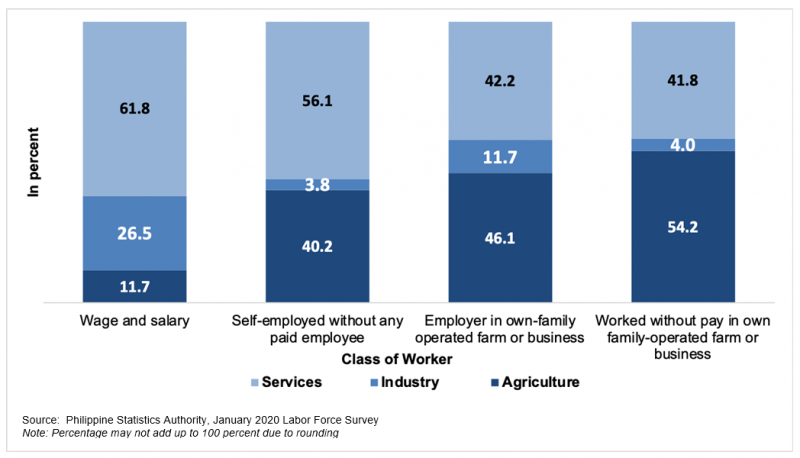
Figure 7. Percent Distribution of Underemployed Persons by Broad Industry Group January 2020
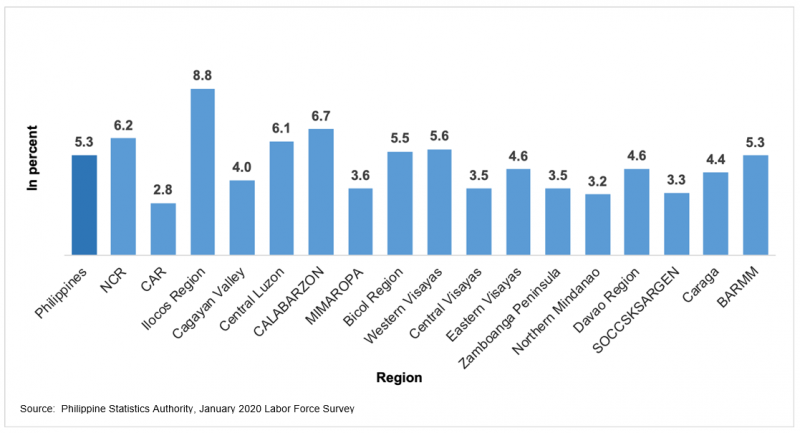
Unemployment rate is recorded at 5.3 percent
Among the economically active population (15 years old and over), 5.3 percent were unemployed, accounting to 2.4 million unemployed Filipinos (Tables 1, and 2).
At the regional level, the regions with higher unemployment rates than the national average of 5.3 percent were Region I (Ilocos Region) (8.8%), Region IV-A (CALABARZON) (6.7%), National Capital Region (NCR) (6.2%), Region III (Central Luzon) (6.1%), Western Visayas (5.6%), and Region V (Bicol Region) (5.5%) (Table 1, and Figure 8).
Among the unemployed persons in January 2020, more males (63.2%) were unemployed compared to females (36.8%). Of the total unemployed, 42.6 percent were in the age group of 15 to 24 years (Table 3).
Figure 8. Unemployment Rate by Region: January 2020
By educational attainment, 39.5 percent of unemployed persons were either undergraduate or graduate of junior high school or the old curriculum, 36.9 percent reached college wherein 26.7 percent were graduates, 6.4 percent were elementary graduates, 3.8 percent were senior high school graduates, and 5.0 percent were graduates of post-secondary courses (Table 10).
Majority of persons not in the labor force were women
Among the population 15 years and over, about 38.3 percent were not in the labor force in January 2020. These include housewives, students, persons with disability, and those who have retired from their employment. Sixty seven percent (67.0%) were women. Among those not in the labor force, about four in every ten (44.7%) were in age group 15-24 years old (Table 3 and Figure 9).
Figure 9. Percent Distribution of Population 15 Years and Over who were not in the Labor Force by Age Group: January 2020
SUMMARY STATISTICS
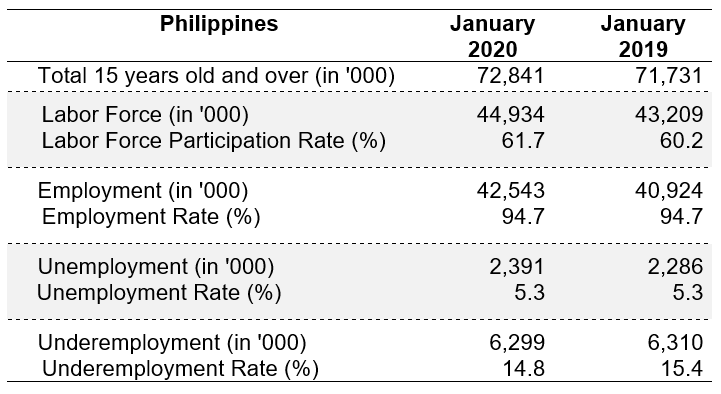
a) The labor force participation rate (LFPR) among Filipinos 15 years and older is estimated at 61.7 percent in January 2020. This translates to 44.9 million Filipinos in the labor force.
b) Employment rate in January 2020 was recorded at 94.7 percent, equivalent to 42.5 million total employed persons.
c) Among the broad industry sector, more than half (58.6%) of the total employed were in the services sector, 22.6 percent were in the agriculture sector, and 18.8 percent were in the industry sector.
d) Among the employed persons, workers engaged in elementary occupations comprised the largest share, accounting to 27.1 percent of the total employed population.
e) Unemployment rate was estimated at 5.3 percent, which translates to 2.4 million total unemployed Filipinos.
f) Underemployed persons were estimated at 14.8 percent of the total employed persons, this can be translated to 6.3 million underemployed in January 2020.
(Sgd.) DENNIS S. MAPA, Ph.D.
Undersecretary
National Statistician and Civil Registrar General
