
More than half of the population 15 years old and over were in the labor force
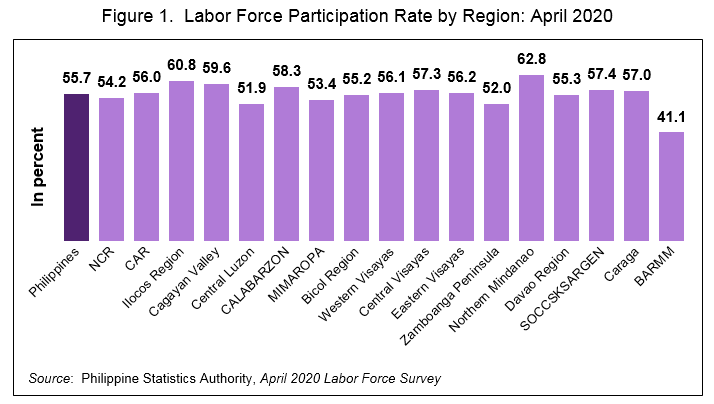
In April 2020, the total population 15 years old and over was estimated at 73.7 million wherein the number of persons who were in the labor force was reported at 41.1 million according to the Labor Force Survey (LFS) results. This placed the labor force participation rate (LFPR) at 55.7 percent, which means that three in every five of the population aged 15 years and over were either employed or unemployed. This is the lowest in the history of the Philippine labor market due to the Coronavirus disease 2019 (COVID-19).
Among the regions, National Capital Region (NCR) (54.2%), Central Luzon (51.9%), MIMAROPA (53.4%), Bicol Region (55.2%), Zamboanga Peninsula (52.0%), Davao Region (55.3%), and BARMM (41.1%) had LFPR less than the national average. Northern Mindanao had the highest reported LFPR at 62.8 percent while the lowest LFPR was reported in Bangsamoro Autonomous Region in Muslim Mindanao (BARMM) at 41.1 percent. (Table 1, and Figure 1)
Employment rate was recorded at 82.4 percent
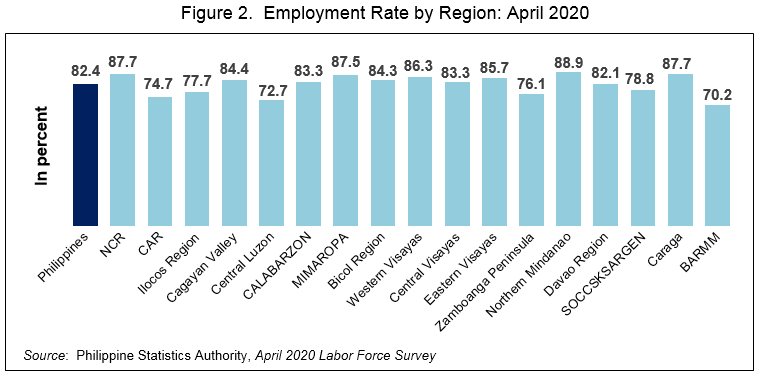
The total number of employed persons was estimated at 33.8 million. The proportion of employed persons to the total labor force, also known as the employment rate, was reported at 82.4 percent. (Table 1, and Figure 2)Employment declined in all regions in April 2020 as compared with the same period in 2019. Seven of the 17 regions, namely: Davao Region (82.1%), SOCCSKSARGEN (78.8%), Ilocos Region (77.7%), Zamboanga Peninsula (76.1%), Cordillera Administrative Region (CAR) (74.7%), Central Luzon (72.7%), and BARMM (70.2%) registered an employment rate lower than the national figure (82.4%). (Table 1, and Figure 2)
More males were employed than females
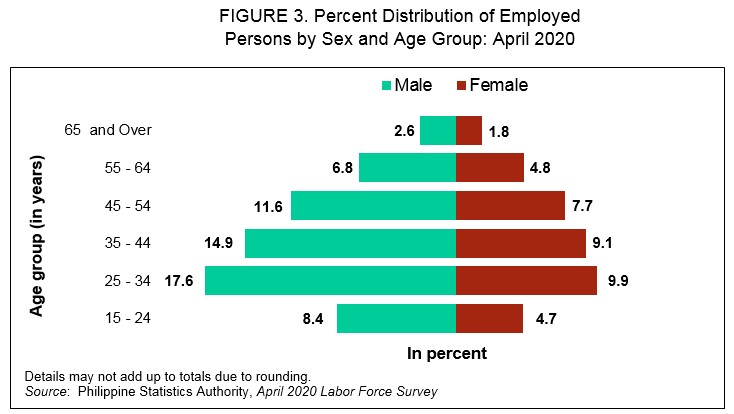
Employment rate was higher among men compared to women. In April 2020, three in every five (61.9%) of the estimated 33.8 million employed persons were males while employed females were reported at 38.1 percent. (Table 3, and Figure 3)
By age, most of the employed persons were in the age group 25 to 34 years old (27.6%), followed by the employed persons in the age group 35 to 44 years old (24.0%), and in the age group 45 to 54 years old (19.3%). (Table 3)
More than half of the employed persons were working in the services sector
The employed persons were grouped in three broad sectors, namely: Agriculture, Industry, and Services sector. Workers in the Services sector comprised the largest share of the employed population accounting for 57.1 percent or more than half of the total employed in April 2020. The share of workers in the Services sector was estimated at 58.9 percent in April 2019. Among the workers in the Services sector, those engaged in the wholesale and retail trade; repair of motor vehicles and motorcycles accounted for the largest share of 19.1 percent this year from 20.3 percent in April 2019. (Table 4, and Figure 4)
Workers in the Agriculture sector comprised the second largest group making up 25.9 percent in April 2020, from 21.7 percent in April 2019. However, workers in the Industry sector made up the smallest group registering 17.0 percent in April 2020, and 19.4 percent in April 2019, with the construction (8.3%) and manufacturing (8.0%) subsectors being the largest contributors in April 2020. These subsectors had 10.0 percent, and 8.5 percent shares, respectively, in April 2019. (Table 4, and Figure 4)
Among the employed persons by subsectors, workers in the agriculture, hunting, and forestry comprised the biggest percentage of the total employed persons in April 2020 with 22.6 percent. The wholesale and retail trade; repair of motor vehicles and motorcycles subsector ranked next at 19.1 percent. (Table 4)
Among the subsectors, compared to April last year, the largest decline in the number of employed were observed in Wholesale and retail trade; repair of motor vehicles and motorcycles; Construction; and Transportation and storage in April 2020. (Table 4)

More than one-fourth of the employed persons were in elementary occupations
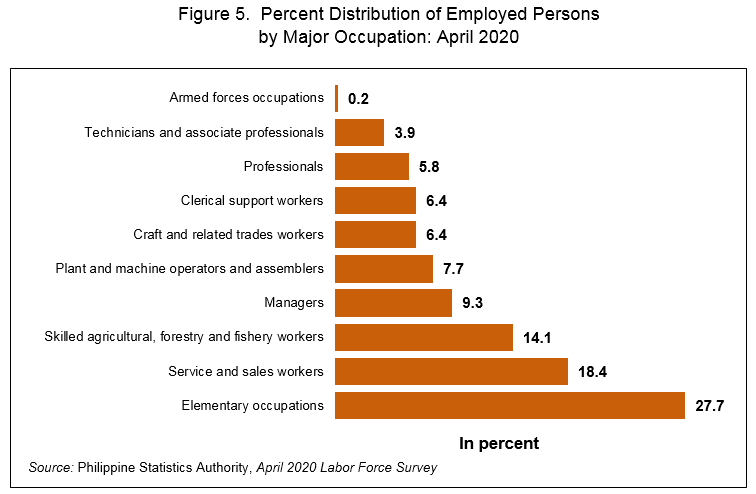
Largest share of employed persons in April 2020 engaged in elementary occupations at 27.7 percent of the total employment, from 26.3 percent in April 2019. Service and sales workers comprised the second largest occupation group at 18.4 percent, followed by skilled agricultural, forestry, and fishery subsector at 14.1 percent. (Table 5, and Figure 5)
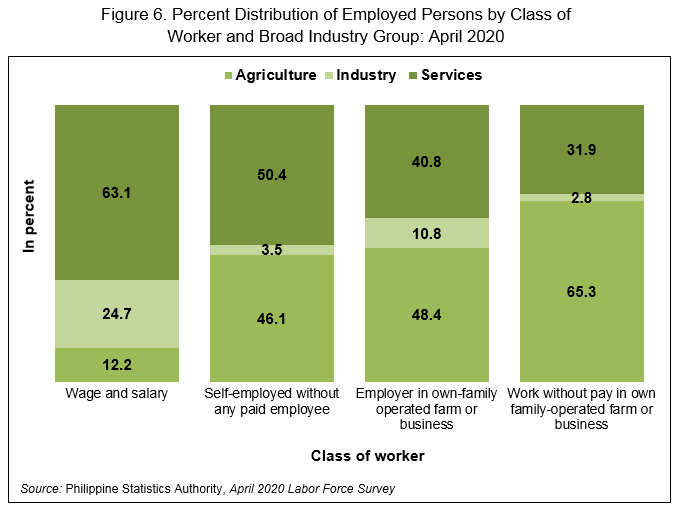
More than 60 percent of the employed persons were wage and salary workers
Employed persons fall into any of these categories: (1) wage and salary workers; (2) self-employed workers without any paid employee; (3) employer in own family-operated farm or business; and (4) worked without pay in own family-operated farm or business or unpaid family workers.
Wage and salary workers are those who work for private households, private establishments, government or government-controlled corporations, and those who work with pay in own family-operated farm or business. In April 2020, 63.2 percent of the total employed persons were wage and salary workers, with those working in private establishments accounted for the largest share at 47.9 percent, followed by those working in government and government-controlled corporations at 10.3 percent. (Table 6)
Further, the share of self-employed workers to the total employed in April 2020 went up to 28.7 percent from 27.4 percent in April 2019. Unpaid family workers accounted for 6.3 percent of the total employed in April 2020 from 6.2 percent in April 2019.
Classified according to broad industry group, in the Services sector, 63.1 percent were wage and salary workers, and 50.4 percent were self-employed without any paid employee. Meanwhile, in the Agriculture sector, 65.3 percent were those who worked without pay, and 48.4 percent were employers in a family-operated business. (Table 7, and Figure 6)
Almost thirty percent of the total employed persons were full-time workers
Employed persons are classified as either full-time workers or part-time workers. Full-time workers are those who work for 40 hours or more during the reference week while part-time workers work for less than 40 hours.
Of the total employed persons in April 2020, 29.1 percent were full-time workers, while 32.4 percent were part-time workers. In April 2019, full time workers comprised 68.1 percent of the total employed persons, while 30.8 percent were part-time workers. Further, the percentage of employed persons who were not at work was estimated at 38.5 percent in April 2020 from 1.1 percent in April 2019. Majority (56.8%) of workers in the Industry sector were employed but not at work in April 2020. (Tables 8, and 9)
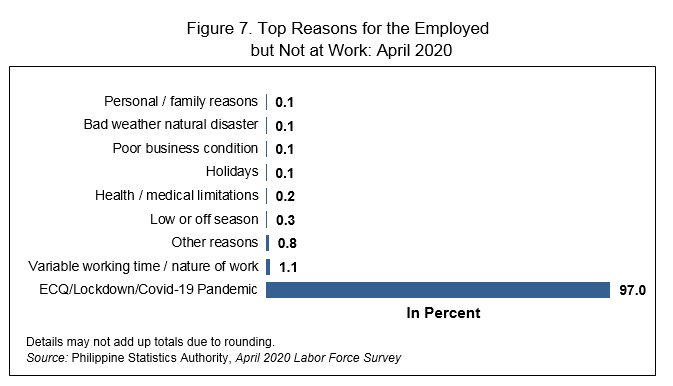
Among the employed persons who were not at work in April 2020, majority (97.0%) expressed that their reason for not being at work was due to the COVID-19 pandemic, and community quarantine. This was followed by the variable working time or nature of work at 1.1 percent, other reasons specified at 0.8 percent, low or off season at 0.3 percent, and health or medical limitations at 0.2 percent. (Table 12, and Figure 7)
Underemployment rate registered at 18.9 percent
The underemployed persons or those employed persons who express the desire to have additional hours of work in their present job, an additional job, or a new job with longer working hours were estimated at 6.4 million persons corresponding to an underemployment rate of 18.9 percent. Underemployed persons who work for less than 40 hours in a week are called visibly underemployed. They accounted 52.5 percent of the total underemployment in April 2020. By comparison, the underemployed persons who worked for 40 hours or more in a week made up 14.2 percent. (Table 1, 2, and 9)
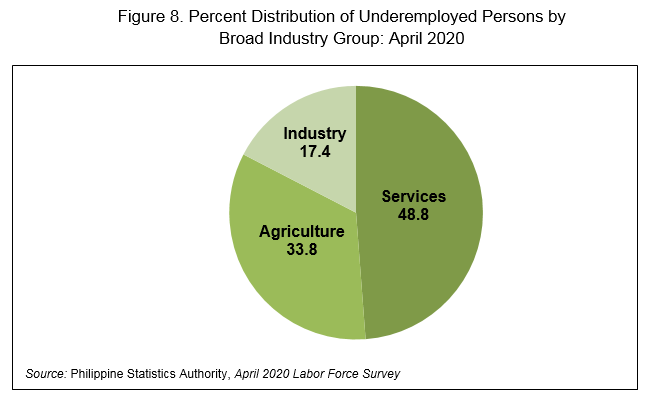
By sector, 48.8 percent of the underemployed persons in April 2020 worked in the services sector, while 33.8 percent were in the agriculture sector. The industry sector accounted for the remaining 17.4 percent. (Figure 8)
Unemployment rate reached 17.6 percent
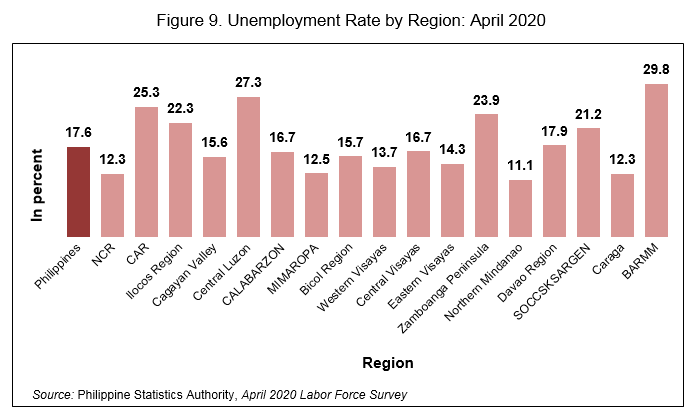
In April 2020, the number of unemployed persons was 7.2 million resulting to an unemployment rate of 17.6 percent. This is a record high for the unemployment rate reflecting the effects of the economic shutdown to the Philippine labor market due to the COVID-19 pandemic. (Tables 1, and 2)
All regions registered a double-digit unemployment rate. The regions with unemployment rates higher than the national figure (17.6%) were the following: BARMM (29.8%), Central Luzon (27.3%), CAR (25.3%), Zamboanga Peninsula (23.9%), Ilocos Region (22.3%), SOCCSKSARGEN (21.2%), and Davao Region (17.9%). The lowest unemployment rate was in Northern Mindanao at 11.1 percent. (Table 1, and Figure 9)
Unemployed persons were highest in the age group 25 to 34 years old at 31.5 percent followed by 15 to 24 years old at 28.2 percent. Moreover, among the unemployed persons, majority (67.0%) were males while the rest (33.0%) were females. (Table 3)
Across education groups, 30.3 percent of the unemployed persons were junior high school graduates while 18.8 percent were college graduates. (Table 10).
In April 2020, the category ECQ/Lockdown/COVID-19 pandemic was included in the reasons for not looking for work to assess the impact of COVID-19 pandemic in the Philippine Labor Market. Among the unemployed persons, majority (88.1%) expressed their lack of interest to look for work in April 2020 due to the COVID-19 pandemic. This was followed by awaiting results of previous job application at 5.1 percent, and wait for rehire or job recall at 3.7 percent. (Table 13, and Figure 10)

Majority of persons not in the labor force were females
In April 2020, about 32.7 million or 44.3 percent of the total population 15 years and over were not in the labor force. These include housewives, students, persons with disability, and those who have retired from their work. Majority (65.8%) of this were females, while the rest (34.2%) were males. (Table 3)
By age group, those belonging to the group 15 to 24 years accounted for almost half (41.4%) of the total number who were not in the labor force, of which 22.6 percent were females, while 18.8 were males. (Table 3, and Figure 11)

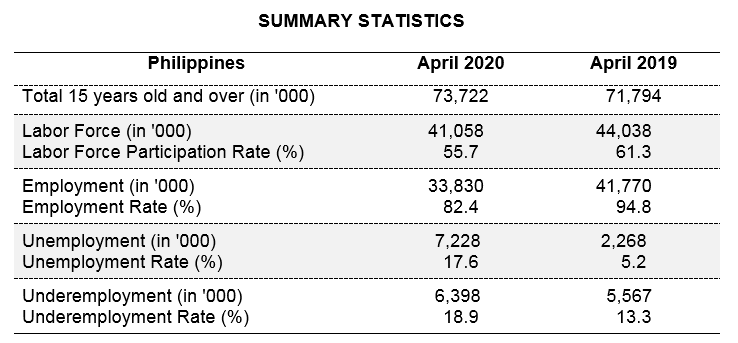
a) The labor force participation rate (LFPR) among Filipinos 15 years and older was estimated at 55.7 percent in April 2020. This translates to about 41.1 million Filipinos in the labor force.
b) Employment rate in April 2020 was recorded at 82.4 percent, or equivalently, about 33.8 million total employed persons.
c) Among the broad industry sector, more than half (57.1%) of the total employed were in the services sector, 25.9 percent were in the agriculture sector, and 17.0 percent were in the industry sector.
d) Among the employed persons, workers engaged in elementary occupations comprised the largest share, accounting to 27.7 percent of the total employed population.
e) Unemployment rate was estimated at 17.6 percent, which translates to roughly 7.2 million total unemployed Filipinos.
f) Underemployed persons were estimated at 18.9 percent of the total employed persons. This can be translated to nearly 6.4 million underemployed in April 2020.
TECHNICAL NOTES
The Labor Force Survey (LFS) is a nationwide quarterly survey conducted by the Philippine Statistics Authority (PSA) during the months of January, April, July, and October. For this release, the data being presented are based on the final results of the April 2020 round of the LFS.
The reference period used in the survey is the past seven (7) days preceding the date of interview of the enumerator.
The concepts and definitions used in the survey can be found in PSA Integrated Survey of Households (ISH) Bulletins. Some are given below:
a. Labor Force – refers to the population 15 years old and over who contribute to the production of goods and services in the country. It comprises the employed and unemployed.
b. Employed – refers to persons in the labor force who are reported either as at work or with a job or business although not at work. Persons at work are those who did some work, even for an hour during the reference period.
c. Unemployed – refers to persons in the labor force who are reported as:
1. without work;
2. currently available for work; and
3. seeking work or not seeking work due to the following reasons:
i. ECQ/Lockdown/COVID-19 pandemic;
ii. belief that no work is available;
iii. awaiting results of previous job application;
iv. because of temporary illness or disability;
v. bad weather; or
vi. waiting for rehire or job recall.
d. Underemployed – refers to employed persons who express the desire to have additional hours of work in their present job or an additional job, or a new job with longer working hours.
e. Labor Force Participation Rate (LFPR) – refers to the proportion of total labor force to the total household population 15 years old and over.
f. Employment Rate – refers to the proportion of employed persons to the total labor force.
g. Unemployment Rate – refers to the proportion of unemployed persons to the total labor force.
h. Underemployment Rate – refers to the proportion of underemployed persons to total employed persons.
TECHNICAL NOTES (concluded)
1. Starting January 2012 LFS, the codes for industry adopted the 2009 Philippine Standard Industrial Classification (PSIC). Prior to this, codes for industry used the 1994 PSIC.
2. Question on vocational course was introduced in the April 2012 Labor Force Survey (LFS) questionnaire.
3. Starting April 2016 round, the LFS adopted the 2013 Master Sample Design, with a sample size of approximately 44,000 households.
4. The 2012 Philippine Standard Occupational Classification (PSOC) was adopted starting April 2016. The 1992 PSOC had been used prior to April 2016.
5. Starting with the April 2016 LFS round, the population projections based on the 2010 Census of Population and Housing (2010 CPH) has been adopted to generate the labor force statistics.
6. In July 2016, the 2008 Philippine Standard Classification of Education (PSCED) that was used in the 2015 Population Census (2015 POPCEN) has been adopted. The categories in highest grade completed were also revised considering the K-12 program in the education system.
7. In April 2017 round, Computer Aided Personal Interviewing (CAPI) using Tablet was utilized in the LFS enumeration.
8. Overseas Filipino Workers (OFWs) are not considered as part of the labor force in the Philippines. Hence, in the LFS, data on economic characteristics of household members who are OFWs are not collected. For the LFS reports, they are excluded in the estimation of the size of working population, that is, population aged 15 years and older, and in the estimation of the labor force.
9. Starting with the January 2020 LFS round, the population projections based on the 2015 Population Census (POPCEN 2015) have been adopted to generate the labor force statistics. For comparability, population projections based on the POPCEN 2015 were likewise used in the April 2019 labor force statistics.
10. For the April 2020 round, ECQ/Lockdown/COVID-19 pandemic was included in the reasons for working more than 48 hours, less than 40 hours, and not looking for work. The April 2020 LFS was conducted from 20 April to 16 May 2020.