
Water Accounts of the Philippines
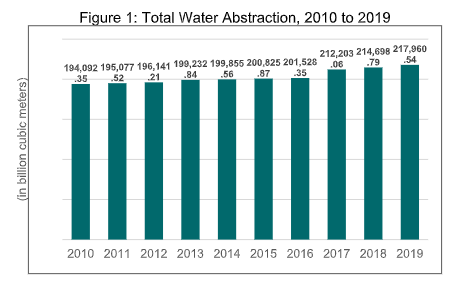
The country’s total water abstraction, or the amount of water that is removed from its source either permanently or temporarily, has increased by 12.3 percent, from 194.1 billion cubic meters (bcm) in 2010 to 218.0 bcm in 2019 (Figure 1). For the same period, on the average, 98.1 percent of the total abstraction was from lakes, artificial reservoirs, rivers and streams (surface water) and the remaining 1.9 percent from groundwater reservoirs. On the average, 98.9 percent of the abstracted water was for own use while the remaining 1.1 percent was intended for distribution to other economic units
 .
.
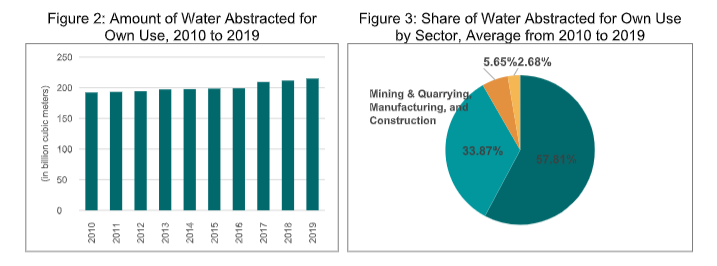
Water abstracted for own use also increased from 192.3 bcm in 2010 to 215.0 bcm in 2019 (Figure 2). The largest increase was observed in 2017, owing to an increase in water abstraction by the industry sector collectively. As shown in Figure 3, the largest amount of self-abstracted water is for the power sector (57.8%). This was followed by the agriculture sector (33.9%), mining and quarrying, manufacturing, and construction (5.6%) and the services sector and households (2.7%). It should be noted that the power sector, specifically hydropower, uses water in a non-consumptive manner. That is, water remains in or is immediately returned to the location from which it was extracted.
Similarly, the amount of water for distribution also increased from 1.8 bcm in 2010 to 3.0 bcm 2019 (Fig. 4). As shown in Figure 5, more than half of the distributed water was used by households (55.0%). This is followed by the service sector (31.5%) then mining and quarrying, manufacturing, and construction (12.5%). The smallest amount of distributed water is used by the sectors of agriculture and power. Generally, the service sector and households are connected to municipal water systems that facilitate water collection, treatment, and distribution.

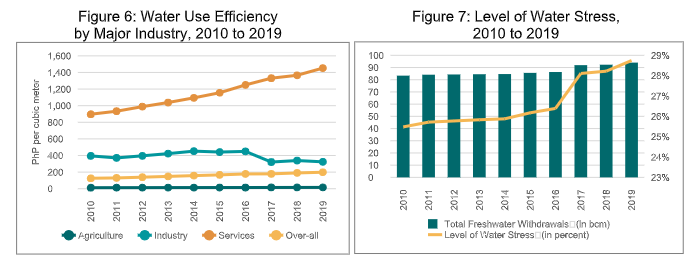
Water use efficiency (WUE), or the value added per volume of water used, increased from PhP 126.10 per cubic meter of water used in 2010 to PhP 198.41/cubic meter in 2019 (Figure 6). From 2010 to 2019, the service sector consistently had the largest WUE, followed by the industry sector and agriculture sector. It is notable that for the same period, the service sector contributed more than 50 percent to the country’s gross domestic product but, at the same time, used less water than the industry and agriculture sectors.
The level of water stress, or freshwater withdrawal as a proportion of available freshwater resources, also increased from 25.5 percent in 2010 to 28.7 percent in 2019 (Figure 7). The annual level of water stress since 2010 consistently fell within the low level classification range of 25 to 50 percent.
It should be noted that freshwater withdrawals for both indicators exclude hydropower generation due to its non-consumptive use. Additionally, Water Supply and Waste Management is included in the services sector, in alignment with the global methodology for SDG 6.4.1.
The supply and use of water resources follow the System of Environmental-Economic Accounting (SEEA) 2012 Central Framework which was adopted as an international statistical standard and is aligned with the System of National Accounts. The water accounts provide information on the rate of extraction and the use of water by different economic units. These are essential in assessing whether the country is using its water resources sustainably.
DENNIS S. MAPA, Ph.D.
Undersecretary
National Statistician and Civil Registrar General
| Attachment | Size |
|---|---|
|
|
688.04 KB |
|
|
157.33 KB |
|
|
64.84 KB |