
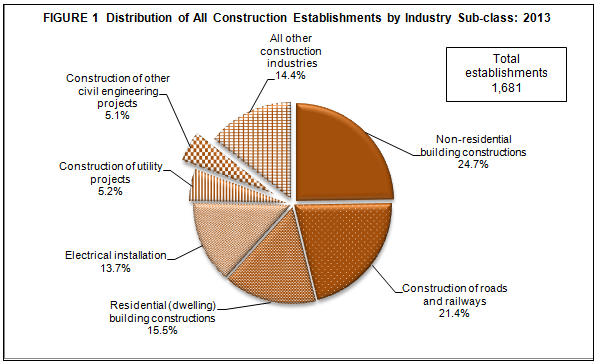
Non-residential building constructions dominates the sector
The final results of the 2013 Annual Survey of Philippine Business and Industry (ASPBI) showed that there were 1,681 engaged in construction in the formal sector of the economy.
Non-residential building constructions recorded the most number of establishments with 416 accounting for 24.7 percent of the total. This was followed closely by construction of roads and railways with 360 establishments or 21.4 percent share to total. Other industries with more than five percent share to the total number of construction establishments were as follows:
- residential (dwelling) building constructions, 260 establishments (15.5%)
- electrical installation, 230 establishments (13.7%)
- construction of utility projects, 88 establishments (5.2%)
- construction of other civil engineering projects, 85 establishments (5.1%)
Figure 1 shows the distribution of all construction establishments by industry sub-class in 2013.
Non-residential building constructions employs the highest number of workers
In 2013, construction establishments employed a total of 236,192. Of the total employment, 235,660 or 99.8 percent were paid employees and the remaining 532 or 0.2 percent were unpaid workers.
By industry, non-residential building constructions which recorded the most number of establishments, hired the majority of workers at 79,452 or 33.6 percent of the total. This was followed closely by construction of roads and railways with 74,443 workers or 31.5 percent. Electrical installation came next with 26,678 workers or 11.3 percent share to total. Figure 2 shows the distribution of employment for all construction establishments by industry sub-class in 2013.
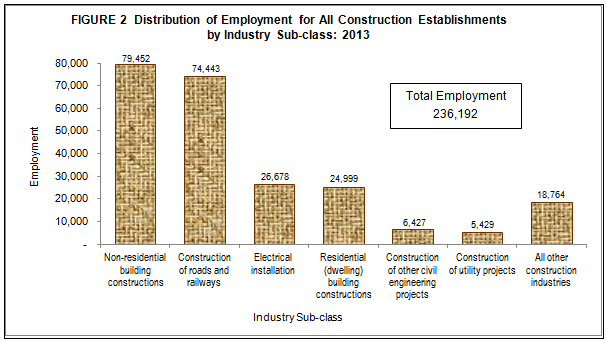
The average number of workers per establishment for the sector was recorded at 141. Among industries, the average number of workers per establishment was above the national average for construction of roads and railways and non-residential building constructions with 207 and 191 workers per establishment, respectively.
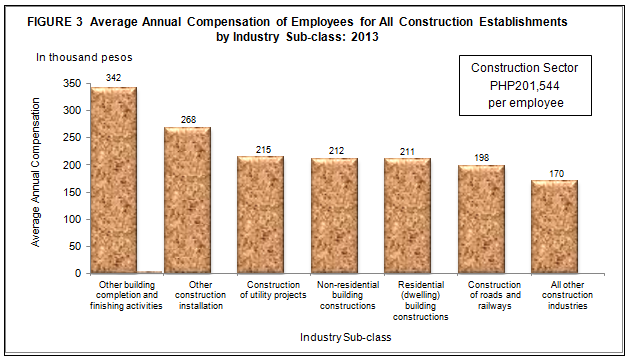
Other building completion and finishing activities pays highest average compensation
Total compensation paid in 2013 amounted to PHP47.5 billion, indicating an average annual compensation of PHP201,544 per employee.
Among industries, other building completion and finishing activities paid the highest average annual compensation of PHP341,589 per employee. A far second was other construction installation which paid an average annual compensation of PHP268,259 per employee. The other industries that exceeded the national average annual compensation were:
- construction of utility projects, PHP214,613 per employee
- non-residential building constructions, PHP211,736 per employee
- residential (dwelling) building constructions, PHP210,927 per employee
Figure 3 shows the average annual compensation of employees for all construction establishments by industry sub-class in 2013.
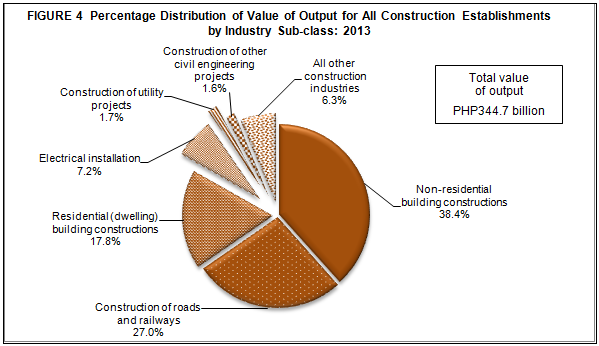
Non-residential building constructions generates highest value of output
Total value of output generated by all construction establishments amounted to PHP344.7 billion.
The top three industries generated bulk of the total value of output at PHP286.9 billion or 83.2 percent of the total. These are non-residential building constructions with output value of PHP132.3 billion or 38.4 percent of the total. Construction of roads and railways came in second followed by residential (dwelling) building constructions with respective output share of PHP93.1 billion (27.0%) and PHP61.5 billion (17.8%).
Figure 4 shows the distribution of value of output for all construction establishments by industry sub-class in 2013.
Non-residential building constructions spends the most
Total expense in 2013 incurred in business operations amounted to PHP316.1 billion.
Among industries, non-residential building constructions incurred the highest expense amounting to PHP120.6 billion or 38.2 percent of the total, followed by construction of roads and railways with PHP84.1 billion or 26.6 percent. Residential (dwellings) building constructions came third with a total expense of PHP57.5 billion (18.2%).
Carpentry industry records the highest returns
Income per expense ratio for the sector was recorded at 1.11, indicating that for every peso spent PHP1.11 was realized in terms of income.
Among industries, carpentry recorded the highest income per expense ratio of 1.26. Other industries with income per expense ratio above the national figure were as follows:
- construction of other civil engineering projects, 1.17 income per peso expense
- construction of roads and railways, 1.14 income per peso expense
- plumbing, heat and air-conditioning installation, 1.13 income per peso expense
- non-residential building constructions, 1.12 income per peso expense
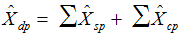
Non-residential building constructions highest contributor to value added
In 2013, value added generated by all construction establishments reached PHP113.8 billion.
The top 3 industries, in terms of value added, contributed PHP94.3 billion or 82.9 percent of the total. Non-residential building constructions generated the biggest share to total value added amounting to PHP41.1 billion or 36.1 percent of the total. This was followed by construction of roads and railways with PHP39.6 billion (34.8%). Residential (dwelling) building constructions placed third with PHP13.6 billion (12.0%).
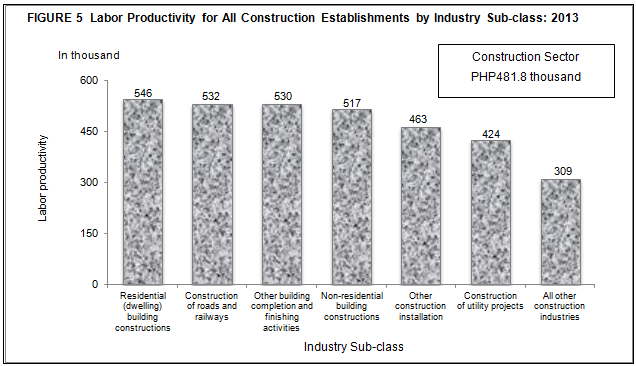
Residential (dwelling) building constructions most labor productive
Labor productivity, defined as value added per worker, was estimated at PHP481.8 thousand per worker for the construction sector.
The top four industries that led in terms of labor productivity and exceeding the national average are: residential (dwelling) building constructions with PHP545.7 thousand per worker; construction of roads and railways with PHP532.2 thousand per worker; other building completion and finishing activities with PHP529.7 thousand per worker; and non-residential building constructions with PHP516.9 thousand per worker.
Figure 5 presents the labor productivity for all construction establishments by industry sub-class in 2013.
Construction of roads and railways contributes the most to gross addition to tangible fixed assets
Gross addition to tangible fixed assets, defined as capital expenditures less sale of fixed assets, was valued at PHP7.7 billion in 2013.
Construction of roads and railways with PHP3.6 billion accounted for almost half (46.5%) of the total gross addition to tangible fixed assets, followed by non-residential building constructions with PHP2.1 billion or 27.7 percent. Residential (dwelling) building constructions ranked third with PHP1.1 billion or 14.4 percent share to total.
Total subsidies amounts to PHP5.0 million
Total subsidies provided by the government to support the business operations of all construction establishments amounted to PHP5.0 million.
All the subsidies received by the sector went to residential (dwelling) building construction industry.
TECHNICAL NOTES
Introduction
This Special Release presents the final results of the 2013 Annual Survey of Philippine Business and Industry (ASPBI) for the Construction sector for all establishments.
The 2013 ASPBI is one of the designated statistical activities of the Philippine Statistics Authority (PSA). Data collected from the survey provide information on the levels, structure, performance, and trends of economic activities of the formal sector in the entire country for the year 2013.
The survey was conducted nationwide in 2014 with the year 2013 as the reference period of data, except for employment which is as of November 15, 2013.
Beginning with the 2013 ASPBI, the data processing was undertaken on a decentralized set-up with the Provincial Offices (POs) undertaking the manual and machine processing. This was done through the use of an online system called the Establishment Data Management System (EDMS). The set-up is in line with the PSA’s strategic direction to decentralize the data processing of surveys to the POs.
Data are presented at the national and industry sub-class or 5-digit 2009 Philippine Standard Industrial Classification (PSIC).
Legal Authority
The conduct of the 2013 ASPBI is authorized under Republic Act 10625 known as the Philippine Statistical Act of 2013 (Reorganizing and strengthening of the Philippine Statistical System (PSS), its agencies and instrumentalities).
Scope and Coverage
The 2013 ASPBI covered establishments engaged in 18 economic sectors classified under the 2009 PSIC, namely:
- Agriculture, Forestry and Fishing (A)
- Mining and Quarrying (B)
- Manufacturing (C)
- Electricity, Gas, Steam, and Air Conditioning Supply (D)
- Water Supply; Sewerage, Waste Management and Remediation Activities (E)
- Construction (F)
- Wholesale and Retail Trade; Repair and Maintenance of Motor Vehicles, Motorcycles (G)
- Transportation and Storage (H)
- Accommodation and Food Service Activities (I)
- Information and Communication (J)
- Financial and Insurance Activities (K)
- Real Estate Activities (L)
- Professional, Scientific and Technical Activities (M)
- Administrative and Support Service Activities (N)
- Education (P)
- Human Health and Social Activities (Q)
- Arts, Entertainment and Recreation (R)
- Other Service Activities (S)
The survey was confined to the formal sector of the economy, which consists of the following:
- Corporations and partnership
- Cooperatives and foundations
- Single proprietorship with employment of 10 and over
- Single proprietorships with branches
Hence, the 2013 ASPBI covered only the following economic units:
- All establishments with total employment (TE) of 10 or more, and;
- All establishments with TE of less than 10, except those establishments with Legal Organization = 1 (single proprietorship) and Economic Organization = 1 (single establishment), that are engaged in economic activities classified according to the 2009 Philippine Standard Industrial Classification (PSIC).
Frame of Establishments
The frame for the 2013 ASPBI was extracted from the 2013 List of Establishments (LE). The estimated number of establishments in operation in the country in 2013 totaled to 941,000. About 263,000 establishments (28.0% of the total establishments) belong to the formal sector of which 229,000 (87.0%) comprised the establishment frame. This frame was used to draw the sample establishments for the survey.
Unit of Enumeration
The unit of enumeration for the 2013 ASPBI is the establishment. An establishment is defined as an economic unit under a single ownership or control which engages in one or predominantly one kind of activity at a single fixed location.
Classification of Establishments
An establishment is categorized by its economic organization, legal organization, industrial classification, employment size, and geographic location.
Economic Organization refers to the organizational structure or role of the establishment in the organization. An establishment may be single establishment, branch, establishment and main office with branches elsewhere, main office only, and ancillary unit other than main office.
Legal Organization refers to the legal form of the economic entity which owns the establishment. An establishment may be single proprietorship, partnership, government corporation, stock corporation, non-stock corporation, and cooperative.
The industrial classification of an economic unit was determined by the activity from which it derives its major income or revenue. The 2009 PSIC was utilized to classify economic units according to their economic activities.
The size of an establishment is determined by its total employment (TE) as of specific date.
Geographic Classification. Establishments are also classified by geographic area using the Philippine Standard Geographic Code (PSGC) classification.
Sampling Design
The 2013 ASPBI used stratified systematic sampling with 5-digit PSIC serving as first stratification variable and employment size as the second stratification variable.
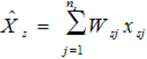
Estimation Procedure
- Non-Certainty Stratum (strata of TE 20 to 49 and TE 50 to 99)
The estimate of the total of a characteristic  for the non-certainty employment strata in an industry domain in each region was
where:
s denotes the non-certainty employment strata in TE of 20 and over
p = 1, 2,..., 17 regions (geographic domains)
xspj = value of the jth establishment in the non-certainty employment strata in TE of 20 and over for an industry domain in each region
j = 1, 2, 3,…, nsp establishments
Wspj = weight of the jth establishment in the non-certainty employment strata in TE of 20 and over for an industry domain in each region
Nsp = total number of establishments in the non-certainty employment strata in TE of 20 and over for an industry domain in each region
nsp = number of sample establishments in the non-certainty employment strata in TE of 20 and over for an industry domain in each region
- Certainty Stratum (TE 100 and over)
The estimate of the total of a characteristic  for the certainty employment stratum in an industry domain in each region was
where:
c denotes the certainty employment strata in TE of 20 and over
p = 1, 2,..., 17 regions (geographic domains)
xcpj = value of the jth establishment in the certainty employment strata in TE of 20 and over in an industry domain within each region
j = 1, 2, 3, …, mcp establishments
mcp = number of establishments in the certainty employment strata in TE of 20 and over in an industry domain within each region
- Total Estimate for TE of 20 and Over
The estimate of the total of a characteristic  for the industry domain in each region (geographic domain) was obtained by aggregating the estimates for all employment strata (non-certainty and certainty) in the same industry domain,
where dp denotes the industry domains in each region.
National level estimates of the characteristics by industry domain were obtained by aggregating separately the estimates  for the particular industry domain from all the regions.
For Establishments with TE of Less Than 20
a. Non-Certainty Stratum
The estimate of the total of a characteristic  for the non-certainty employment stratum TE less than 20 in the sth industry domain was
where:
s = denotes the non-certainty employment strata in TE of less than 20
Xsj = value of the jth establishment in non-certainty employment stratum in TE of less than 20 in Sth industry domain
j = 1,2,3..., ns establishments
Wsj = weight of the jth establishment in the non-certainty employment stratum of less than 20 in the sth industry domain

Ns = total number of establishments in the non-certainty employment stratum in TE of less than 20 in the sth industry domain
ns = number of sample establishments in the non-certainty employment stratum in TE of less than 20 in sth domain
Weight Adjustment Factor for Non-Response
To account for non-response in the non-certainty strata, the adjustment factor (n/n’) was multiplied with the sampling weight (W) of each of the sampling unit. The sampling weight, defined as N/n, was recomputed as
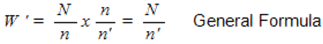
Thus, the adjusted weight (W’sj) for employment stratum in TE 1-9 or TE 10-19 was
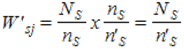
where:
Ns= total number of establisments in the employment stratum in TE 1-9 or TE 10-19 in the sth industry domain
n's = number of responding establishments in the employment stratum in TE 1-9 or TE 10-19 in the sth industry domain
For the non-certainty employment stratum for the selected industry domain with TE 20-99, the adjusted weight (W'spj) was
where:
Nsp = total number of establisments in the non-certainty employment stratum with TE 20-99 for the selected industry domain within each geographic domain (region)
n'sp = number of responding establishments in the non-certainty employment stratum with TE 20-99 for the selected industry domain within each geographic domain (region)
Response Rate
Response rate for Construction Sector was 92.8 percent (768 out of 828 establishments). This included receipts of "good" questionnaires, partially accomplished questionnaires, reports of closed, moved out or out of scope establishments.
Reports of the remaining non-reporting establishments were imputed based on established imputation methods and from other available administrative data sources. However, reports of establishments which were found to be duplicates, out-of-scope and out of business in 2013, were not imputed.
Limitation of Data
Only the formal sector was covered in the survey.
Concepts and Definitions of Terms
Economic activity is the establishment’s source of income. If the establishment is engaged in several activities, its main economic activity is that which earns the biggest income or revenue.
Total employment is the number of persons who worked in for the establishment as of November 15, 2013.
Paid employees are all persons working in the establishment and receiving pay, as well as those working away from the establishment paid by and under the control of the establishment. Included are all employees on sick leave, paid vacation or holiday. Excluded are consultants, home workers, receiving pure commissions only, and workers on indefinite leave.
Compensation is the sum of salaries and wages, separation/retirement/terminal pay, gratuities, and payments made by the employer in behalf of the employees such as contribution to SSS/GSIS, ECC, PhilHealth, Pag-ibig, etc.
Salaries and wages are payments in cash or in kind to all employees, prior to deductions for employee’s contributions to SSS/GSIS, withholding tax, etc. Included are total basic pay, overtime pay and other benefits.
Income or Revenue refers to cash received and receivables for goods/products and by-products sold and services rendered.
E-commerce refers to the selling of products or services over electronic systems such as Internet Protocol-based networks and other computer networks. Electronic Data Interchange (EDI) network, or other on-line system. Excluded are orders received from telephone, facsimile and e-mails.
Cost refers to all expenses incurred during the year whether paid or payable. Valuation is at purchaser prices including taxes and other charges, net of rebates, returns and allowances. Goods and services received by the establishment from other establishments of the same enterprise are valued as though purchased.
Expense refers to cost incurred by the establishment during the year whether paid or payable. This is treated on a consumed basis.
Intermediate expense are expenditures incurred for construction activity such as construction materials and supplies purchased, fuels, lubricants, oils and greases purchased, electricity and water purchased, and contract and commission work done by others plus beginning inventory of construction materials, supplies, fuels, lubricants, oils and greases less ending inventory of materials, supplies, fuels, lubricants, oils and greases.
Value added is gross output less intermediate cost. Gross output for construction sector is value of output plus income from non-industrial services done for others (except rent income from land). Intermediate cost is intermediate expense plus expense for non-industrial services done by others (except rent expense for land) and other expenses.
Value of output represents the sum of the receipts from domestic construction activities, net income earned from construction abroad, contract and commission work done for others, income from products manufactured and sold less cost of products sold, and goods sold in the same condition as purchased less the cost of goods sold; and value of tangible fixed assets produced on own account and change in inventories of finished products and work-in-progress.
Gross addition to tangible fixed assets is equal to capital expenditures less sale of fixed assets, including land.
Change in inventories is equivalent to the value of inventories at the end of the year less the value of inventories at the beginning of the year.
Inventories refer to the stock of goods owned by and under the control of the establishment as of a fixed date, regardless of where the stocks are located. Valuation is at current replacement cost in purchaser prices. Replacement cost is the cost of an item in terms of its present price rather than its original cost.
Subsidies refer to special grants in the form of financial assistance or tax exemption or tax privilege received from the government to aid and develop an industry.
| Attachment | Size |
|---|---|
|
|
14.66 KB |
|
|
7.1 KB |