
The first component in the compendium covers statistics on the physical, biological, and chemical characteristics of the environment and their changes over time. This component has three subcomponents: physical conditions; land cover, ecosystems and biodiversity; and environmental quality. These statistics are useful in compiling ecosystem accounts as described in the System of Environmental Economic-Accounting (SEEA) 2012.
Subcomponent 1.1: Physical Conditions
The first subcomponent, Physical Conditions, focuses on statistics on the meteorological, hydrographical, geological and geographical conditions, and soil characteristics. Statistics under this subcomponent can assist in determining the scope and influences on the environmental resources of a country.
The data from the Philippine Atmospheric, Geophysical and Astronomical Services Administration (PAGASA) showed that over the period of 2010 to 2019, January was recorded as the coldest month while May was noted as the warmest, with average temperatures of 25.8 degrees Celsius and 28.9 degrees Celsius1/, respectively. (Table 1.1)
Throughout the ten-year period, the annual average amount of rainfall fluctuated. In 2011, the highest average rainfall was 3.6 thousand millimeters. On the other hand, the lowest average rainfall was recorded in 2015, at 2.0 thousand millimeters2/. (Table1.3)
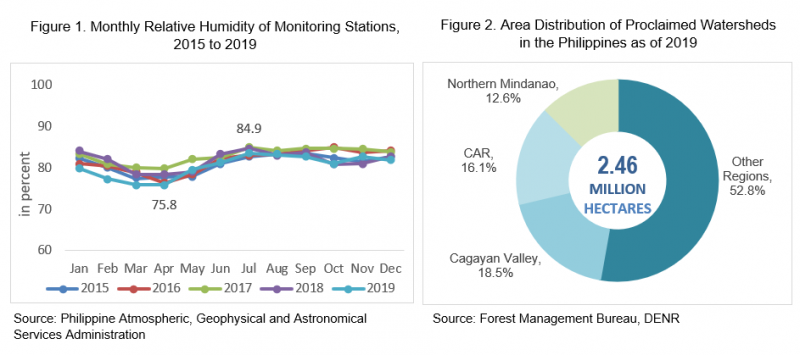
Relative humidity (RH) is the ratio of actual vapor pressure to saturation vapor pressure in the air at a height of 1.25 to 2.00 meters above ground for the prevailing temperature. During the five-year period of 2015 to 2019, the month of April in 2019 had the lowest relative humidity of 75.8 percent, while July of 2017 had the highest relative humidity of 84.9 percent3/. (Table 1.4 and Figure 1)
As of 2019, the Philippines has a total of 2.46 million hectares of proclaimed watersheds. The top three regions with largest share of the total area are as follows: Cagayan Valley (18.5%), Cordillera Administrative Region (CAR) (16.1%), and Northern Mindanao (12.6%); other regions accounted for 52.8% of the total area. (Figure 2)
Subcomponent 1.2: Land Cover, Ecosystems and Biodiversity
Ecosystems and biodiversity cover information on the physical quantitative as well as qualitative information and statistics about a country’s main ecosystems, including the extent, chemical and physical characteristics, and biological components (biodiversity) of the ecosystems.
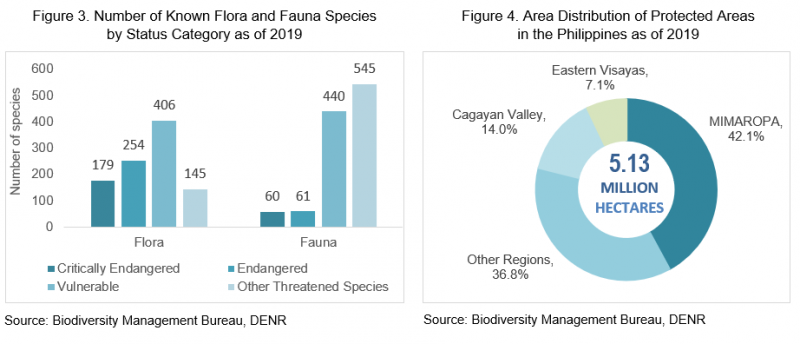
Most known flora species in the Philippines are considered vulnerable (406 species), comprising 41.0 percent of the total known flora species. Other threatened species (545 species) account for 49.0 percent of the fauna. (Figure 3)
The Philippines has about 5.13 million hectares of protected area, 63.0 percent of which is comprised by the three regions with largest shares of protected area. These are: MIMAROPA, Cagayan Valley, and Eastern Visayas. Other regions collectively comprise 37.0 percent of the total protected area. (Figure 4)
Subcomponent 1.3: Environmental Quality
Statistics on environmental quality are important in monitoring pollution impacts to human sub-system and ecosystems. Concentration of air pollutants, suspended solid particles, and other gases are the statistics compiled for this subcomponent. Air quality is measured by monitoring stations which are located mostly near the major sources of pollution.
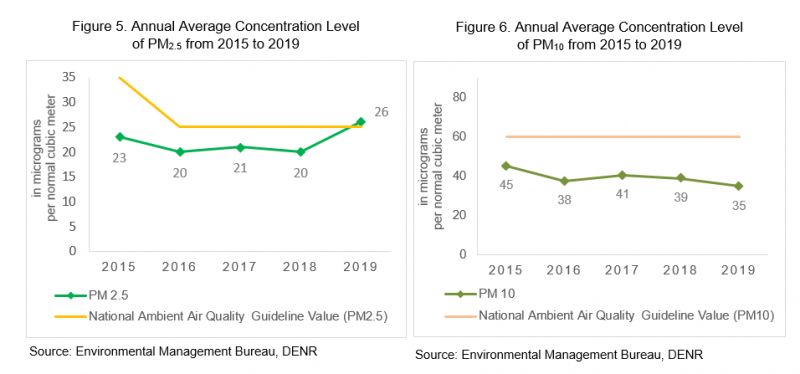
Moreover, statistics on the concentration level of particulate matter (PM2.5 and PM10) serve as inputs to indicator 3.9.1 - Mortality rate attributed to household and ambient air pollution under SDG 3: Good Health and Well-Being and indicator 11.6.2 - Annual mean levels of fine particulate matter in cities under SDG 11: Sustainable Cities and Communities.
The National Ambient Air Quality Guideline Value (NAAQGV) for PM2.5 was 35 micrograms per normal cubic meter until end of 2015 and was changed to 25 micrograms per normal cubic meter starting 2016. The annual average concentration level of PM2.5 was within these parameters from 2015 to 2018 and exceeded to 26 micrograms per normal cubic meter in 2019. (Figure 5)
From 2015 to 2019, the annual average concentration level of PM10 was within the NAAQGV of 60 micrograms per normal cubic meter. (Figure 6)
The Compendium of Philippine Environment Statistics follows the United Nations Framework for the Development of Environment Statistics (FDES) 2013. Among the 141 statistics identified in the FDES, a total of 42 statistics were compiled for Component 1 for this edition of the Compendium.
1/ Average Temperatures were derived by averaging the monthly Mean Temperature gathered from monitoring stations from 2010 to 2019
2/ Average Rainfall was derived by averaging the annual Amount of Rainfall gathered from monitoring stations from 2010 to 2019
3/ Relative humidity was derived by averaging the monthly Relative Humidity gathered from monitoring stations from 2015 to 2019
DENNIS S. MAPA, Ph.D.
Undersecretary
National Statistician and Civil Registrar General