
Population growth rate decreased to 2.06 percent
Agusan del Sur registered a total population of 559,294 persons in Census 2000, an increase of 44,558 persons from 1995 Census of Population. This figure translated to an annual growth rate of 1.79 percent, a sudden decrease of 2.06 percentage points from that of the 1990 to 1995 period. The number of households also rose to 103,637, compared to 95,188 households from the 1995 figure. The average household size was 5.39 persons, the same as that of 1995 but higher than the national average of five persons.
Table A. Total Population by Province, Caraga: 1995 and 2000
| Province | Total Population | |
| 1995 | 2000 | |
| Caraga | 1,942,687 | 2,095,367 |
| Agusan del Norte | 267,411 | 285,570 |
| Butuan City | 247,074 | 267,279 |
| Agusan del Sur | 514,736 | 559,294 |
| Surigao del Norte | 442,203 | 481,416 |
| Surigao del Sur | 471,263 | 501,808 |
Source: NSO, 2000 Census of Population and Housing
Prosperidad, the provincial capital contributed 12.66 percent to the total population
Of the 14 municipalities comprising Agusan del Sur, Bayugan contributed the biggest proportion (16.74 percent) to the total provincial population. Prosperidad, the provincial capital, contributed 12.66 percent. San Francisco (10.19 percent) and Esperanza (7.89 percent) followed. The least populous was La Paz with 3.73 percent share to the total provincial population.
Agusan del Sur, the biggest province in the Caraga Region in terms of population
Agusan del Sur was the biggest province in terms of population in the Caraga Region contributing 26.69 percent to the 2.1 million population in the region. At the national level, the province shared 0.73 percent to the total population of 76.5 million as recorded in the 2000 Census of Population and Housing.
Agusan del Sur had a median age of 18 years old
Agusan del Sur had a median age of 18 years both in 2000 and 1995 censuses. The percentage of the total population belonging to the age group 0 to 14 years was 43.0 percent. The oldest group (65 years and over) accounted for 2.7 percent of the total population of the province while 54.3 percent belonged to the economically active population aged 15 to 64 years.

In 2000, overall dependency ratio was 84
The overall dependency ratio in 2000 was 84.19. This meant that for every 100 persons aged 15 to 64 years, there were about 84 dependents (79 persons aged 0 to 14 - young dependents; and 5 persons aged 65 and over & old dependents).
Females dominated the higher levels of education
About 55 percent of household population five years old and over had completed elementary education, 23.11 percent had finished high school, and 5.47 percent attended college. Only 1.79 percent were academic degree holders. Males dominated the elementary level with 54.26 percent, while females dominated the higher levels of education from high school to post baccalaureate.
Most were Cebuanos
Most of the population in Agusan del Sur classified themselves as Cebuanos (30.7 percent). About 15.7 percent as Manobo and 9.1 percent as Hiligaynon. Other ethnic groups included Boholano (7.1 percent) and Butuanon (4.3 percent).
About 46 percent were still single
Almost half of the household population 10 years and over were single (46.09 percent) while 43.20 percent were married. The remaining 11.0 percent were either widowed, divorced/separated, or with other/unknown marital status.
Housing unit occupancy rate was almost 100 percent
The total housing units in Agusan del Sur was 101,942, of which 101,926 were occupied or an almost 100 percent occupancy rate. This registered an increase of 5.30 percentage points from 1990 and a ratio of 1.02 households per occupied housing unit or a ratio of 5.48 persons per occupied housing unit.
Most households preferred single houses
Majority (97.1 percent) of the occupied housing units were single houses. About two out of three housing units needed no repair/minor repair, and 49.3 percent were built from 1996 to 2000.
Households preferred cogon/nipa/anahaw for the roof of their houses and wood as walls
As to the construction materials used for housing units, 49.5 percent of the occupied housing units had roof made of cogon/nipa/anahaw while 40.6 percent with galvanized iron. Majority had wood (74.7 percent) as the construction materials of the outer walls.
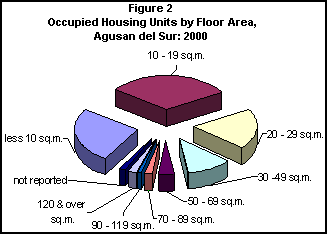
Many housing units had a floor area of 10 to 19 square meters
One out of three occupied housing units had a floor area of 10 to 19 square meters. About 26.5 percent had a floor area of less than 10 square meters. Only 3 percent of occupied housing units had a floor area of 90 and over square meters.
(Sgd.) CARMELITA N. ERICTA
| ||||||||||||||||||||||||||||||||||||||||||||||||||||||||||||||||||||||||||||||||
AGUSAN DEL SUR The province of Agusan del Sur occupies almost all of the Agusan River Valley except for the areas covered by Agusan del Norte. Agusan del Sur is bounded on the north by the province of Agusan del Norte, on the east by the province of Surigao del Sur, on the south by the provinces of Davao del Norte and Compostela valley and on the west by the province of Bukidnon. The land is an elongated basin formation with mountain ranges on its eastern and western side. The Agusan River, which flows from Davao del Norte towards Agusan del Norte, runs almost in the middle of the valley. This valley occupies the central longitudinal section of the province. The province is considered the fourth biggest province in the country occupying a land area of 8,965.5 square kilometers. The province lies outside the typhoon belt but is usually suffering depressions when typhoons hit the Visayas and Surigao del Norte. It has no definite dry season; rainfalls are heaviest during the period October to January. The name Agusan del Sur is a very interesting sideline in the history of the province. The name Agusan came from the word "Agasan" which means, "where the water flows". Agusan del Sur and its sister province Agusan del Norte were once part of Surigao and later of Agusan, until their creation as separate provinces on June 17, 1967 under Republic Act No. 4979. |
Table 1. Total Population Distribution by Municipality and Sex: Agusan del Sur, 2000
| Municipalities | Total Population | Percent | Male | Female |
| Agusan del Sur | 559,294 | 100.00 | 289,764 | 269,530 |
| Bayugan | 93,623 | 16.74 | 48,100 | 45,523 |
| Bunawan | 26,704 | 4.77 | 14,025 | 12,679 |
| Esperanza | 44,151 | 7.89 | 22,949 | 21,202 |
| La Paz | 20,880 | 3.73 | 10,728 | 10,152 |
| Loreto | 31,365 | 5.61 | 16,529 | 14,836 |
| Prosperidad | 70,815 | 12.66 | 36,591 | 34,224 |
| Rosario | 28,675 | 5.13 | 14,841 | 13,834 |
| San Francisco | 56,968 | 10.19 | 29,308 | 27,660 |
| San Luis | 25,901 | 4.63 | 13,439 | 12,462 |
| Sta. Josefa | 22,730 | 4.06 | 11,649 | 11,081 |
| Talacogon | 30,879 | 5.52 | 16,014 | 14,865 |
| Trento | 41,696 | 7.46 | 21,521 | 20,175 |
| Veruela | 36,222 | 6.48 | 19,140 | 17,082 |
| Sibagat | 28,685 | 5.13 | 14,930 | 13,755 |
Source: NSO, 2000 Census of Population and Housing
Table 2. Total Population by Age Group, Sex and Sex Ratio: Agusan del Sur, 2000
| Age Group | Total Population | Male | Female | Sex Ratio |
| Agusan del Sur | 559,294 | 289,764 | 269,530 | 107.51 |
| Under 1 | 15,909 | 8,227 | 7,682 | 107.09 |
| 1 to 4 | 62,682 | 32,242 | 30,440 | 105.92 |
| 5 to 9 | 83,665 | 42,612 | 41,053 | 103.80 |
| 10 to 14 | 78,433 | 39,907 | 38,526 | 103.58 |
| 15 to 19 | 61,290 | 31,526 | 29,764 | 105.92 |
| 20 to 24 | 46,113 | 24,152 | 21,961 | 109.98 |
| 25 to 29 | 39,332 | 20,613 | 18,719 | 110.12 |
| 30 to 34 | 36,843 | 19,313 | 17,530 | 110.17 |
| 35 to 39 | 33,169 | 17,472 | 15,697 | 111.31 |
| 40 to 44 | 27,449 | 14,423 | 13,026 | 110.72 |
| 45 to 49 | 20,798 | 11,033 | 9,765 | 112.99 |
| 50 to 54 | 15,849 | 8,275 | 7,574 | 109.26 |
| 55 to 59 | 12,304 | 6,491 | 5,813 | 111.66 |
| 60 to 64 | 10,501 | 5,576 | 4,925 | 113.22 |
| 65 to 69 | 6,703 | 3,608 | 3,095 | 116.58 |
| 70 to 74 | 4,198 | 2,239 | 1,959 | 114.29 |
| 75 to 79 | 2,200 | 1,124 | 1,076 | 104.46 |
| 80 & Over | 1,856 | 931 | 925 | 100.65 |
Source: NSO, 2000 Census of Population and Housing
Table 3. Household Population 5 Years Old and Over by Highest Educational Attainment and Sex: Agusan del Sur, 2000
| Highest Educational Attainment | Household Population 5 Years Old & Over | Male | Female |
| Agusan del Sur | 479,862 | 248,675 | 231,187 |
| No Grade Completed | 40,863 | 21,671 | 19,192 |
| Pre-School | 10,706 | 5,436 | 5,270 |
| Elementary | 265,090 | 143,835 | 121,255 |
| High School | 110,900 | 53,175 | 57,725 |
| Post Secondary | 6,801 | 3,282 | 3,519 |
| College Undergraduate | 26,252 | 12,649 | 3,603 |
| Academic Degree Holder | 8,595 | 3,428 | 5,167 |
| Post Baccalaureate | 1,901 | 730 | 1,171 |
| Not Stated | 8,754 | 4,469 | 4,285 |
Source: NSO, 2000 Census of Population and Housing
Table 4. Total Population 10 Years Old and Over by Age Group and Marital Status: Agusan del Sur, 2000
| Age Group | Total Population 10 Yrs Old & Over | Single | Married | Widowed | Divorced/ Separated | Others | Unknown |
| Agusan del Sur | 397,038 | 183,010 | 171,382 | 13,385 | 2,883 | 23,509 | 2,869 |
| Below 20 | 139,723 | 132,627 | 2,864 | 88 | 63 | 2,241 | 1,840 |
| 20 - 24 | 46,113 | 28,558 | 12,410 | 111 | 210 | 4,390 | 434 |
| 25 - 29 | 39332 | 11,444 | 22,966 | 192 | 309 | 4,211 | 210 |
| 30 - 34 | 36,843 | 4,828 | 27,783 | 383 | 438 | 3,310 | 101 |
| 35 - 39 | 33,169 | 2,377 | 26,868 | 630 | 419 | 2,807 | 68 |
| 40 - 44 | 27,449 | 1,176 | 22,877 | 901 | 395 | 2,054 | 46 |
| 45 - 49 | 20,798 | 721 | 17,087 | 1,189 | 296 | 1,474 | 31 |
| 50 - 54 | 15,849 | 434 | 12,597 | 1,476 | 247 | 1,071 | 24 |
| 55 - 59 | 12,304 | 301 | 9,470 | 1,557 | 205 | 746 | 25 |
| 60 - 64 | 10,501 | 225 | 7,582 | 1,951 | 143 | 568 | 32 |
| 65 - 69 | 6,703 | 142 | 4,555 | 1,618 | 68 | 309 | 11 |
| 70 - 74 | 4,198 | 89 | 2,478 | 1,391 | 52 | 171 | 17 |
| 75 - 79 | 2,200 | 47 | 1,104 | 929 | 23 | 86 | 10 |
| 80 & Over | 1,856 | 41 | 741 | 968 | 15 | 71 | 20 |
Source: NSO, 2000 Census of Population and Housing
Table 5. Household Population by Ethnicity and Sex: Agusan del Sur, 2000
| Ethnicity | Both Sexes | Male | Female |
| Agusan del Sur | 558,414 | 289,126 | 269,288 |
| Cebuano | 171,276 | 88,549 | 82,727 |
| Manobo | 87,543 | 45,104 | 42,439 |
| Hiligaynon | 50,707 | 26,705 | 24,002 |
| Boholano | 39,765 | 20,764 | 19,001 |
| Butuanon | 23,865 | 12,185 | 11,680 |
| Others | 182,730 | 94,526 | 88,204 |
| Other Foreign Ethnicity | 102 | 63 | 39 |
| Not Reported | 2,426 | 1,230 | 1,196 |
Source: NSO, 2000 Census of Population and Housing
Table 6. Total Occupied Housing Units, Households, Household Population and Ratio of Households and Household Population to Occupied Housing Unit by Type of Building: Agusan del Sur, 2000
| Type of Building | Occupied Housing Unit | Household | Household Population | Ratio of Household & Household Population | |
| Household to Occupied Housing Unit | Household Population to Occupied Housing Unit | ||||
| Agusan del Sur | 101,926 | 103,637 | 558,414 | 1.02 | 5.48 |
| Single House | 98,922 | 100,471 | 541,987 | 1.02 | 5.48 |
| Duplex | 776 | 828 | 4,291 | 1.07 | 5.53 |
| Multi-Unit Residential | 916 | 987 | 4,605 | 1.08 | 5.03 |
| Commercial/Industrial/Agricultural | 508 | 538 | 2,628 | 1.06 | 5.17 |
| Institutional Living Quarters | 17 | 18 | 88 | 1.06 | 5.18 |
| Other Housing Unit | 8 | 9 | 29 | 1.13 | 3.63 |
| Not Reported | 779 | 786 | 4,786 | 1.01 | 6.14 |
Source: NSO, 2000 Census of Population and Housing
Table 7. Occupied Housing Units by Floor Area: Agusan del Sur, 2000
| Floor Area | 2000 | Percent |
| Agusan del Sur | 101,926 | 100.00 |
| Less 10 square meters | 27,005 | 26.5 |
| 10 - 19 square meters | 32,642 | 32.0 |
| 20 - 29 square meters | 19,589 | 19.2 |
| 30 - 49 square meters | 11,942 | 11.7 |
| 50 - 69 square meters | 4,302 | 4.2 |
| 70 - 89 square meters | 1,874 | 1.8 |
| 90 - 119 square meters | 1,373 | 1.3 |
| 120 & over square meters | 1,712 | 1.7 |
| Not reported | 1,487 | 1.5 |
Source: NSO, 2000 Census of Population and Housing
TECHNICAL NOTES Average Household Size - average number of people who live in the household Growth Rate - the rate at which the population is increasing (or decreasing) in a given year due to natural increase and net migration, expressed as a percentage of the base population Median Age - the age at which exactly half of the population is young and half is old Sex Ratio - the ratio of males to females in a given population expressed as the number of males per 100 females Age-Dependency Ratio - the ratio of persons in the "dependent" ages (under 15 years and over 64 years) to those in the "economically productive" ages (15 to 64 years old) in the population Household - a social unit consisting of a person or a group of persons who sleep in the same housing unit and have common arrangements in the preparation and consumption of food The 2000 Census of Population and Housing (Census 2000) was undertaken by the National Statistics Office (NSO) in May 2000, as mandated by Commonwealth Act No. 591, Batas Pambansa Blg. 72 and Executive Order No. 121. It was the 11th census of population and 5th census of housing undertaken in this country since the first census in 1903. It was designed to take an inventory of the total population and housing units all over the Philippines and to collect information about their characteristics. Census day for the Census 2000 was May 1, 2000 (12:01 a.m.). Enumeration started on May 1, 2000 and lasted for about 30 days. |