
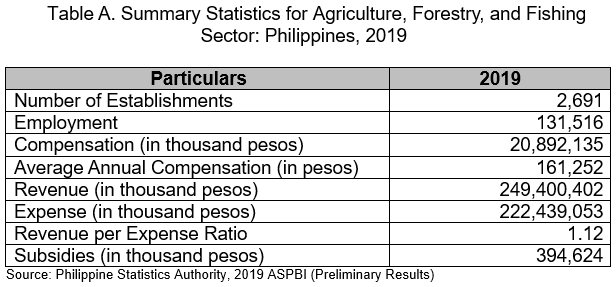
Animal production activities dominated the agriculture sector in terms of number of establishments
The preliminary results of the Annual Survey of Philippine Business and Industry (ASPBI) showed that a total of 2,691 establishments in the formal sector of the economy were engaged in agriculture in 2019. (Table A and 1)
Among the industry groups of the sector, animal production posted the highest number of establishments of 1,262 (46.9%). Growing of non-perennial crops recorded 412 establishments (15.3%) and support activities to agriculture and post-harvest crop activities with 365 establishments (13.6%) ranked second and third, respectively. (Figure 1 and Table 1)
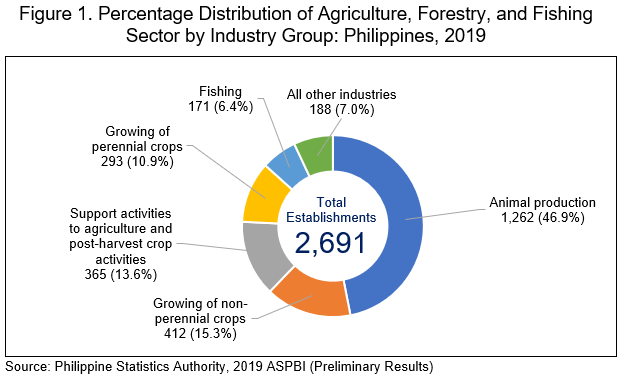
Growing of perennial crops industry employed the highest number of workers
The total employment for the agriculture, forestry, and fishing sector was recorded at 131,516 workers in 2019. Of the total, majority of the workers were paid employees numbering to 129,562 (98.5%), while the rest were working owners and unpaid workers. (Tables A and 1)
Growing of perennial crops employed the highest with a total of 39,707 workers (30.2%) of the total employment in the sector. This was followed by animal production industry with 34,341 employees (26.1%), and growing of non-perennial crops with 24,233 employees (18.4%). (Figure 2 and Table 1)
In 2019, the sector’s average number of workers per establishment was estimated at 49. (Tables A and 2)
Of the 10 industry groups, the growing of perennial crops had the highest average of 136 employees per establishment. It was followed by fishing with an average of 97 employees per establishment, and growing of non-perennial crops with 59 employees per establishment. These three industry groups had an average employment per establishment ratio higher than the national level. (Table 2)
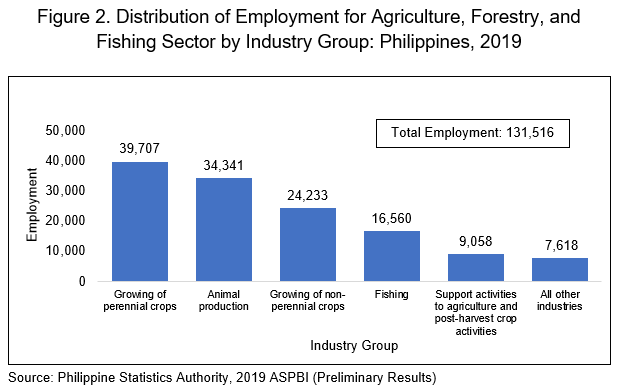
Industries engaged in logging paid the highest average annual compensation
In 2019, the total compensation paid by the sector to its employees amounted to PhP 20.89 billion. This translates to an average annual compensation of PhP 161.25 thousand per paid employee. (Tables A, 1 and 2)
Employees from logging industries received the highest average annual compensation of PhP 425.96 thousand in 2019. The other three industry groups that registered an average annual compensation higher than the national level were as follows: growing of perennial crops with PhP 194.47 thousand average annual compensation; animal production with PhP 181.85 thousand average annual compensation; and support activities to agriculture, and post-harvest crop activities with PhP 179.73 thousand average annual compensation. (Figure 3 and Table 2)
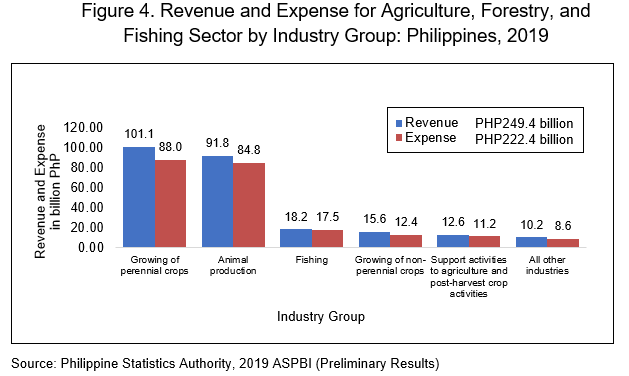
Growing of perennial crops industries contributed the major shares to total revenue and total expense
The total revenue generated by the agriculture, forestry and fishing sector reached PhP 249.40 billion and the total expense amounted to PhP 222.44 billion total expense in 2019. (Figure 4 and Table 1)
Out of the 10 industry groups of the sector, the top grosser in terms of revenue was the growing of perennial crops with revenue amounted to PhP 101.10 billion (40.5%). On the other hand, plant propagation generated the lowest revenue of PhP 50.51 million (0.02%).
Also, in terms of expenses, the growing of perennial crops industry incurred the biggest share to total with PhP 87.98 billion (39.6%). On the other hand, plant propagation industry incurred the lowest contribution to total expense with PhP 27.72 million (0.01%). (Figure 4 and Table 1)
Plant propagation posted the highest revenue per expense ratio
The revenue per peso expense by the sector stood at 1.12 in 2019. This means that for every peso spent, a corresponding revenue of 1.12 pesos was earned. (Tables A and 2)
The top three industry groups that registered the highest revenue per peso expense were as follows: plant propagation recorded revenue-expense ratio of 1.82; logging industry with 1.60 revenue-expense ratio; and silviculture and other forestry activities with a revenue-expense ratio of 1.31. (Table 2)
Subsidies amounted to PhP 394.62 million
Subsidies are grants received from the government in the form of financial assistance or tax exemption to aid and develop an industry. Total subsidies received by the sector from the government amounted to PhP 394.62 million in 2019. (Tables A and 1)
(Sgd.) DENNIS S. MAPA
Undersecretary
National Statistician and Civil Registrar General
Philippine Statistics Authority
TECHNICAL NOTES
I. Introduction
This Special Release presents the preliminary results of the 2019 Annual Survey of Philippine Business and Industry (ASPBI) for Agriculture, Forestry, and Fishing establishments (Sector A).
The ASPBI is one of the designated statistical activities of the Philippine Statistics Authority (PSA). Data collected from the survey provide information on the levels, structure, performance, and trends of economic activities of the formal sector in the entire country for the year 2019.
The conduct of the 2019 ASPBI is authorized under Republic Act No. 10625 known as the Philippine Statistical Act of 2013 which mandates reorganizing and strengthening of the Philippine Statistical System (PSS), its agencies and instrumentalities.
II. Data collection and Processing
The survey was conducted nationwide in 2020 with the year 2019 as the reference period, except for employment whose reference period is as of 15 November 2019.
Sample establishments were given various options in accomplishing the survey questionnaire. These were the following:
• online questionnaire available at https://aspbi.psa.gov.ph;
• electronic copy of the questionnaire either in portable document format (.pdf) or Excel (.xlsx) file format; and
• printed copy of the questionnaire.
The Establishment Data Management System (EDMS) was utilized in the decentralized processing of 2019 ASPBI questionnaires in the provinces.
Data are presented by industry group or 3-digit classification as classified under the 2009 Philippine Standard Industrial Classification (PSIC).
III. Taxonomy of Establishments
An establishment is defined as an economic unit under a single ownership or control which engages in one or predominantly one kind of economic activity at a single fixed location.
An establishment is categorized by its economic organization, legal organization, industrial classification, employment size, and geographic location.
Economic Organization refers to the organizational structure or role of the establishment in the organization. An establishment may be single establishment, branch, establishment and main office with branches elsewhere, main office only, or an ancillary unit other than main office.
Legal Organization refers to the legal form of the economic entity which owns the establishment. An establishment may be single proprietorship, partnership, government corporation, stock corporation, non-stock corporation, or cooperative.
Industrial classification of an economic unit was determined by the activity from which it derives its major income or revenue. The 2009 PSIC which was approved for adoption by government agencies and instrumentalities through PSA Resolution No. 01 Series of 2017-158 signed on 14 February 2017 was utilized to classify economic units according to their economic activities.
Size of an establishment is determined by its total employment as of the time of visit during the latest Updating of the List of Establishments.
Total Employment (TE) refers to the total number of persons who work in or for the establishment. This includes paid employees, working owners, unpaid workers and all employees who work full-time or part-time including seasonal workers. Also included are persons on short-term leave such as those on sick, vacation or annual leaves, and on strike.
Geographic Classification refers to the grouping of establishments by geographic area using the Philippine Standard Geographic Code (PSGC) classification. The PSGC contains the latest updates on the official number of regions, provinces, cities, municipalities, and barangays in the Philippines. The PSGC as of 31 December 2019 was used for the 2019 ASPBI.
IV. Scope and Coverage
The 2019 ASPBI covered establishments engaged in 18 economic sectors classified under the 2009 PSIC, namely:
Agriculture, Forestry and Fishing (A)
Mining and Quarrying (B)
Manufacturing (C)
Electricity, Gas, Steam, and Air Conditioning Supply (D)
Water Supply; Sewerage, Waste Management and Remediation Activities (E)
Construction (F)
Wholesale and Retail Trade; Repair of Motor Vehicles, and Motorcycles (G)
Transportation and Storage (H)
Accommodation and Food Service Activities (I)
Information and Communication (J)
Financial and Insurance Activities (K)
Real Estate Activities (L)
Professional, Scientific and Technical Activities (M)
Administrative and Support Service Activities (N)
Education (P)
Human Health and Social Work Activities (Q)
Arts, Entertainment and Recreation (R)
Other Service Activities (S)
The survey was confined to the formal sector of the economy, which consists of the following:
Corporations and partnership
Cooperatives and foundations
Single proprietorship with employment of 10 and over
Single proprietorships with branches
Hence, the 2019 ASPBI covered only the following economic units:
All establishments with total employment (TE) of 10 or more; and
All establishments with TE of less than 10, except those establishments with Legal Organization = 1 (single proprietorship) and Economic Organization = 1 (single establishment), that are engaged in economic activities classified according to the 2009 Philippine Standard Industrial Classification.
V. Sampling Design
The 2019 ASPBI uses stratified systematic sampling design with 3-digit or 5-digit PSIC as the first stratification variable, depending on the sector, and total employment, which is classified into Micro, Small, Medium establishments (MSME), as the second stratification variable.
Stratified systematic sampling is a process of dividing the population into homogeneous groups, called strata, and then selecting independent samples in each stratum systematically. This method ensures that all important subgroups of the population are represented in the sample and increases precision of “overall” survey estimates.
Domain
The geographic domain of the 2019 ASPBI is region. The industry domain/stratum is 3-digit or 5-digit industry classification, and the employment domain/stratum is the MSME classification.
Unit of Enumeration
The unit of enumeration for the 2019 ASPBI is the establishment.
Sampling Frame of Establishments
The sampling frame for the 2019 ASPBI was extracted from the preliminary 2019 List of Establishments (LE) as of 05 February 2020. This frame was used to draw the sample establishments for the survey. The preliminary 2019 LE showed that there were 1,000,524 establishments in operation in the country of which 336,712 establishments comprised the sampling frame or the establishments that are within the scope and coverage of the 2019 ASPBI.
Estimation Procedure
1.) Estimation of Survey Weights
Base Weight
The base weight is the inverse of the probability of selection. For the ASPBI, the base weight for each domain is given by:

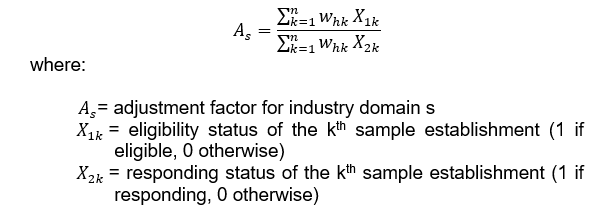
Adjustment Factor
To take into account the non-responding sample establishments, the adjustment factor by region and industry domain is as follows:
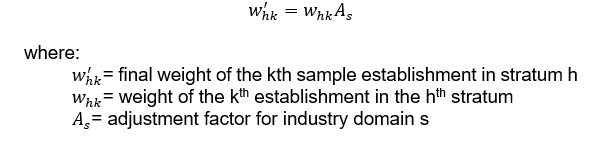
Final Weight
The final weight is the product of the base weight and adjustment factor. That is,
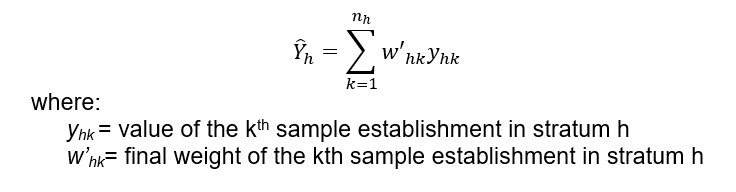
2.) Estimation of Total
Total by Industry-Employment Stratum
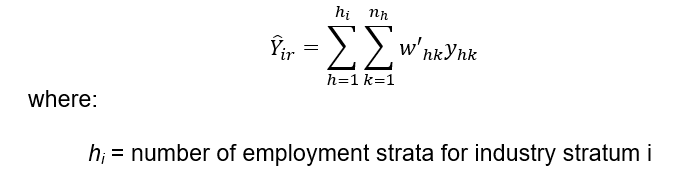
The estimator for the total of a characteristic in each industry-employment stratum in a region (geographic domain) is given by:
Total by Industry Stratum and Domain
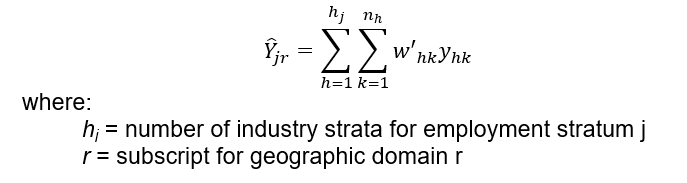
The estimator for the total of a characteristic in each industry stratum in each regional domain is given by:
Total by Employment Stratum and Domain
The estimator for the total of a characteristic in each employment stratum in each regional domain is given by:
Total by Geographic Domain
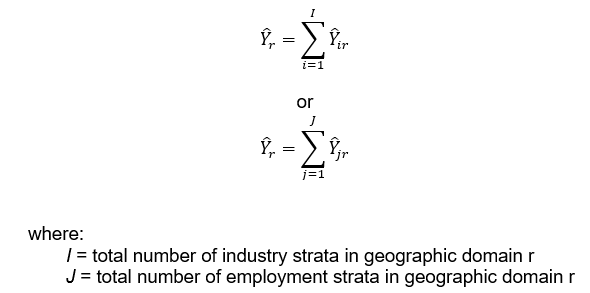
The estimator for the total of a characteristic in each geographic domain is given by:
Total by Industry Stratum (National)
The estimator for the national total of a characteristic in each industry domain/stratum is given by:

Total by Employment Stratum (National)
The estimator for the national total of a characteristic in each employment domain/stratum is given by:

National Total
The estimator for the national total of a characteristic is given by:

VI. Response Rate
Response rate for all Agriculture, Forestry, and Fishing sector was 93.6 percent (890 out of 951 establishments). This included receipts of "good" questionnaires, partially accomplished questionnaires, and reports of closed, moved out or out-of-scope establishments.
Of the total responses, 14 establishments responded online.
Reports of establishments which were found to be duplicate of another establishment, out-of-scope and out of business in 2019 were not included in the generation of statistical tables.
VII. Concepts and Definitions of Terms
Compensation is the sum of salaries and wages, separation/retirement/terminal pay, gratuities, and payments made by the employer on behalf of the employees such as contribution to SSS/GSIS, ECC, PhilHealth, Pag-ibig, etc.
Establishment is an economic unit under a single ownership and control, i. e. under a single entity, engaged in one or predominantly one kind of economic activity at a single fixed location.
Expense is the cost incurred by the establishment during the year whether paid or payable. This is treated on a consumed basis. Valuation is at purchaser price including taxes and other charges, net of rebates, returns and allowances. Goods and services received by the establishment from other establishments of the same enterprise are valued as though purchased.
Paid employees are all persons working in the establishment and receiving pay, as well as those working away from the establishment paid by and under the control of the establishment. Included are all employees on sick leave, paid vacation or holiday. Excluded are consultants, home workers, receiving pure commissions only, and workers on indefinite leave.
Revenue is the cash received and receivables for goods/products and by-products sold and services rendered. Valuation is at producer prices (ex-establishment) net of discounts and allowances, including duties and taxes but excluding subsidies.
Salaries and wages are payments in cash or in kind to all employees, prior to deductions for employee’s contributions to SSS/GSIS, withholding tax, etc. Included are total basic pay, overtime pay and other benefits.
Subsidies are special grants in the form of financial assistance or tax exemption or tax privilege given by the government to aid and develop an industry.