
Other financial service activities, except insurance and pension funding industry leads the sector in terms of number of establishments
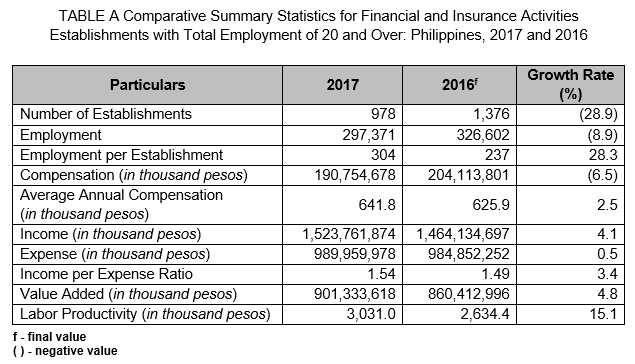
The preliminary results of the Annual Survey of Philippine Business and Industry (ASPBI) showed that a total of 978 establishments with total employment (TE) of 20 and over in the formal sector of the economy were engaged in financial and insurance activities in 2017. This represents a 28.9 percent decrease from the previous year’s report of 1,376 establishments.
Among the industry groups, other financial service activities, except insurance and pension funding activities recorded the most number of establishments comprising 447 or 45.7 percent of the total. Monetary intermediation followed with 237 establishments (24.2%).
Figure 1 shows the percentage distribution of the number of establishments with TE of 20 and over for Financial and Insurance Activities sector by industry group in 2017.

At the regional level, the National Capital Region (NCR) accounted for the majority of the number of establishments of 507 or 51.8 percent of the total. Central Luzon placed far second with 78 establishments (8.0%). CALABARZON and Central Visayas placed third, each with 64 establishments (6.5%).
Monetary intermediation industry employs the highest number of workers
The total employment of the sector for establishments with TE of 20 and over was recorded at 297,371 workers in 2017, a decrease of 8.9 percent from the reported 326,602 workers in 2016. Of the total employment, 99.9 percent were paid employees and the rest were working owners and unpaid workers.
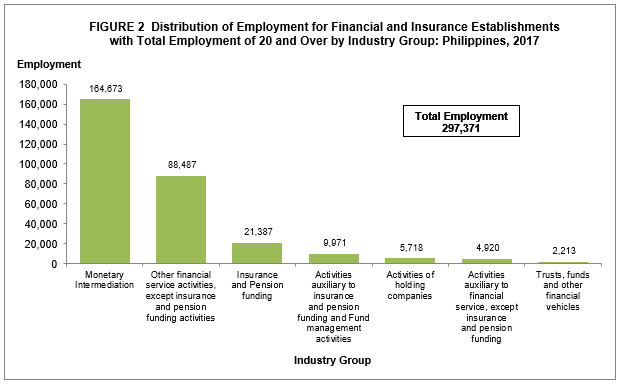
Among the industry groups, monetary intermediation employed more than half of the total number of workers (164.7 thousand or 55.4%). Other financial service activities, except insurance and pension funding activities followed with a total of 88,487 workers (29.8%).
Figure 2 displays the distribution of employment for establishments with TE of 20 and over for the Financial and Insurance activities sector by industry group in 2017.
Region-wise, NCR recorded the biggest share to total employment of 223,303 workers or more than three fourths (75.1%) of the total workforce. CALABARZON placed far second with 18,259 workers (6.1%), followed by Central Visayas with 11,415 workers (3.8%).
The sector recorded an average number of 304 workers per establishment in 2017, higher by 28.3 percent than the reported average workers of 237 in 2016. Monetary intermediation posted the highest average of 695 workers per establishment. Conversely, trusts, funds and other financial vehicles reported the lowest average of 60 workers per establishment.
Employees in activities of holding companies industry are the highest paid
The total compensation paid by the sector for establishments with total employment of 20 and over amounted to PHP190.8 billion in 2017, which translates to an average annual compensation of PHP641.8 thousand per employee. Compared with the average annual pay of PHP 625.9 thousand per employee in 2016, the average pay in 2017 increased by 2.6 percent.
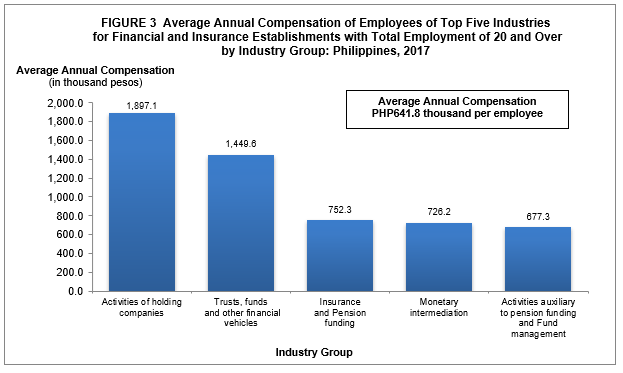
Employees in activities of holding companies were the highest paid receiving an average annual compensation of PHP1,897.1 thousand per employee. Trusts, funds and other financial vehicles followed with an average annual compensation of PHP1,449.6 thousand per employee. However, those employed in other financial service activities, except insurance and pension funding activities were paid the lowest average annual compensation of PHP355.8 thousand per employee.
Figure 3 illustrates the average annual compensation of employees for Financial and Insurance establishments with TE of 20 and over by industry group in 2017.
Employees working in NCR for establishments with TE of 20 and over received the highest average annual compensation of PHP767.3 thousand per employee while those employed in Ilocos Region received the lowest at PHP165.3 thousand per employee.
Monetary intermediation industry contributes the biggest share to total income and expense
Total income realized by establishments with TE of 20 and over reached PHP1.52 trillion in 2017 or an increase of 4.1 percent from the reported PHP1.46 trillion income in 2016.
Among industry groups, monetary intermediation earned the highest income of PHP672.1 billion or 44.1 percent of the total income. Activities auxiliary to financial services, except insurance and pension funding generated the lowest income of PHP10.7 billion or 0.7 percent.
On the other hand, total expense incurred by the sector amounted to PHP990.0 billion in 2017. This was higher by 0.5 percent from the reported total expense of PHP984.9 billion in 2016. Being the major contributor to total income, monetary intermediation also had the highest proportion to total expense worth PHP487.3 billion (49.2%).
Figure 4 shows the top five industry groups in terms of income and expense for establishments with TE of 20 and over for the sector in 2017.

At the regional level, NCR had the highest share to total income and total expense. It earned PHP1.4 trillion or 94.1 percent of the total income and incurred PHP930.7 billion or 94.0 percent of the total expense. On the other hand, CAR contributed the least income of PHP732.8 million (0.05%) and least expense of PHP521.5 million (0.1%).
Financial and insurance establishments with TE of 20 and over for the sector generated an income per peso expense of 1.54 in 2017, higher by 3.4 percent than the income per peso expense reported of 1.49 in 2016. Trusts, funds and other financial vehicles recorded the highest income per peso expense of 2.90, almost twice than that of the sector’s average.
Value added amounts to PHP901.3 billion
The total value added generated by establishments with TE of 20 and over was estimated at PHP901.3 billion in 2017. This represents an increase of 4.8 percent from the reported PHP860.4 billion value added in 2016.
The top three contributors to the total value added were the following industries:
• Monetary intermediation, PHP378.9 billion (42.0 %),
• Other financial service activities, except insurance and pension funding activities, PHP149.2 billion (16.6%), and
• Combined industries of insurance and pension funding PHP145.2 billion (16.1%).
Among the regions, NCR reported the highest value added amounting to PHP838.7 billion or 93.1 percent of the total. Central Visayas and CALABARZON came far second and third with value added of PHP26.2 billion (2.9%) and PHP10.6 billion (1.2%), respectively.
Labor productivity, which is the ratio of value added to total employment, was estimated at PHP3,031.0 thousand per worker in 2017. Activities of holding companies led the sector with labor productivity of PHP24.6 million per worker. On the other hand, activities auxiliary to financial service, except insurance and pension funding reported the lowest labor productivity of PHP1,051.4 thousand per worker.
At the regional level, NCR reported the highest labor productivity of PHP3,756.1 thousand per worker.
Figure 5 indicates the labor productivity of the top five industry groups for Financial and Insurance for establishments with TE of 20 and over in 2017.

(Sgd.) ROSALINDA P. BAUTISTA
Assistant Secretary
Deputy National Statistician
Sectoral Statistics Office
TECHNICAL NOTES
Introduction
This Special Release presents the preliminary results of the 2017 Annual Survey of Philippine Business and Industry (ASPBI) for Financial and Insurance Activities establishments with total employment of 20 and over.
The ASPBI is one of the designated statistical activities of the Philippine Statistics Authority (PSA). Data collected from the survey provide information on the levels, structure, performance, and trends of economic activities of the formal sector in the entire country in 2017.
The survey was conducted nationwide in 2018 with 2017 as the reference period of data, except for employment which is as of 15 November 2017.
The Establishment Data Management System (EDMS) was utilized in the decentralized processing of survey returns in the provinces as well as the online accomplishment of questionnaires through the PSA website.
Data are presented by industry group or 3-digit level of the 2009 Philippine Standard Industrial Classification (PSIC)at the national and regional level.
Legal Authority
The conduct of the 2017 ASPBI is authorized under Republic Act 10625 known as the Philippine Statistical Act of 2013 which mandates reorganizing and strengthening of the Philippine Statistical System (PSS), its agencies and instrumentalities.
Scope and Coverage
The 2017 ASPBI covered establishments engaged in 18 economic sectors classified under the 2009 PSIC, namely:
• Agriculture, Forestry and Fishing (A)
• Mining and Quarrying (B)
• Manufacturing (C)
• Electricity, Gas, Steam, and Air Conditioning Supply (D)
• Water Supply; Sewerage, Waste Management and Remediation Activities (E)
• Construction (F)
• Wholesale and Retail Trade;Repair of Motor Vehicles and Motorcycles (G)
• Transportation and Storage (H)
• Accommodation and Food Service Activities (I)
• Information and Communication (J)
• Financial and Insurance Activities (K)
• Real Estate Activities (L)
• Professional, Scientific and Technical Activities (M)
• Administrative and Support Service Activities (N)
• Education (P)
• Human Health and Social Work Activities (Q)
• Arts, Entertainment and Recreation (R)
• Other Service Activities (S)
The survey was confined to the formal sector of the economy, which consists of the following:
• Corporations and partnership
• Cooperatives and foundations
• Single proprietorship with employment of 10 and over
• Single proprietorships with branches
Hence, the 2017 ASPBI covered only the following economic units:
• All establishments with total employment (TE) of 10 or more, and;
• All establishments with TE of less than 10, except those establishments with Legal Organization = 1 (single proprietorship) and Economic Organization = 1 (single establishment), that are engaged in economic activities classified according to the 2009 Philippine Standard Industrial Classification (PSIC).
Frame of Establishments
The frame for the 2017 ASPBI was extracted from the 2017 List of Establishments (LE). The estimated number of establishments in operation in the country in 2017 totaled to 917,582. About 228,112 establishments (24.9%) of the total establishments comprise the establishment frame or are within the scope and coverage of the 2017 ASPBI.
Unit of Enumeration
The unit of enumeration for the 2017 ASPBI is the establishment. An establishment is defined as an economic unit under a single ownership or control which engages in one or predominantly one kind of activity at a single fixed location.
Taxonomy of Establishments
An establishment is categorized by its economic organization, legal organization, industrial classification, employment size, and geographic location.
Economic Organization refers to the organizational structure or role of the establishment in the organization. An establishment may be single establishment, branch, establishment and main office with branches elsewhere, main office only, and ancillary unit other than main office.
Legal Organization refers to the legal form of the economic entity which owns the establishment. An establishment may be single proprietorship, partnership, government corporation, stock corporation, non-stock corporation, and cooperative.
Industrial classification of an economic unit was determined by the activity from which it derives its major income or revenue. The 2009 PSIC which was approved for adoption by government agencies and instrumentalities through PSA Resolution No. 01 Series 2017-158 signed on 14 February 2017was utilized to classify economic units according to their economic activities.
Size of an establishment is determined by its total employment (TE) as of a specific date. (TE) refers to the total number of persons who work in or for the establishment.
This includes paid employees, working owners, unpaid workers and all employees who work full-time or part-time including seasonal workers. Included also are persons on short term leave such as those on sick, vacation or annual leaves and on strike.
Geographic Classification refers to the grouping of establishments by geographic area using the Philippine Standard Geographic Code (PSGC) classification. The PSGC contains the latest updates on the official number of regions, provinces, cities, municipalities, and barangays in the Philippines. The PSGC as of 31 December 2017 was used for the 2017 ASPBI.
Sampling Design
The 2017 ASPBI uses a stratified systematic sampling with 5-digit PSIC serving as industry strata and employment size as the second stratification variable.
For establishments with TE of 20 and over, the 17 administrative regions serve as geographic domains while the 5 digit level of the 2009 PSIC serves as the industry domains.
Estimation Procedure for Establishments with TE of 20 and Over
a. Non-Certainty Stratum (strata of TE 20 to 49 and TE 50 to 99)
Sections A, C, E, F, G, H, I, J, K, L, M, N, P, Q, R and S.
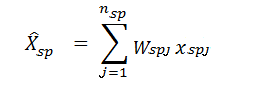
The estimate of the total of a characteristic ![]() for the non-certainty employment strata in TE of 20 and over for an industry domain in each region,
for the non-certainty employment strata in TE of 20 and over for an industry domain in each region,
where:
s = denotes the non-certainty employment strata in TE of 20 and over
p = 1, 2,..., 17 regions (geographic domains)
Xspj = value of the jth establishment in the non-certainty employment strata with TE of 20 and over for an industry domain in each region
j = 1,2,3,..., nsp establishments
Wspj = weight of the jth establishment in the non-certainty employment strata with TE of 20 and over for an industry domain in each region
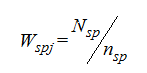
Nsp = total number of establishments in the non-certainty employment strata in TE of 20 and over for an industry domain in each region
nsp = number of sample establishments in the non-certainty employment strata in TE of 20 and over for an industry domain in each region
b. Certainty Stratum (Establishments under the following: Section B, D and J, ICT core industries, BPM industries, GOCCs and with TE 100 and over)

where:
c = denotes the certainty employment strata in TE of 20 and over
p = 1,2,...17 regions (geographic domains)
Xcpj = value of the jth establishment in the certainty employment strata in TE of 20 and over for an industry domain within each region
j = 1,2,3,..., mcp establishments
mcp = number of establishments in the certainty employment strata in TE of 20 and over in an industry domain within each region
c. Total Estimate for TE of 20 and Over
The estimate of the total of a characteristic ![]() for the industry domain in each region (geopraphic domain) was obtained by aggregating the estimates for all employment strata (non-certainty and certainty) in the same industry domain,
for the industry domain in each region (geopraphic domain) was obtained by aggregating the estimates for all employment strata (non-certainty and certainty) in the same industry domain,
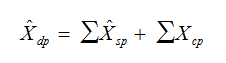
where dp denotes the industry domain in each region.
National level estimate of the the characteristics by industry domain were obtained by aggregating separately the estimates ![]() for the particular industry domain from all the regions.
for the particular industry domain from all the regions.
Weight Adjusment Factor for Non-Response
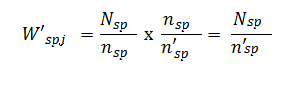
To account for non-response in the non-certainty strata, the adjusment factors (n/n') was multipled with the sampling weight (W) of each of the sampling unit. The sampling weight, defined as N/n was recomputed as
Thus, the adjusted weight (W'spj) for the non-certainty employment stratum for the industry domain with TE 20-99 was
where:
Nsp = total number of establishments in the non-certainty employment stratum with TE 20-99 for the industry domain within each geographic domain (region)
n'sp = number of responding establishments in the non-certainty employment stratum with TE of 20-99 for the industry domain within each geographic domain (region)
Response Rate
Response rate for Financial and Insurance Activities establishments with TE of 20 and over was 92.4 percent (629 out of 681establishments). This included receipts of "good" questionnaires, partially accomplished questionnaires, reports of closed, moved out or out of scope establishments.
Of the total responses, 42 establishments responded online.
Reports of the remaining non-reporting establishments were taken from financial statements from Securities and Exchange Commission (SEC). and other available data sources. Reports of establishments which were found to be duplicate of another establishment’s report, out-of-scope and out of business in 2017 were not included in the generation of statistical tables.
Limitation of Data
The survey covered only the formal sector of the economy.
Concepts and Definition of Terms
Change in inventories is equivalent to the value of inventories at the end of the year less the value of inventories at the beginning of the year.
Compensation is the sum of salaries and wages, separation/retirement/terminal pay, gratuities, and payments made by the employer in behalf of the employees such as contribution to SSS/GSIS, ECC, PhilHealth, Pag-ibig, etc.
E-commerce is to the selling of products or services over electronic systems such as Internet Protocol-based networks and other computer networks. Electronic Data Interchange (EDI) network, or other on-line system. Excluded are orders received from telephone, facsimile and e-mails.
Economic activity is the establishment’s source of income. If the establishment is engaged in several activities, its main economic activity is that which earns the biggest income or revenue.
Establishment is an economic unit under a single ownership and control, i. e. under a single entity, engaged in one or predominantly one kind of economic activity at a single fixed location.
Expense is the cost incurred by the establishment during the year whether paid or payable. This is treated on a consumed basis. Valuation is at purchaser price including taxes and other charges, net of rebates, returns and allowances. Goods and services received by the establishment from other establishments of the same enterprise are valued as though purchased.
Gross additions to tangible fixed assets is equal to capital expenditures less sale of fixed assets, including land.
Income or Revenue is the cash received and receivables for goods/products and by-products sold and services rendered. Valuation is at producer prices (ex-establishment) net of discounts and allowances, including duties and taxes but excluding subsidies.
Inventories are to the stock of goods owned by and under the control of the establishment as of a fixed date, regardless of where the stocks are located. Valuation is at current replacement cost in purchaser prices. Replacement cost is the cost of an item in terms of its present price rather than its original cost.
Paid employees are all persons working in the establishment and receiving pay, as well as those working away from the establishment paid by and under the control of the establishment. Included are all employees on sick leave, paid vacation or holiday. Excluded are consultants, home workers, receiving pure commissions only, and workers on indefinite leave.
Salaries and wages are payments in cash or in kind to all employees, prior to deductions for employee’s contributions to SSS/GSIS, withholding tax, etc. Included are total basic pay, overtime pay and other benefits.
Subsidies are special grants in the form of financial assistance or tax exemption or tax privilege given by the government to aid and develop an industry.
Total employment is the number of persons who worked in for the establishment as of 15 November 2017.
Value added is gross output less intermediate input. Computation of gross output for financial and insurance activities sector varies per industry as presented below:
For PSIC K641, K649 is equal to the sum of net interest income (interest income – interest expense); value of industrial services done for others; value of non-industrial services done for others less rent income from land; service charges; dividend income; commission and fees earned; foreign exchange gains; other income; capital expenditures produced on own account.
For PSIC K651, K652, K6623 is equal to the sum of net premiums earned (insurance premium- insurance claims paid); value of industrial services done for others; value of non-industrial services done for others less rent income from land; dividend income; commission and fees earned; other income; capital expenditures produced on own account.
For PSIC K66130 is equal to the sum of foreign exchange gains; value of industrial services done for others; value of non-industrial services done for others less rent income from land; commission and fees earned; other income; capital expenditures produced on own account.
For PSIC K642 is equal to the sum of dividend income; value of industrial services done for others; value of non-industrial services done for other less rent income from land; commission and fees earned; other income; capital expenditures produced on own account.
For PSIC K643,K66210, K66220, K66290, K66300, K661 except K66130 is equal to the sum of commission and fees earned; value of non-industrial services done for others; other income; capital expenditures produced on own account.
Intermediate input is equal to the sum of the following expense items: materials and supplies purchased; fuels, lubricants, oils and greases purchased; electricity purchased, water purchased; industrial services done by others; non-industrial services done by others less rent expense for land; research and development expense; environmental protection expense; royalty fee; franchise fee; foreign exchange losses and other expense.