
Total number of establishments decreases by 11.2 percent
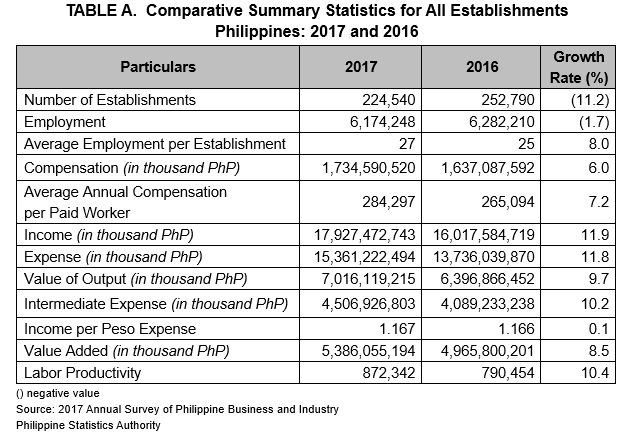
The final results of the Annual Survey of Philippine Business and Industry (ASPBI) showed that in 2017, the Philippines had a total of 224,540 establishments in the formal sector of its economy. This number is lower by 11.2 percent than the 252,790 establishments reported in 2016. (Table A)
Among sectors, Wholesale and Retail Trade; Repair of Motor Vehicles and Motorcycles led in terms of number of establishments with 101,136 or 45.0 percent share to total establishments. This was followed by Accommodation and Food Service Activities with 28,932 (12.9%) establishments and Manufacturing with 24,200 (10.8%) establishments. On the other hand, Mining and Quarrying with 200 (0.1%) establishments reported the least number. (Table 1 and Figure 1)

Manufacturing employs the highest number of workers
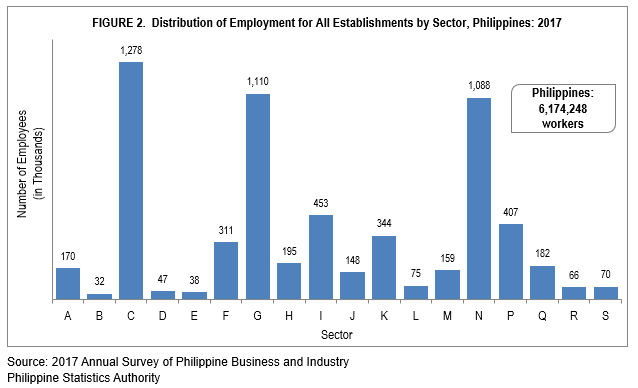
Total employment dipped to 6,174,248 workers in 2017, a decrease of 1.7 percent from the 6,282,210 workers reported in 2016. Manufacturing posted the highest number of workers with 1,278,392 (20.7%), while Mining and Quarrying with 32,125 (0.5%) recorded the least. (Table A and 1, and Figure 2)
Total compensation increases by 6.0 percent
Total compensation amounted to PhP1.7 trillion in 2017, an increase of 6.0 percent from the PhP1.6 trillion in 2016.
Among sectors, Manufacturing paid the highest compensation of PhP370.7 billion, equivalent to more than one-fifth or 21.4 percent share to total compensation of all sectors in 2017. Other Service Activities paid the least compensation of PhP7.9 billion (0.5%). (Tables A and 1)
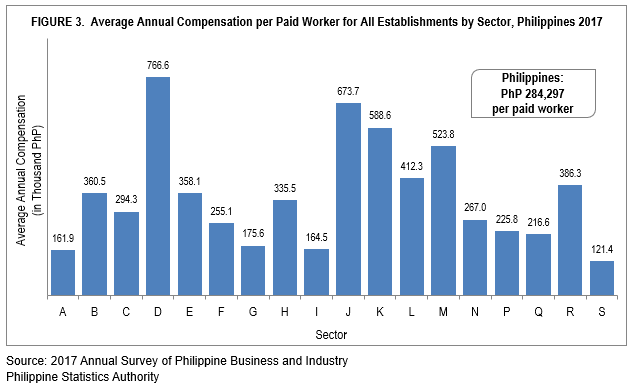
The average annual compensation amounted to PhP284,297 per paid worker in 2017, higher by 7.2 percent than the PhP265,094 average annual compensation in 2016. Electricity, Gas, Steam and Air Conditioning Supply paid the highest average annual compensation of PhP766,582 per worker while Other Service Activities paid the least amount of PhP121,367 per worker. (Table A and 1a, and Figure 3)
Manufacturing emerges as top income earner and Wholesale and Retail Trade; Repair of Motor Vehicles and Motorcycle as top spender
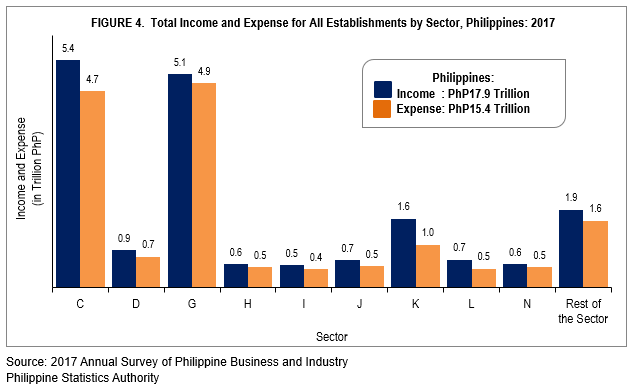
In 2017, total income earned by establishments amounted to PhP17.9 trillion, while total expense was estimated at PhP15.4 trillion, an increase of 11.9 percent and 11.8 percent, respectively, relative to their corresponding values in 2016.
Manufacturing with PhP5.4 trillion (30.2%) income and Wholesale and Retail Trade; Repair of Motor Vehicles and Motorcycles with PhP5.1 trillion (28.4%) income accounted for a combined share of almost 60.0 percent to total income. (Tables A and 1, and Figure 4)
In terms of expense, Wholesale and Retail Trade; Repair of Motor Vehicles and Motorcycle with PhP4.9 trillion (31.7%) and Manufacturing with PhP4.7 trillion (30.5%) comprised more than 60.0 percent of the total expense. (Tables A and 1, and Figure 4)
Other Service Activities, which posted the least compensation, also registered the least income of PhP39.1 billion (0.2%) and the least expense of PhP34.4 billion (0.2%). (Table 1)
Manufacturing and Financial and Insurance Activities reach the trillion pesos mark in value added
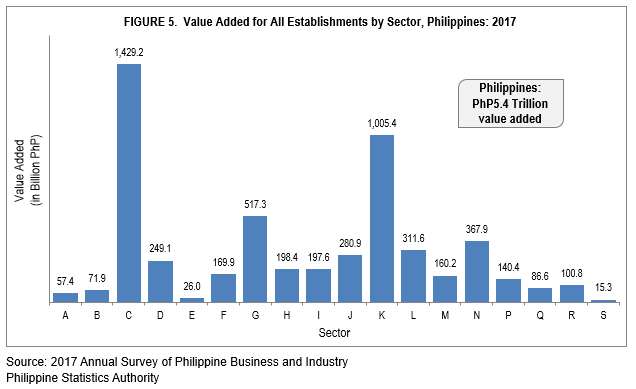
Total value added generated by all establishments reached PhP5.4 trillion in 2017. It expanded by 8.5 percent from PhP5.0 trillion in 2016. (Table A)
Manufacturing with PhP1.4 trillion (26.5%) and Financial and Insurance Activities with PhP1.0 trillion (18.7%) were the only sectors with value added which reached the trillion pesos mark. On the other hand, Other Service Activities contributed the least value added of PhP0.02 trillion (0.3%). (Tables A and 1, Figure 5)
Labor productivity higher by 10.4 percent
Labor productivity, the ratio of value added to total employment, was recorded at PhP872,342 in 2017, higher by 10.4 percent than the PhP790,454 labor productivity reported in 2016. (Tables A and 1a)
Workers in Electricity, Gas, Steam and Air Conditioning Supply remained the most productive in 2017 with labor productivity of PhP5.3 million. On the other hand, workers in Other Service Activities continued to be the least labor productive (PhP218,706). (Table 1a)
Financial and Insurance Activities receives the highest subsidy
Total subsidies received by establishments in 2017 amounted to PhP58.7 billion, higher by 50.6 percent from the PhP39.0 billion total subsidies granted in 2016.
Among all sectors that received subsidies, Financial and Insurance Activities received the highest subsidy of PhP10,591.1 million (18.0%). Professional, Scientific and Technical Activities, on the other hand, received the least subsidy of PhP92.0 million (0.2%). (Table 1)
Manufacturing accounts for the biggest share in e–commerce sales
Sales from e-commerce transactions in 2017 which amounted to PhP137.8 billion, more than tripled (233.9%) from its PHP41.3 billion sales in 2016.
Among sectors with e-commerce sales, Manufacturing reported the highest which amounted to PhP82.6 billion or 60.0 percent of the total. Administrative and Support Service Activities recorded the lowest e-commerce sales of PhP0.04 billion or less than one percent of the total. (Table 1)
(Sgd.) ROSALINDA P. BAUTISTA
Assistant Secretary
Deputy National Statistician
Sectoral Statistics Office
TECHNICAL NOTES
Introduction
This Special Release presents the final economy wide results of the 2017 Annual Survey of Philippine Business and Industry (ASPBI) covering all establishments of the 18 sectors of the economy.
The ASPBI is one of the designated statistical activities of the Philippine Statistics Authority (PSA). Data collected from the survey provides information on the levels, structure, performance and trends of economic activities of the formal sector in the entire country in the year 2017.
The survey was conducted nationwide in 2018 with the year 2017 as the reference period of data, except for employment which is as of 15 November 2017.
The Establishment Data Management System (EDMS) was utilized in the decentralized processing of 2017 ASPBI questionnaires in the province, as well as in the online accomplishment of questionnaire through the PSA website.
Data are presented at the national level by sector based on the 2009 Philippine Standard Industrial Classification (PSIC).
Legal Authority
The conduct of 2017 ASPBI is authorized under Republic Act (RA) 10625 known as the Philippine Statistical Act of 2013 – Reorganizing and Strengthening of the Philippine Statistical System (PSS), its agencies and instrumentalities.
Scope and Coverage
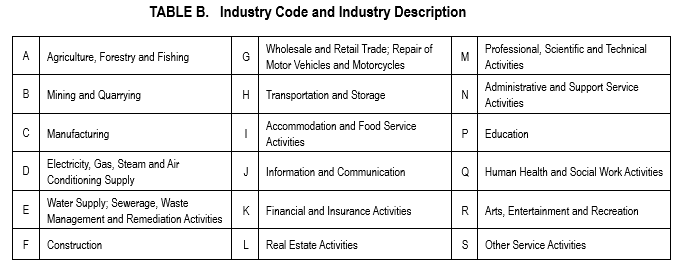
The 2017 ASPBI covered establishments engaged in 18 economic sectors classified under the 2009 PSIC, namely:
• Agriculture, Forestry, and Fishing (A)
• Mining and Quarrying (B)
• Manufacturing (C)
• Electricity, Gas, Steam, and Air Conditioning Supply (D)
• Water Supply; Sewerage, Waste Management and Remediation Activities (E)
• Construction (F)
• Wholesale and Retail Trade; Repair of Motor Vehicles and Motorcycles (G)
• Transportation and Storage (H)
• Accommodation and Food Service Activities (I)
• Information and Communication (J)
• Financial and Insurance Activities (K)
• Real Estate Activities (L)
• Professional, Scientific and Technical Activities (M)
• Administrative and Support Service Activities (N)
• Education (P)
• Human Health and Social Work Activities (Q)
• Arts, Entertainment, and Recreation (R)
• Other Service Activities (S)
However, three (3) sectors of the 2009 PSIC are not covered. These are:
• Public Administration and Defense; Compulsory Social Security (O)
• Activities of Household as Employee. Undifferentiated Goods and Services Producing Activities of Household for Own Use (T)
• Activities of Extraterritorial Organizational Bodies (U)
The survey was confined to the formal sector of the economy, which consists of the following:
• Corporations and partnership
• Cooperatives and foundations
• Single proprietorship with employment of 10 and over
• Single proprietorships with branches
Thus, the 2017 ASPBI covered only the following economic units:
• All establishments with total employment (TE) of 10 and over, and
• All establishments with TE of less than 10, except those establishments with Legal Organization = 1 (single proprietorship) and Economic Organization = 1 (single establishment), that are engaged in economic activities classified according to the 2009 PSIC.
Frame of Establishments
The frame for the 2017 ASPBI was extracted from the 2017 List of Establishments (LE). The estimated number of establishments in operation in the country in 2017 totaled to 917,582. About 228,112 (24.9%) establishments comprised the frame or are within the scope and coverage of the 2017 ASPBI.
Unit of Enumeration
The unit of enumeration for the 2017 ASPBI is the establishment. An establishment is defined in the United Nations International Recommendations on Industrial Statistics as an economic unit, under a single ownership or control, i.e. under a single legal entity, which engages in one or predominantly one kind of economic activity at a single fixed physical location.
Classification of Establishments
An establishment is categorized by its economic organization, legal organization, industrial classification, employment size, and geographic location.
Economic Organization relates to the organizational structure or role of the establishment in the organization. An establishment may be single establishment, branch, establishment and main office with branches elsewhere, main office only, and ancillary unit other than main office.
Legal Organization refers to the legal form of the economic entity that owns the establishment. This provides the legal basis for ownership. An establishment may be single proprietorship, partnership, government corporation, stock corporation, non-stock corporation, and cooperative.
Industrial classification of an economic unit was determined by the activity from which it derives its major income or revenue. The 2009 PSIC was utilized to classify economic units according to their economic activities.
Size of an establishment is determined by its TE as of a specific date. TE refers to the total number of persons who work in or for the establishment.
Geographic Classification refers to the classification of establishments by geographic area using the Philippine Standard Geographic Code (PSGC) classification.
Methodology
Sampling Design
The 2017 ASPBI utilized stratified systematic sampling with 5-digit PSIC serving as the industry strata and employment size as the second stratification variable.
For establishments with TE of 20 and over, the 17 administrative regions serve as the geographic domains while the 5-digit level (sub-class) of the 2009 PSIC serves as the industry domain.
Estimation Procedure
For Establishments with TE of 20 and Over
a. Non-Certainty Stratum (strata of TE 20 to 49 and TE 50 to 99)
The estimate of the total of a characteristic (![]() ) for the non-certainty employment strata in an industry domain in each region,
) for the non-certainty employment strata in an industry domain in each region,

where:
s = denotes the non-certainty employment strata in TE of 20 to 99
p = 1, 2...17 regions (geographic domains)
xspj = value of the jth establishment in the non-certainty employment strata in TE of 20 to 99 for an industry domain in each region
j = 1, 2, 3…nsp establishments
Wspj = weight of the jth establishment in the non-certainty employment strata in TE of 20 to 99 for an industry domain in each region
Nsp = total number of establishments in the non-certainty employment strata in TE of 20 to 99 for an industry domain in each region
nsp = number of sample establishments in the non-certainty employment strata in TE of 20 to 99for an industry domain in each region
b. Certainty Stratum (TE 100 and over)
The value of the total of a characteristic (![]() ) for the certainty employment stratum in an industry domain in each region,
) for the certainty employment stratum in an industry domain in each region,
where:
c = denotes the certainty employment strata in TE 100 and over
p = 1, 2...17 regions (geographic domains)
xcpj = value of the jth establishment in the certainty employment strata in TE 100 and over in an industry domain within each region
j = 1, 2, 3…mcp establishments
mcp = number of establishments in the certainty employment strata in TE 100 and over in an industry domain within each region
c. Total Estimate for TE of 20 and Over
The estimate of the total of a characteristic (![]() ) for the industry domain in each region (geographic domain) was obtained by aggregating the estimates for all employment strata (non-
) for the industry domain in each region (geographic domain) was obtained by aggregating the estimates for all employment strata (non-
certainty and certainty) in the same industry domain,
Where dp denotes the industry domains in each region.
National level estimates of the characteristics by industry domain were obtained by aggregating separately the estimates (![]() ) for the particular industry domain from all the regions.
) for the particular industry domain from all the regions.
For Establishments with TE of Less Than 20
Non-Certainty Stratum
The estimate of the total of a characteristic (![]() ) for the non-certainty employment stratum TE less than 20 in the sth industry domain was
) for the non-certainty employment stratum TE less than 20 in the sth industry domain was
where:
s = denotes the non-certainty employment strata in TE of less than 20
Xsj = value of the jth establishment in non-certainty employment stratum in TE of less than 20 in Sth industry domain
j = 1, 2, 3...ns establishments
Wsj = weight of the jth establishment in the non-certainty employment stratum of less than 20 in the sth industry domain
Ns = total number of establishments in the non-certainty employment stratum in TE of less than 20 in the sth industry domain
ns = number of sample establishments in the non-certainty employment stratum in TE of less than 20 in sth domain
Weight Adjustment Factor for Non-Response
To account for non-response in the non-certainty strata, the adjustment factor (n/n’) was multiplied with the sampling weight (W) of each of the sampling unit. The sampling weight, defined as N/n, was recomputed as
Thus, the adjusted weight (W’sj) for employment stratum in TE 1-9 or TE 10-19 was
where:
Ns = total number of establisments in the employment stratum in TE 1-9 or TE 10-19 in the sth industry domain
n's = number of responding establishments in the employment stratum in TE 1-9 or TE 10-19 in the sth industry domain
For the non-certainty employment stratum for the selected industry domain with TE 20-99, the adjusted weight (W'spj) was
where:
Nsp = total number of establishments in the non-certainty employment stratum with TE 20-99 for the selected industry domain within each geographic domain (region)
n'sp = number of responding establishments in the non-certainty employment stratum with TE 20-99 for the selected industry domain within each geographic domain (region)
Survey Questionnaire
There were seven types of questionnaires used in the survey which captured data from establishments of the 18 sectors of the economy as defined in the 2009 PSIC. A clearance number and expiry date were shown at the upper right hand corner of the cover page of the questionnaire. An address stub which contained the business name and complete address of the sample establishment was pasted in every questionnaire to guide the field staff on where to deliver the questionnaire. The questionnaire was administered to the sample establishment or to its reporting unit.
A web-based version of the 2017 ASPBI questionnaires was available for accomplishment by sample establishment online at the PSA website, https://aspbi.psa.gov.ph.
Response Rate
The response rate for all establishments was 88.8 percent (26,395 out of 29,720 establishments). This included receipts of "good" questionnaires, partially accomplished questionnaires, and reports of closed, moved out and out of scope establishments.
Of the total responses, 899 establishments responded online.
Reports of non-reporting establishments were imputed based on established imputation methods and from other available administrative data sources like financial statements from Securities and Exchange Commission (SEC). However, reports of establishments in the certainty stratum, which were found to be duplicate of another establishment and out of business in 2017 were not imputed.
The table below shows the response rate by sector and the number of establishments which responded online.
2017 ASPBI Response Rates for All Establishments by Sector
| 2009 PSIC | Industry | Number of Samples | Number of Responding Establishments | Response Rate (%) | Number of Establishments Responded Online |
| Philippines | 29,720 | 26,395 | 88.8 | 899 | |
| A | Agriculture, Forestry and Fishing | 1,171 | 1,054 | 90.0 | 24 |
| B | Mining and Quarrying | 280 | 242 | 86.4 | 3 |
| C | Manufacturing | 5,011 | 4,385 | 87.5 | 168 |
| D | Electricity, Gas, Steam and Air-Conditioning Supply | 373 | 299 | 80.2 | 35 |
| E | Water Supply; Sewerage, Waste Management and Remediation Activities | 656 | 601 | 91.6 | 47 |
| F | Construction | 833 | 792 | 95.1 | 23 |
| G | Wholesale and Retail Trade; Repair of Motor Vehicles and Motorcycles | 7,092 | 6,286 | 88.6 | 217 |
| H | Transportation and Storage | 988 | 905 | 91.6 | 26 |
| I | Accommodation and Food Service Activities | 1,473 | 1,290 | 87.6 | 25 |
| J | Information and Communication | 3,896 | 3,528 | 90.6 | 85 |
| K | Financial and Insurance Activities | 1,122 | 1,104 | 98.4 | 53 |
| L | Real Estates Activities | 352 | 271 | 77.0 | 19 |
| M | Professional, Scientific and Technical Activities | 770 | 635 | 82.5 | 19 |
| N | Administrative and Support Service Activities | 2,386 | 2,048 | 85.8 | 46 |
| P | Education | 1,344 | 1,216 | 90.5 | 54 |
| Q | Human Health and Social Work Activities | 847 | 723 | 85.4 | 31 |
| R | Arts, Entertainment and Recreation | 387 | 340 | 87.9 | 9 |
| S | Other Service Activities | 739 | 676 | 91.5 | 15 |
Limitation of Data
The 2017 ASPBI covered only the formal sector of the economy.
Concepts and Definitions of Terms
Change in inventories is equivalent to the value of inventories at the end of the year less the value of inventories at the beginning of the year.
Compensation is the sum of salaries and wages, separation/retirement/terminal pay, gratuities, and payments made by the employer in behalf of the employees such as contribution to SSS/GSIS, ECC, PhilHealth, Pag-ibig, etc.
Cost refers to all expenses incurred during the year whether paid or payable. Valuation is at purchaser prices including taxes and other charges, net of rebates, returns and allowances. Goods and services received by the establishment from other establishments of the same enterprise are valued as though purchased.
E-commerce refers to the selling of products or services over electronic systems such as Internet Protocol-based networks and other computer networks. Electronic Data Interchange (EDI) network, or other on-line system. Excluded are orders received from telephone, facsimile and e-mails.
Economic activity is the establishment’s source of income. If the establishment is engaged in several activities, its main economic activity is that which earns the biggest income or revenue.
Gross addition to tangible fixed assets is equal to capital expenditures less sale of fixed assets, including land.
Income or Revenue refers to cash received and receivables for goods/products and by-products sold and services rendered.
Intermediate expense (for industrial sectors A, B, C, D, E and F) are expenditures incurred in the production of goods such as materials and supplies purchased, fuels purchased, electricity and water purchased, and industrial services done by others plus beginning inventory of materials, supplies and fuels less ending inventory of materials, supplies and fuels.
Inventories refer to the stock of goods owned by and under the control of the establishment as of a fixed date, regardless of where the stocks are located. Valuation is at current replacement cost in purchaser prices. Replacement cost is the cost of an item in terms of its present price rather than its original cost.
Paid employees are all persons working in the establishment and receiving pay, as well as those working away from the establishment paid by and under the control of the establishment. Included are all employees on sick leave, paid vacation or holiday. Excluded are consultants, home workers, receiving pure commissions only, and workers on indefinite leave.
Salaries and wages are payments in cash or in kind to all employees, prior to deductions for employee’s contributions to SSS/GSIS, withholding tax, etc. Included are total basic pay, overtime pay and other benefits.
Subsidies are all special grants in the form of financial assistance or tax exemption or tax privilege given by the government to aid and develop an industry.
Total employment is the number of persons who worked in for the establishment as of 15 November 2017.
Value added is gross output less intermediate input. Gross output is value of output plus income from non-industrial services done for others (except rent income from land). Intermediate input is intermediate expense plus expense for non-industrial services done by others (except rent expense for land) and other costs.
Value of output (for industrial sectors A, B, D, E and F) represents the sum of the receipts from products and by-products sold, income from industrial services done for others, and goods sold in the same condition as purchased less the cost of goods sold; and value of fixed assets produced on own account, and change in inventories of finished products and work-in-progress.