

Construction of buildings industry leads the sector in terms of number of establishments
The final results of the Annual Survey of Philippine Business and Industry (ASPBI) showed that a total of 1,726 establishments in the formal sector of the economy were engaged in Construction in 2017. This represents a decrease of 8.0 percent compared with the 1,877 number of establishments in 2016. (Table A)
Among industries, construction of buildings recorded the highest share of 41.1 percent to the total number of establishments for the sector. (Figure 1)

Construction of buildings industry employs the highest number of workers
The sector employed a total of 311,012 workers, a decrease of 5.0 percent from the 327,279 workers recorded in 2016. (Table A)
By industry group, construction of buildings employed the highest number of workers with 129,463 or 41.6 percent of the total employment. Construction of roads and railways followed with 94,566 (30.4%) workers. (Figure 2)
The average number of workers per establishment for the sector was recorded at 180 in 2017. Construction of roads and railways recorded the highest average of 260 workers per establishment. On the other hand, other specialized construction activities recorded the lowest average of 71 workers per establishment. (Table 1a)

Demolition and site preparation industry pays the highest average annual compensation
The total compensation paid to employees of the sector amounted to PhP79.2 billion, which translates to an average annual compensation of PhP255,093 per paid worker. Compared with the average annual pay of PhP221,507 per paid worker in 2016, the average pay in 2017 increased by 15.2 percent. (Table A)
Among industries, demolition and site preparation paid the highest average annual compensation of PhP298,741 per paid worker. Conversely, electrical plumbing and other construction installation activities paid the lowest average annual compensation of PhP211,682 per paid worker. (Figure 3)

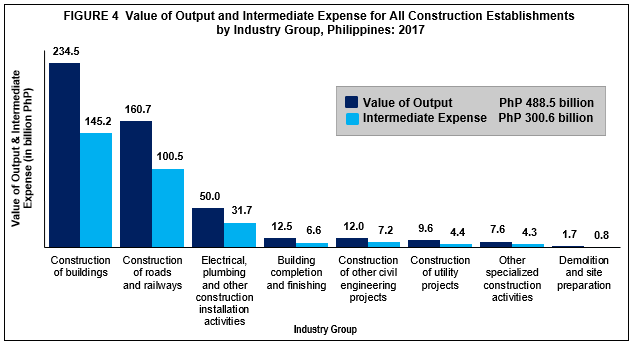
Construction of buildings industry generates the highest value of output and intermediate expense
The total value of output generated by the sector amounted to PhP488.5 billion, an increase of 11.8 percent from the PhP436.8 billion value of output recorded in 2016. On the other hand, the total intermediate expense incurred by the sector was recorded at PhP300.6 billion, higher by 15.2 percent than the PhP261.0 billion total intermediate expense recorded in 2016. (Table A)
At the industry level, construction of buildings contributed the biggest share to total value of output and total intermediate expense which amounted to PhP234.5 billion (48.0%) and PhP145.2 billion (48.3%), respectively. On the contrary, demolition and site preparation had the least contribution of PhP1.7 billion (0.3%) to total value of output, and PhP0.8 billion (0.3%) to total intermediate expense. (Figure 4)
Construction of buildings industry records the highest return
Income per peso expense for the sector was recorded at 1.11, lower than the 1.12 ratio in 2016. This implies that for every peso spent in 2017, an income of PhP1.11 was generated. Among industry groups, construction of buildings recorded the highest income per peso expense of 1.14. (Table A and 1a)
Construction of buildings industry is the highest contributor to value added
The total value added generated by the sector reached PhP169.9 billion in 2017. This represents an increase of 5.4 percent from the PhP161.2 billion value added posted in 2016. Construction of buildings with PhP79.0 billion (46.5%) contributed the biggest share to total value added. (Table A and 1)
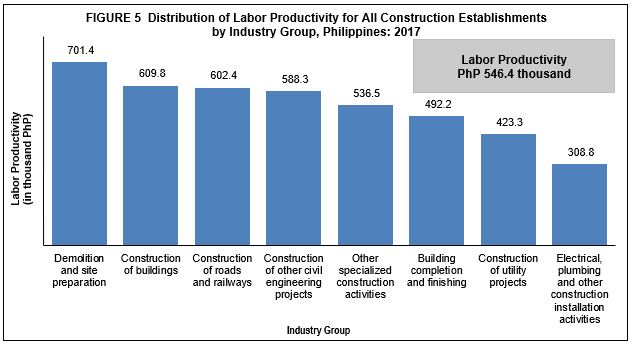
Demolition and site preparation industry records the highest labor productivity
Labor productivity, defined as the ratio of value added to total employment, reached PhP546,379 per worker for the Construction sector. This represents an increase of 10.9 percent from the labor productivity of PhP492,542 per worker in 2016. (Table A)
Among industries, demolition and site preparation led the sector with labor productivity of PhP701,354 per worker. On the other hand, electrical, plumbing and other construction installation activities reported the lowest labor productivity of PhP308,834 per worker. (Figure 5)
Construction of roads and railways industry contributes the most to gross addition to tangible fixed assets
Gross additions to tangible fixed assets (capital expenditures less sale of fixed assets) acquired by the sector was valued at PhP12.2 billion in 2017. This amount was higher by 58.6 percent from the PhP7.7 billion gross addition to tangible fixed assets in 2016. (Table A)
Construction of roads and railways leads the sector, with PhP5.0 billion or 41.3 percent of the total gross addition to tangible fixed assets. (Table 1)
(Sgd.) ROSALINDA P. BAUTISTA
Assistant Secretary
Deputy National Statistician
Sectoral Statistics Office
TECHNICAL NOTES
Introduction
This Special Release presents the final results of the 2017 Annual Survey of Philippine Business and Industry (ASPBI) for all Construction (Sector F) establishments.
The 2017 ASPBI is one of the designated statistical activities of the Philippine Statistics Authority (PSA). Data collected from the survey provide information on the levels, structure, performance, and trends of economic activities of the formal sector in the entire country for the year 2017.
The survey was conducted nationwide in 2018 with the year 2017 as the reference period of data, except for employment which is as of 15 November 2017.
Establishment Data Management System (EDMS) was utilized in the decentralized processing of the ASPBI questionnaires in the provinces as well as the online accomplishment of questionnaire through the PSA website.
Data are presented by industry group or 3-digit level of the 2009 Philippine Standard Industrial Classification (PSIC) at the national level.
Introduction
The conduct of the 2017 ASPBI is authorized under Republic Act 10625 known as the Philippine Statistical Act of 2013 - which mandates reorganizing and strengthening of the Philippine Statistical System (PSS), its agencies and instrumentalities.
Scope and Coverage
The 2017 ASPBI covered establishments engaged in 18 economic sectors classified under the 2009 PSIC, namely:
• Agriculture, Forestry and Fishing (A)
• Mining and Quarrying (B)
• Manufacturing (C)
• Electricity, Gas, Steam, and Air Conditioning Supply (D)
• Water Supply; Sewerage, Waste Management and Remediation Activities (E)
• Construction (F)
• Wholesale and Retail Trade; Repair and Maintenance of Motor Vehicles, Motorcycles (G)
• Transportation and Storage (H)
• Accommodation and Food Service Activities (I)
• Information and Communication (J)
• Financial and Insurance Activities (K)
• Real Estate Activities (L)
• Professional, Scientific and Technical Activities (M)
• Administrative and Support Service Activities (N)
• Education (P)
• Human Health and Social Activities (Q)
• Arts, Entertainment and Recreation (R)
• Other Service Activities (S)
However, three (3) sectors of the 2009 PSIC are not covered. These are:
• Public Administration and Defense; Compulsory Social Security (O)
• Activities of Household as Employee. Undifferentiated Goods and Services Producing Activities of Household for Own Use (T)
• Activities of Extraterritorial Organizational Bodies (U)
The survey was confined to the formal sector of the economy, which consists of the following:
• Corporations and partnership
• Cooperatives and foundations
• Single proprietorship with employment of 10 and over
• Single proprietorships with branches
Hence, the 2017 ASPBI covered only the following economic units:
• All establishments with total employment (TE) of 10 and over, and;
• All establishments with TE of less than 10, except those establishments with Legal Organization = 1 (single proprietorship) and Economic Organization = 1 (single establishment), that are engaged in economic activities classified according to the 2009 PSIC.
Frame of Establishments
The frame for the 2017 ASPBI was extracted from the 2017 List of Establishments (LE). The estimated number of establishments in operation in the country in 2017 totaled to 917,582. About 228,112 (24.9%) establishments comprised the establishment frame or are within the scope and coverage of the 2017 ASPBI.
Unit of Enumeration
The unit of enumeration for the 2017 ASPBI is the establishment. An establishment is defined as an economic unit under a single ownership or control which engages in one or predominantly one kind of activity at a single fixed location.
Classification of Establishments
An establishment is categorized by its economic organization, legal organization, industrial classification, employment size, and geographic location.
Economic Organization refers to the organizational structure or role of the establishment in the organization. An establishment may be single establishment, branch, establishment and main office with branches elsewhere, main office only, and ancillary unit other than main office.
Legal Organization refers to the legal form of the economic entity which owns the establishment. An establishment may be single proprietorship, partnership, government corporation, stock corporation, non-stock corporation, and cooperative.
Industrial classification of an economic unit was determined by the activity from which it derives its major income or revenue. The 2009 PSIC was utilized to classify economic units according to their economic activities.
Size of an establishment is determined by its TE as of specific date.
Geographic Classification. Establishments are also classified by geographic area using the Philippine Standard Geographic Code (PSGC) classification.
Sampling Design
The 2017 ASPBI used stratified systematic sampling with 5-digit PSIC serving as first stratification variable and employment size as the second stratification variable.
Estimation Procedure
a. Non-Certainty Stratum (strata of TE 20 to 49 and TE 50 to 99)
The estimate of the total of a characteristic ![]() for the non-certainty employment strata in an industry domain in each region,
for the non-certainty employment strata in an industry domain in each region,
where:
s = denotes the non-certainty employment strata in TE of 20 to 99
p = 1, 2...17 regions (geographic domains)
Xspj = value of the jth establishment in the non-certainty employment strata in TE of 20 to 99 for an industry domain in each region
j = 1, 2, 3...nsp establishments
Wspj = weight of the jth establishment in non-certainty employment strata in TE of 20 to 99 for an industry domain in each region
Nsp = total number of establishments in the non-certainty employment strata in TE of 20 to 99 for an industry domain in each region
nsp = number of sample establishments in the non-certainty employment strata in TE of 20 to 99 for an industry domain in each region
b. Certainty Stratum (TE 100 and over)
The value of the total of a characteristic (Xcp) for the certainty employment stratum in an industry domain in each region,

where:
c = denotes the certainty employment strata in TE 100 and over
p = 1, 2...17 regions (geographic domains)
Xcpj = value of the jth establishment in the certainty employment strata in TE 100 and over for an industry domain within each region
j = 1, 2, 3...mcp establishments
mcp = number of establishments in the certainty employment strata in TE 100 and over in an industry domain within each region
c. Total Estimate for TE of 20 and Over
The estimate of the total of a characteristic ![]() for the industry domain in each region (geographic domain) was obtained by aggregating the estimated for all employment strata (non-certainty and certainty) in the same industry domain,
for the industry domain in each region (geographic domain) was obtained by aggregating the estimated for all employment strata (non-certainty and certainty) in the same industry domain,
where dp denotes the industry domains in each region.
National level estimate of the characteristic by industry domain were obtained by aggregating separately the estimates ![]() for the particular industry domain from all the regions.
for the particular industry domain from all the regions.
For Establishments with TE of Less Than 20
a. Non-Certainty Stratum
The estimate of the total of a characteristic ( ![]() ) for the non-certainty employment stratum TE less than 20 in the sth industry domain was
) for the non-certainty employment stratum TE less than 20 in the sth industry domain was

where:
s = denotes the non-certainty employment strata in TE of less than 20
Xsj = value of the jth establishment in non-certainty employment stratum in TE of less than 20 in Sth industry domain
j = 1, 2, 3..., ns establishments
Wsj = weight of the jth establishment in the non-certainty employment stratum of less than 20 in the sth industry domain

Ns = total number of establishments in the non-certainty employment stratum in TE of less than 20 in the sth industry domain
ns = number of sample establishments in the non-certainty employment stratum in TE of less than 20 in sth domain
Weight Adjustment Factor for Non-Response
To account for non-response in the non-certainty strata, the adjustment factors, and (n/n') was multiplied with the sampling weight (W) of each of the sampling unit. The sampling weight which is defined as N/n was recomputed as

Thus, the adjusted weight (W'spj) for the non-certainty employment stratum for the industry domain with TE 20-99 was
Where:
Nsp = total number of establishments in the non-certainty employment stratum with TE 20-99 for the industry domain within each geographic domain (region)
n'sp = number of responding establishments in the non-certainty employment stratum with TE of 20-99 for the industry domain within each geographic domain (region)
Response Rate
Response rate for Construction Sector was 95.1 percent (792 out of 833 establishments). This included receipts of "good" questionnaires, partially accomplished questionnaires, reports of closed, moved out or out of scope establishments.
Of the total responses, 23 establishments responded online.
Reports of the non-reporting establishments were sourced from the financial statements available at the Securities and Exchange Commission (SEC) website and from other available administrative data sources. Reports of establishments which were found to be duplicate of another establishment, out-of-scope and out of business in 2017 were not included in the generation of statistical tables.
Limitation of Data
The survey covered only the formal sector of the economy.
Concepts and Definitions of Terms
Change in inventories is equivalent to the value of inventories at the end of the year less the value of inventories at the beginning of the year.
Compensation is the sum of salaries and wages, separation/retirement/terminal pay, gratuities, and payments made by the employer in behalf of the employees such as contribution to SSS/GSIS, ECC, PhilHealth, Pag-ibig, etc.
Cost refers to all expenses incurred during the year whether paid or payable. Valuation is at purchaser prices including taxes and other charges, net of rebates, returns and allowances. Goods and services received by the establishment from other establishments of the same enterprise are valued as though purchased.
E-commerce refers to the selling of products or services over electronic systems such as Internet Protocol-based networks and other computer networks. Electronic Data Interchange (EDI) network, or other on-line system. Excluded are orders received from telephone, facsimile and e-mails.
Economic activity is the establishment’s source of income. If the establishment is engaged in several activities, its main economic activity is that which earns the biggest income or revenue.
Establishment is defined as an economic unit under a single ownership or control which engages in one or predominantly one kind of activity at a single fixed location.
Expense refers to cost incurred by the establishment during the year whether paid or payable. This is treated on a consumed basis.
Gross addition to tangible fixed assets is equal to capital expenditures less sale of fixed assets, including land.
Income or Revenue refers to cash received and receivables for goods/products and by-products sold and services rendered.
Intermediate expense are expenditures incurred for construction activity such as construction materials and supplies purchased, fuels, lubricants, oils and greases purchased, electricity and water purchased, and contract and commission work done by others plus beginning inventory of construction materials, supplies, fuels, lubricants, oils and greases less ending inventory of materials, supplies, fuels, lubricants, oils and greases.
Inventories refer to the stock of goods owned by and under the control of the establishment as of a fixed date, regardless of where the stocks are located. Valuation is at current replacement cost in purchaser prices. Replacement cost is the cost of an item in terms of its present price rather than its original cost.
Paid workers are all persons working in the establishment and receiving pay, as well as those working away from the establishment paid by and under the control of the establishment. Included are all employees on sick leave, paid vacation or holiday. Excluded are consultants, home workers, receiving pure commissions only, and workers on indefinite leave.
Salaries and wages are payments in cash or in kind to all employees, prior to deductions for employee’s contributions to SSS/GSIS, withholding tax, etc. Included are total basic pay, overtime pay and other benefits.
Subsidies refer to special grants in the form of financial assistance or tax exemption or tax privilege received from the government to aid and develop an industry.
Total employment is the number of persons who worked in for the establishment as of 15 November 2017.
Value added is gross output less intermediate cost. Gross output for construction sector is value of output plus income from non-industrial services done for others (except rent income from land). Intermediate cost is intermediate expense plus expense for non-industrial services done by others (except rent expense for land) and other expenses.
Value of output represents the sum of the receipts from domestic construction activities, net income earned from construction abroad, contract and commission work done for others, income from products manufactured and sold less cost of products sold, and goods sold in the same condition as purchased less the cost of goods sold; and value of tangible fixed assets produced on own account and change in inventories of finished products and work-in-progress.