
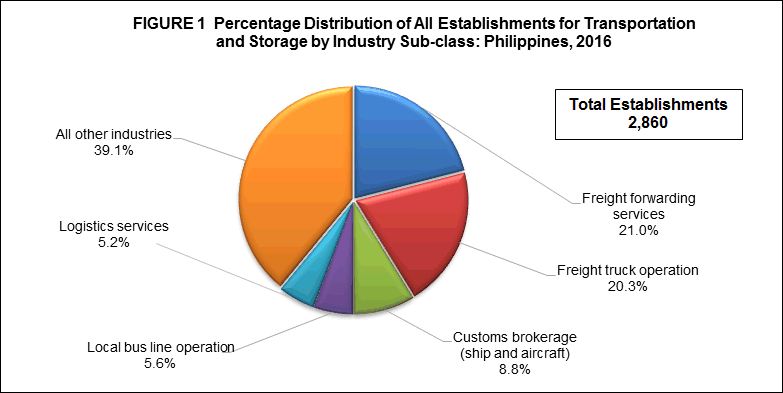
Freight forwarding services industry leads the sector in terms of number of establishments
The final results of the 2016 Annual Survey of Philippine Business and Industry (ASPBI) recorded a total of 2,860 establishments in the formal sector of the economy that were engaged in transportation and storage activities.
Among industries, freight forwarding services had the highest number of establishments with 600 or 21.0 percent of the total establishments for the sector. Freight truck operation followed closely with 580 establishments or 20.3 percent. Customs brokerage (ship and aircraft) ranked third with 251 establishments or 8.8 percent.
Figure 1 illustrates the percentage distribution of all establishments for the sector by industry sub-class in 2016.
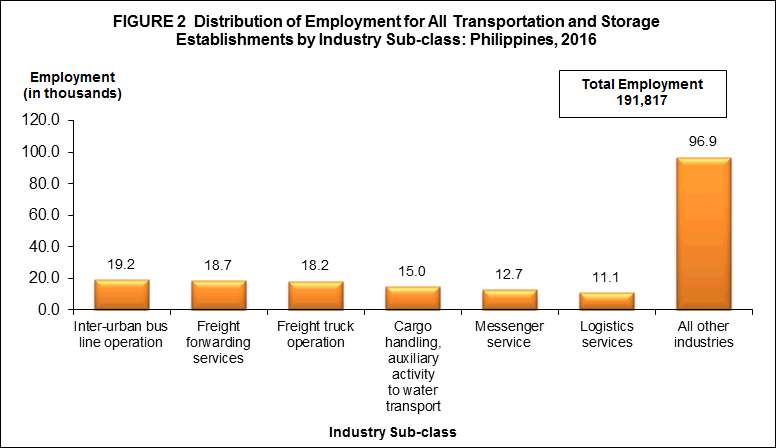
Inter-urban bus line operation industry employs the most number of workers
Total employment generated by the sector was 191,817 workers in 2016. Paid employees constituted 189,220 or 98.6 percent of the total and the remaining were working owners and unpaid workers.
Across industries, inter-urban bus line operation hired the most number of workers with 19,224 or 10.0 percent of the total employment. Freight forwarding services and freight truck operation followed closely with 18,707 (9.8%) and 18,193 workers (9.5%), respectively.
The distribution of employment of all establishments for the sector by industry sub-class in 2016 is shown in Figure 2.
The reported average workers per establishment for the sector was 67. Of the 49 industry sub-classes, 17 exceeded the national average. The top five industries in terms of average workers per establishment, were as follows:
- International air passenger transport, 1,494 workers per establishment
- Combined industries of postal activities and private postal service, 1,348 workers per establishment
- Combined industries of inter-urban passenger railway transport and urban and suburban railway transport, 1,104 workers per establishment
- Inter-urban bus line operation, 320 workers per establishment
- Containerized cargo handling, auxiliary activity to land transport, 239 workers per establishment
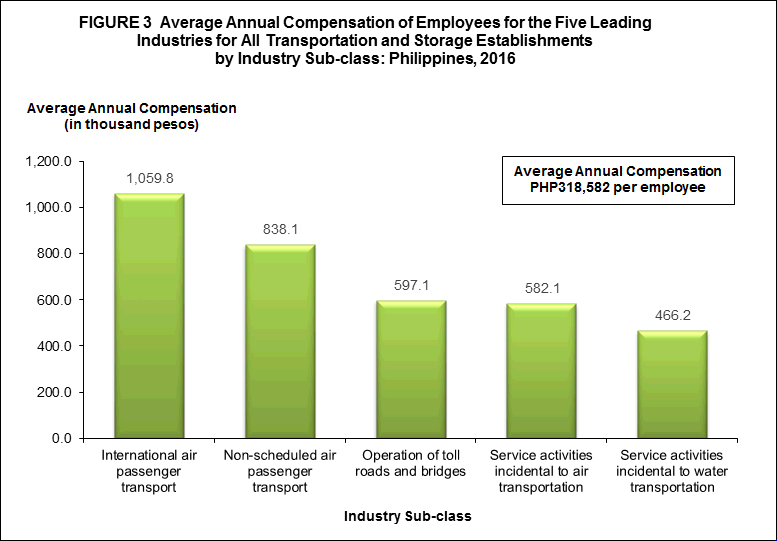
International air passenger transport industry pays the highest average annual compensation
The sector paid a total compensation of PHP60.3 billion in 2016, translating to an average annual compensation of PHP318,582 per employee.
By industry sub-class, international air passenger transport paid the highest compensation of PHP11.1 billion or 18.4 percent of the total compensation for the sector. Freight forwarding services placed second with PHP5.6 billion or 9.3 percent, followed by cargo handling, auxiliary activity to water transport with PHP4.6 billion or 7.6 percent.
Establishments belonging to international air passenger transport paid the highest average annual compensation to its employees at PHP1.1 million per employee. This was followed by non-scheduled air passenger transport, paying an average annual compensation of PHP838.1 thousand per employee. Operation of toll roads and bridges occupied the third post, providing an average annual compensation of PHP597.1 thousand per employee.
Presented in Figure 3 is the average annual compensation per employee for the five leading industries for all establishments of the sector by industry sub-class in 2016.
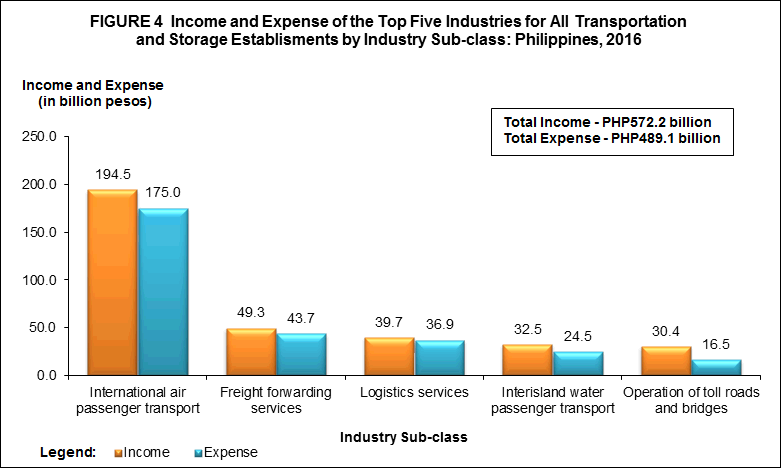
International air passenger transport industry contributes the major share in income and expense
Gross income generated by the sector reached PHP572.2 billion in 2016. International air passenger transport had the highest share which amounted to PHP194.5 billion or 34.0 percent of the total income. Freight forwarding services and logistics services ranked second and third with an income of PHP49.3 billion (8.6%) and PHP39.7 billion (6.9%), respectively.
On the other hand, total expense incurred by the sector amounted to PHP489.1 billion in 2016. Being the major contributor in income, international air passenger transport also had the highest share in expense amounting to PHP175.0 billion (35.8%). Freight forwarding services and logistics services also ranked second and third with corresponding expenses of PHP43.7 billion (8.9%) and PHP36.9 billion (7.5%), respectively.
Figure 4 shows the five leading industries in terms of income and expense for all establishments of the sector by industry sub-class in 2016.
Income per peso expense registers at 1.17
In 2016, the income per peso expense generated by the sector stood at 1.17. This means that for every peso spent, a corresponding income of PHP1.17 was generated.
Of the 49 industry sub-classes, 14 exceeded the national average income per peso expense ratio. Renting of ship with operator posted an income per peso expense ratio of 1.86, the highest among industries.
International air passenger transport industry posts the highest value added
Total value added generated by the sector was estimated at PHP201.6 billion in 2016. International air passenger transport posted the highest value added of PHP45.4 billion or 22.5 percent of the total.
Other industries which recorded more than five percent share in terms of value added were the following:
- Operation of toll roads and bridges with PHP17.5 billion (8.7%)
- Cargo handling auxiliary activity to water transport with PHP15.3 billion (7.6%)
- Containerized cargo handling, auxiliary activity to land transport with PHP13.7 billion (6.8%)
- Interisland water passenger transport with PHP13.5 billion (6.7%)
- Freight forwarding services with PHP12.6 billion (6.3%)
- Service activities incidental to water transportation with PHP12.4 billion (6.1%)
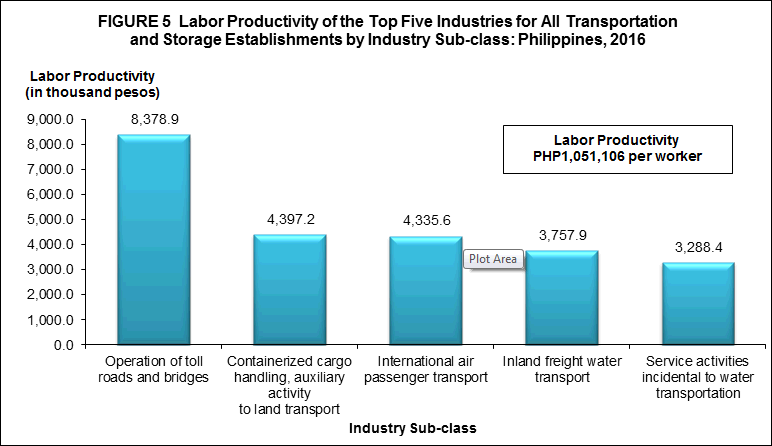
Labor Productivity stands at PHP1.1 million per worker
Value added per employment, a measure of labor productivity, was estimated at PHP1.1 million per worker in 2016. Operation of toll roads and bridges led the sector with PHP8.4 million per worker. Containerized cargo handling, auxiliary activity to land transport ranked second with PHP4.4 million per worker, followed by international air passenger transport with PHP4.3 million per worker.
Figure 5 presents the top five industries in terms of labor productivity for all establishments of the sector by industry sub-class in 2016.
Gross additions to tangible fixed assets sums up to PHP28.5 billion in 2016
Gross additions to tangible fixed assets (capital expenditures less sale of fixed assets) acquired by the sector reached PHP28.5 billion in 2016.
Service activities incidental to water transportation acquired the highest gross additions to fixed assets worth PHP7.2 billion (25.3%). This was followed by interisland water freight transport and tank truck delivery services with gross additions to fixed assets worth PHP4.0 billion (13.9%) and PHP2.8 billion (9.9%), respectively.
Inter-urban bus line operation industry records the highest change in inventories
Change in inventories (ending less beginning inventory) reached a total of PHP74.4 million in 2016.
Inter-urban bus line operation recorded the highest change in inventories amounting to PHP191.7 million. Other industries with change in inventories of more than PHP50.0 million were as follows:
- International air passenger transport, PHP147.5 million
- Freight truck operation, PHP85.1 million
- Logistics services, PHP57.3 million
- Service activities incidental to water transportation, PHP51.7 million
Government grants PHP9.5 billion worth of subsidy
Subsidies are special grants in the form of financial assistance or tax exemption privilege given by the government to aid and develop an industry. The total subsidies granted to the sector reached PHP9.5 billion. Combined industries of inter-urban passenger railway transport and urban and suburban railway transport received PHP9.5 billion or 95.8 percent of the total subsidy granted for the sector.
The other industries that received subsidies in 2016 were the following:
- Combined industries of postal activities and private postal service, PHP301.0 million (3.2%)
- Service activities incidental to air transportation, PHP69.6 million (0.7%)
- Service activities incidental to water transportation, PHP27.8 million (0.3%)
- Cold storage, PHP0.9 million (0.01%)
- Cargo handling, auxiliary activity to water transport, PHP0.2 million (0.002%)
Sales from e-commerce reaches PHP28.7 billion
In 2016, sales from e-commerce reached PHP28.7 billion or 5.0 percent of the total income for the sector. Majority or 97.1 percent of the total sales from e-commerce was contributed by international air passenger transport which amounted to PHP27.9 billion.
Meanwhile, freight forwarding services reported an e-commerce sales of PHP19.8 million for the year in review.
TECHNICAL NOTES
Introduction
This Special Release presents the final results of the 2016 Annual Survey of Philippine Business and Industry (ASPBI) for all Transportation and Storage establishments (sector H).
The ASPBI is one of the designated statistical activities of the Philippine Statistics Authority (PSA). Data collected from the survey provide information on the levels, structure, performance, and trends of economic activities of the formal sector in the entire country for the year 2016.
The survey was conducted nationwide in 2017 with 2016 as the reference period, except for employment data which is 15 November 2016.
Establishment Data Management System (EDMS) was utilized in the decentralized processing of survey questionnaires in the provinces as well as the online accomplishment of questionnaire through the PSA website.
Data are presented by industry sub-class or 5-digit 2009 Philippine Standard Industrial Classification (PSIC) at the national level.
Legal Authority
The conduct of the 2016 ASPBI is authorized under Republic Act 10625 known as the Philippine Statistical Act of 2013, which mandates reorganizing and strengthening of the Philippine Statistical System (PSS), its agencies and instrumentalities.
Scope and Coverage
The 2016 ASPBI covered establishments engaged in 18 economic sectors classified under the 2009 PSIC, namely:
- Agriculture, Forestry and Fishing (A)
- Mining and Quarrying (B)
- Manufacturing (C)
- Electricity, Gas, Steam, and Air Conditioning Supply (D)
- Water Supply; Sewerage, Waste Management and Remediation Activities (E)
- Construction (F)
- Wholesale and Retail Trade; Repair of Motor Vehicles and Motorcycles (G)
- Transportation and Storage (H)
- Accommodation and Food Service Activities (I)
- Information and Communication (J)
- Financial and Insurance Activities (K)
- Real Estate Activities (L)
- Professional, Scientific and Technical Activities (M)
- Administrative and Support Service Activities (N)
- Education (P)
- Human Health and Social Work Activities (Q)
- Arts, Entertainment and Recreation (R)
- Other Service Activities (S)
The survey was confined to the formal sector of the economy, which consists of the following:
- Corporations and partnerships
- Cooperatives and foundations
- Single proprietorship with employment of 10 and over
- Single proprietorship with branches
Hence, the 2016 ASPBI covered only the following economic units:
- All establishments with total employment (TE) of 10 or more, and;
- All establishments with TE of less than 10, except those establishments with Legal Organization = 1 (single proprietorship) and Economic Organization = 1 (single establishment), that are engaged in economic activities classified according to the 2009 Philippine Standard Industrial Classification (PSIC).
Frame of Establishments
The frame for the 2016 ASPBI was extracted from the 2016 List of Establishments (LE). The estimated number of establishments in operation in the country in 2016 totaled to 902,213. About 294,494 establishments (32.6% of the total establishments) belong to the formal sector of which 255,403 (86.7%) comprised the frame of the survey. This frame was used to draw the sample establishments for the survey.
Unit of Enumeration
The unit of enumeration for the 2016 ASPBI is the establishment. An establishment is defined as an economic unit under a single ownership or control which engages in one or predominantly one kind of activity at a single fixed location.
Taxonomy of Establishments
An establishment is categorized by its economic organization, legal organization, industrial classification, employment size and geographic location.
Economic Organization refers to the organizational structure or role of the establishment in the organization. An establishment may be single establishment, branch, establishment and main office with branches elsewhere, main office only, and ancillary unit other than main office.
Legal Organization refers to the legal form of the economic entity which owns the establishment. An establishment may be single proprietorship, partnership, government corporation, stock corporation, non-stock corporation, and cooperative.
Industrial Classification of an economic unit was determined by the activity from which it derives its major income or revenue. The 2009 PSIC which was approved for adoption by government agencies and instrumentalities through PSA Resolution No. 1 Series 2017-158 signed on 14 February 2017 was utilized to classify economic units according to their economic activities.
Size of an establishment is determined by its total employment (TE) as of specific date. Total employment (TE) refers to the total number of persons who work in or for the establishment.
This includes paid employees, working owners, unpaid workers and all employees who work full-time or part-time including seasonal workers. Included also are persons on short term leave such as those on sick, vacation or annual leaves and on strike.
Geographic Classification refers to the grouping of establishments by geographic area using the Philippine Standard Geographic Code (PSGC) classification. The PSGC contains the latest updates on the official number of regions, provinces, cities, municipalities, and barangays in the Philippines. The PSGC as of 31 December 2016 was used for the 2016 ASPBI.
Sampling Design
The 2016 ASPBI uses a stratified systematic sampling with 5-digit PSIC serving as industry strata and employment size as the second stratification variable. The selection of sample establishments is done independently by stratum using systematic sampling.
Estimation Procedure for establishments with TE of Less Than 20.
a. Non-Certainty Stratum
The estimate of the total of a characteristic ![]() for the non-certainty employment stratum TE less than 20 in the sth industry domain was
for the non-certainty employment stratum TE less than 20 in the sth industry domain was
where:
s = denotes the non-certainty employment strata in TE of less than 20
Xsj = value of the jth establishment in the non-certainty employment stratum in TE of less than 20 in Sth industry domain
j = 1,2,3,..., ns establishments
Wsj = weight of the jth establishment in the non-certainty employment stratum in TE of less than 20 in Sth industry domain

Ns = total number of establishments in the non-certainty employment stratum in TE of less than 20 in Sth industry domain
ns = number of sample establishments in the non-certainty employment stratum in TE of less than 20 in Sth domain
b. Certainty Stratum

where:
c = denotes the certainty employment strata in TE of less than 20 in the cth industry
Xcj = value of the jth establishment in the certainty employment strata in TE of less than 20 in the cth industry domain
j = 1,2,3,..., mc establishments
mc = number of establishments in the certainty employment strata in TE of less than 20 in the cth industry domain
c. Total Estimate for TE of Less Than 20
For all sections except B and C, national level estimates of the total of a characteristic  for the industry domain was obtained by aggregating the estimates for all employment strata (non-certainty and certainty) in the same industry domain. That is,
where d denotes the industry domain.
Estimation Procedure for Establishments with TE of 20 and Over
a. Non-Certainty Stratum (strata of TE 20 to 49 and TE 50 to 99)
Sections A, C, E, F, G, H, I, J, K, L, M, N, P, Q, R and S.
The estimate of the total of a characteristic  for the non-certainty employment strata in an industry domain in each region,
where:
s = denotes the non-certainty employment strata in TE of 20 and over
p = 1, 2,..., 18 regions (geographic domains)
Xspj = value of the jthestablishment in the non-certainty employment strata in TE of 20 and over for an industry domain in each region
j = 1,2,3,..., nsp establishments
Wspj = weight of the jth establishment in the non-certainty employment strata with TE of 20 and over for an industry domain in each region
Nsp = total number of establishments in the non-certainty employment strata in TE of 20 and over for an industry domain in each region
nsp = number of sample establishments in the non-certainty employment strata in TE of 20 and over for an for an industry domain in each region
b. Certainty Stratum (Establishments under the following: Section B and D, ICT core industries except J61902, Business Process Management (BPM), Government Owned and Controlled Corporations (GOCCs) and with TE 100 and over)
 for the certainty employment stratum in an industry domain in each region
where:
c = denotes the certainty employment strata in TE of 20 and over
p = 1,2,...18 regions (geographic domains)
Xcpj = value of the jth establishment in the certainty employment strata in TE of 20 and over for an industry domain in each region
j = 1,2,3,..., mcp establishments
mcp = number of establishments in the certainty employment strata in TE of 20 and over in an industry domain within each region
c. Total Estimate for TE of 20 and Over
The estimate of the total of a characteristic  for the industry domain in each region (geopraphic domain) is obtained by aggregating the estimates for all employment strata (non-certainty and certainty) in the same industry domain,
where d denotes the industry domains and p refers to region.
National level estimate of the characteristic by industry domain are obtained by aggregating separately the estimates  for the particular industry domain from all the regions.
Weight Adjusment Factor for Non-Response
To account for non-response in the non-certainty strata, the adjusment factor (n/n') was multipled with the sampling weight (W) of each of the sampling unit. The sampling weight, defined as N/n, was recomputed as
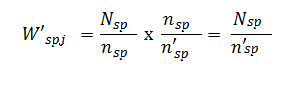
Thus, the adjusted weight (W'spj) for the non-certainty employment stratum for the industry domain with TE 20-99 was
where:
Nsp = total number of establishments in the non-certainty employment stratum with TE 20-99 for the industry domain within each geographic domain (region)
n'sp = number of responding establishments in the non-certainty employment stratum with TE of 20-99 for the industry domain within each geographic domain (region)
Response Rate
Response rate for all sample establishments under Transportation and Storage sector was 91.27 percent (930 out of 1,019 establishments). This included receipts of "good" questionnaires, partially accomplished questionnaires, reports of closed, moved out or out of scope establishments.
Of the total responses, 30 establishments responded online.
Reports of the remaining non-reporting establishments were taken from other available administrative data sources and financial statements from Securities and Exchange Commission (SEC). However, there were establishments which were found to be duplicates, out-of-scope and out of business in 2016.
Limitation of Data
The survey covers only the formal sector of the economy.
Concepts and Definitions of Terms
Establishment is an economic unit under a single ownership and control, i. e. under a single entity, engaged in one or predominantly one kind of economic activity at a single fixed location.
Economic activity is the establishment’s source of income. If the establishment is engaged in several activities, its main economic activity is that which earns the biggest income or revenue.
Total employment is the number of persons who worked in or for the establishment as of 15 November 2016.
Paid employees are all persons working in the establishment and receiving pay, as well as those working away from the establishment paid by and under the control of the establishment. Included are all employees on sick leave, paid vacation or holiday. Excluded are consultants, home workers, receiving pure commissions only, and workers on indefinite leave.
Compensation is the sum of salaries and wages, separation/retirement/terminal pay, gratuities, and payments made by the employer in behalf of the employees such as contribution to SSS/GSIS, ECC, PhilHealth, Pag-ibig, etc.
Salaries and wages are payments in cash or in kind to all employees, prior to deductions for employee’s contributions to SSS/GSIS, withholding tax, etc. Included are total basic pay, overtime pay and other benefits.
Income or Revenue refers to cash received and receivables for goods/products and by-products sold and services rendered. Valuation is at producer prices (ex-establishment) net of discounts and allowances, including duties and taxes but excluding subsidies.
E-commerce refers to the selling of products or services over electronic systems such as Internet Protocol-based networks and other computer networks. Electronic Data Interchange (EDI) network, or other on-line system. Excluded are orders received from telephone, facsimile and e-mails.
Expense refers to cost incurred by the establishment during the year whether paid or payable. This is treated on a consumed basis. Valuation is at purchaser price including taxes and other charges, net of rebates, returns and allowances. Goods and services received by the establishment from other establishments of the same enterprise are valued as though purchased.
Value added is gross output less intermediate input. Gross output for Transportation and Storage sector is the sum of the total income (less interest income, rent income from land, dividend income, royalty income and franchise income), capital expenditures of fixed assets produced on own account and change in inventories. Intermediate input is equal to the sum of the following expense items: materials and supplies purchased; fuels, lubricants, oils and greases purchased; electricity purchased, water purchased; industrial services done by others; non-industrial services done by others (less rent expense for land); goods purchased for resale; research and development expense; environmental protection expense; royalty fee; franchise fee; payouts; and other expense.
Change in inventories is equivalent to the value of inventories at the end of the year less the value of inventories at the beginning of the year.
Inventories are stock of goods owned by and under the control of the establishment as of a fixed date, regardless of where the stocks are located. Valuation is at current replacement cost in purchaser prices. Replacement cost is the cost of an item in terms of its present price rather than its original cost.
See more at the Annual Survey of Philippine Business and Industry (ASPBI) page.
| Attachment | Size |
|---|---|
|
|
30.01 KB |
|
|
18.49 KB |