
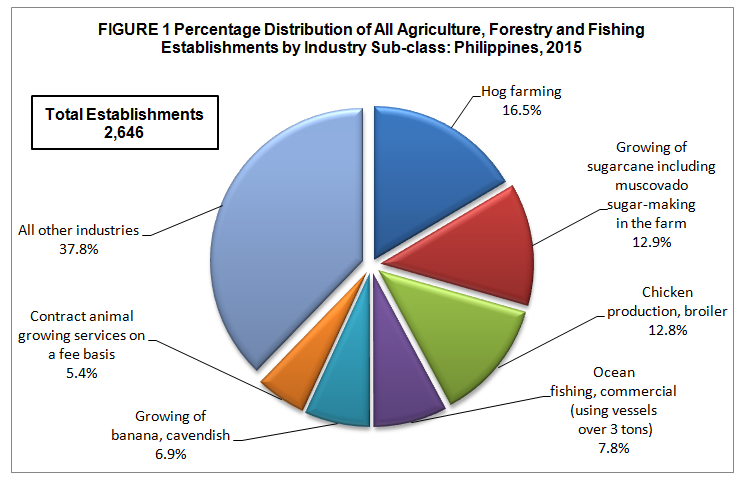
Hog farming industry dominates the sector in terms of number of establishments
The final results of the 2015 Annual Survey of Philippine Business and Industry (ASPBI) showed that there were 2,646 establishments engaged in agriculture, forestry and fishing in the formal sector of the economy.
Among the industry sub-classes, hog farming recorded the highest number with 437 establishments, accounting for 16.5 percent of the total number of establishments. Growing of sugarcane including muscovado sugar-making in the farm ranked second with 341 establishments or 12.9 percent, followed by chicken broiler production with 338 establishments (12.8%).
Other industries with more than a hundred in number of establishments are as follows:
- Ocean fishing, commercial (using vessels over 3 tons), 206 establishments (7.8%)
- Growing of banana, cavendish, 183 establishments (6.9%)
- Contract animal growing services on a fee basis, 142 establishments (5.4%)
- Chicken egg production, 125 establishments (4.7%)
Figure 1 displays the percentage distribution of all agriculture, forestry and fishing establishments by industry sub-class in 2015.
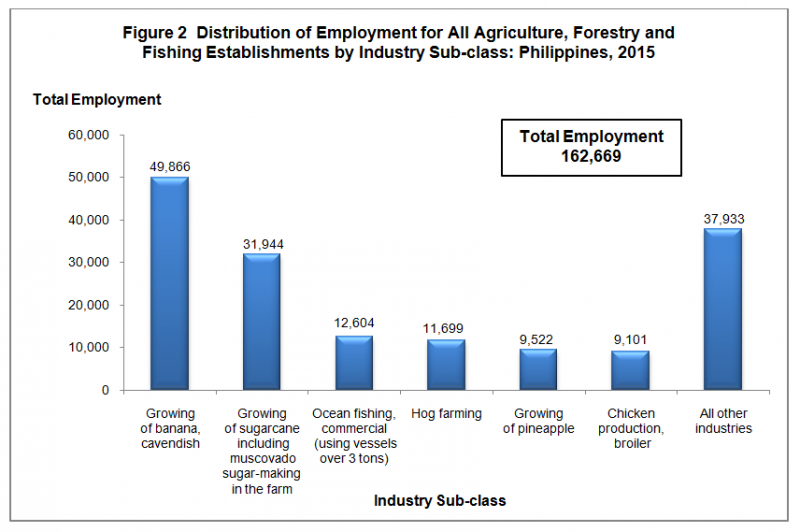
Growing of cavendish banana industry generates the highest employment
Total employment generated for all agriculture, forestry and fishing establishments reached 162,669 in 2015. Of the total workforce, 159,889 workers or 98.3 percent were paid employees while the remaining 1.7 percent were working owners and unpaid workers.
At the industry level, growing of cavendish banana had the highest number of employees with 49,866 or 30.7 percent of the total. This was followed by growing of sugarcane including muscovado sugar-making in the farm with 31,944 workers or 19.6 percent while commercial ocean fishing ranked third with 12,604 workers or 7.7 percent share.
Figure 2 shows the distribution of employment for all agriculture, forestry and fishing establishments by industry sub-class in 2015.
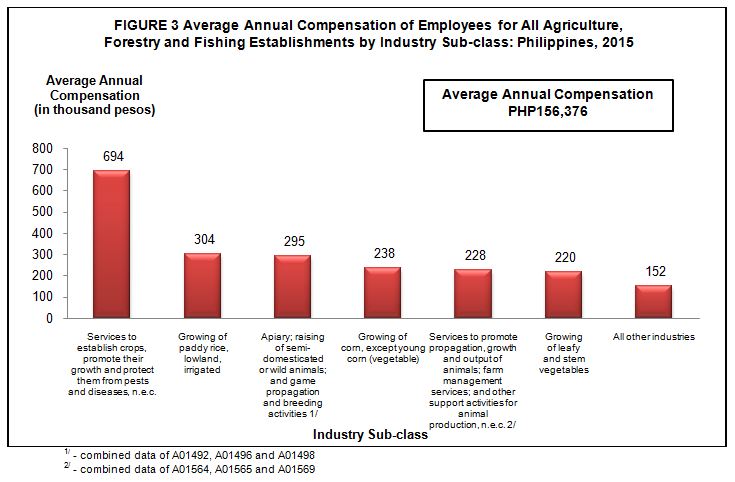
Growing of cavendish banana industry pays the highest average annual compensation
Total compensation paid by the sector to its employees in 2015 amounted to PHP25.0 billion, translating to an average annual compensation of PHP156,376 per employee.
By industry sub-class, growing of cavendish banana paid the highest compensation of PHP10.5 billion (42.1%). Growing of sugarcane including muscovado sugar-making in the farm placed as second with PHP2.2 billion (8.7%). Commercial ocean fishing activities ranked third with PHP1.8 billion (7.3%).
Meanwhile, services to establish crops, promote their growth and protect them from pests and diseases, n.e.c. industry paid the highest average annual compensation amounting to PHP694,345 per employee. This was followed by growing of paddy rice in lowland irrigated farm with PHP303,849 annual pay. The combined industries of apiary; raising of semi-domesticated or wild animals; game propagation and breeding activities came in third with annual pay of PHP294,974 per employee.
Completing the top six industries in terms of average annual compensation are as follows:
- Growing of corn, except young corn (vegetable), PHP238,297 per employee
- Services to promote propagation, growth and output of animals; farm management services; and other support activities for animal production, n.e.c., PHP227,766 per employee
- Growing of leafy and stem vegetables, PHP219,966 per employee
Figure 3 shows the average annual compensation of employees for all agriculture, forestry and fishing establishments by industry sub-class in 2015.
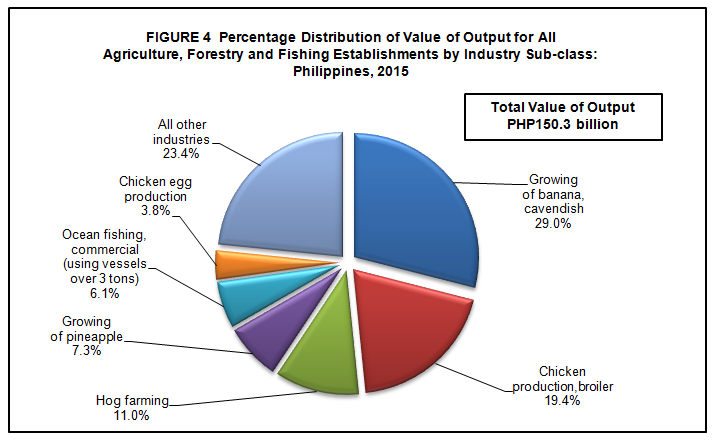
Growing of cavendish banana industry generates highest value of output
Total value of output generated by all agriculture, forestry and fishing establishments reached PHP150.3 billion in 2015.
At the industry level, growing of cavendish banana contributed the highest output value of PHP43.6 billion or 29.0 percent. Chicken broiler production and hog farming placed second and third posts with output values of PHP29.2 billion (19.4%) and PHP16.5 billion (11.0%), respectively.
Figure 4 illustrates the percentage distribution of value of output for all agriculture, forestry and fishing establishments by industry sub-class in 2015.
Growing of cavendish banana industry incurs the highest expense
In 2015, total expense including compensation, incurred by all agriculture, forestry and fishing establishments amounted to PHP150.2 billion.
Among industries, growing of cavendish banana spent the highest amounting to PHP44.1 billion or 29.4 percent of the total. Chicken broiler production ranked second with total expense amounting to 28.3 billion (18.8%), followed by hog farming with PHP15.5 billion (10.3%).
Income per expense ratio for the sector stands at 1.02
The sector generated an income per expense ratio of 1.02 in 2015. This means that for every peso spent, a corresponding income of PHP1.02 was generated.
At the industry level, growing of corn, except young corn (vegetable) recorded the highest income per expense ratio of 1.51 among the top ten industries, followed by growing of timber forest species, planting, replanting, transplanting, thinning and conserving of forest and timber tracts with 1.45.
Completing the top ten industries in terms of income per expense ratio are the following:
Growing of coconut, including copra-making, tuba gathering and coco-shell charcoal making in the farm, 1.25
Growing of oleaginous fruits except coconut, 1.23
Growing of paddy rice, lowland, irrigated, 1.21
Dairy farming, 1.21
Pearl culture, 1.19
Operation of irrigation systems through cooperatives, 1.16
Egg hatching, sex determination and other poultry services, 1.14
Growing of fruit bearing vegetables, 1.10
Value added amounts to PHP37.0 billion in 2015
Total value added produced by all agriculture, forestry and fishing establishments in 2015 was estimated at PHP37.0 billion.
Among industry sub-classes, growing of cavendish banana generated the highest value added amounting to PHP12.7 billion or 34.2 percent of the total. Commercial ocean fishing came in second with PHP3.7 billion (10.1%) followed by chicken broiler production with PHP3.3 billion (8.9%).
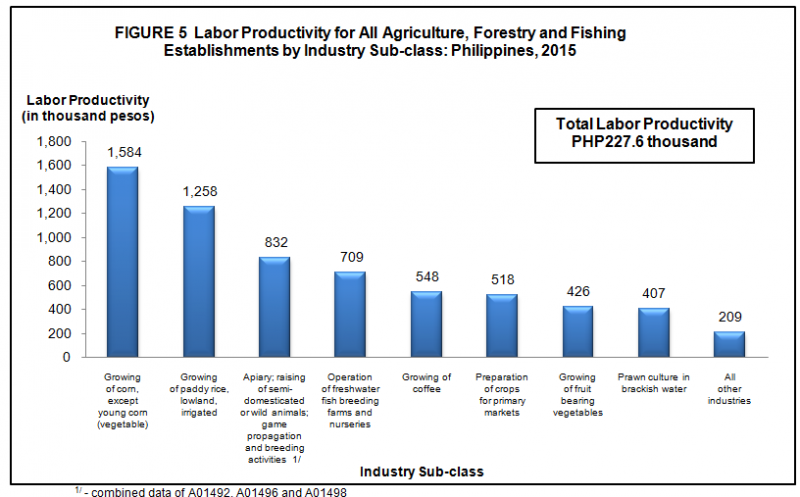
Growing of corn, except young corn (vegetable) industry posts the highest labor productivity
The ratio of value added to employment, a measure of labor productivity, was recorded at PHP227,632 per worker in 2015.
Growing of corn, except young corn (vegetable) generated a labor productivity of PHP1.6 million per worker, the highest among industries. This was followed by growing of paddy rice in lowland, irrigated farm with PHP1.3 million per worker. The combined value added per worker of apiary; raising of semi-domesticated or wild animals; and game propagation and breeding activities came in third with PHP831,709 per worker.
Other leading industries in terms of labor productivity are shown below.
Operation of freshwater fish breeding farms and nurseries, PHP709,112 per worker
Growing of coffee, PHP547,718 per worker
Preparation of crops for primary markets, PHP517,546 per worker
Growing of fruit bearing vegetables, PHP425,908 per worker
Prawn culture in brackish water, PHP407,443 per worker
Figure 5 displays the labor productivity for all agriculture, forestry and fishing establishments by industry sub-class in 2015.
Gross addition to tangible fixed assets reaches PHP8.3 billion
Gross addition to tangible fixed assets acquired by all agriculture, forestry and fishing establishments was valued at PHP8.3 billion in 2015.
Among industry sub-classes, growing of cavendish banana contributed the highest gross addition to tangible fixed assets at PHP1.9 billion or 23.2 percent of the total. This was followed by commercial ocean fishing with PHP1.3 billion or 16.1 percent of the total. Hog farming ranked third with PHP816 thousand or 9.8 percent of the total.
Total subsidy received amounts to PHP3.1 billion in 2015
Subsidy granted by the government to support the business operation of all agriculture, forestry and fishing establishments in 2015 amounted to PHP3.1 billion.
Among industries, only seven received government subsidy in 2015 with services to establish crops, promote their growth and protect them from pests and diseases, n.e.c. receiving the highest subsidy amounting to PHP2.9 billion or 94.2 percent of the total. This was followed by growing of paddy rice in lowland irrigated farm receiving a total subsidy of PHP28 thousand or less than one percent share of the total.
TECHNICAL NOTES
This Special Release presents the final results of the 2015 Annual Survey of Philippine Business (ASPBI) and Industry for all agriculture, forestry and fishing (Sector A) establishments.
The 2015 ASPBI is one of the designated statistical activities of the Philippine Statistics Authority (PSA). Data collected from the survey provide information on the levels, structure, performance and trends of economic activities of the formal sector in the entire country. The 2015 Survey on Information and Communications Technology (SICT) was undertaken as a rider to this survey.
The survey was conducted nationwide in 2016 with the year 2015 as the reference period of data, except for employment which is as of November 15, 2015.
Establishment Data Management System (EDMS) was still utilized in the decentralized processing of 2015 ASPBI questionnaires in the province as well as the online accomplishment of questionnaire through PSA website.
Data are presented at the national sub-class or 5-digit 2009 Philippine Standard Industrial Classification (PSIC).
Legal Authority
The conduct of the 2015 ASPBI is authorized under Republic Act No. 10625 known as the Philippine Statistical Act of 2013 - Reorganizing and strengthening of the Philippine Statistical System (PSS), its agencies and instrumentalities.
Scope and Coverage
The 2015 ASPBI covered establishments engaged in 18 economic sectors classified under the 2009 PSIC, namely:
- Agriculture, Forestry, and Fishing (A)
- Mining and Quarrying (B)
- Manufacturing (C)
- Electricity, Gas, Steam, and Air Conditioning Supply (D)
- Water Supply; Sewerage, Waste Management and Remediation Activities (E)
- Construction (F)
- Wholesale and Retail Trade; Repair of Motor Vehicles and Motorcycles (G)
- Transportation and Storage (H)
- Accommodation and Food Service Activities (I)
- Information and Communication (J)
- Financial and Insurance Activities (K)
- Real Estate Activities (L)
- Professional, Scientific and Technical Activities (M)
- Administrative and Support Service Activities (N)
- Education (P)
- Human Health and Social Work Activities (Q)
- Arts, Entertainment, and Recreation (R)
- Other Service Activities (S)
The following sections of the 2009 PSIC are excluded from the scope of this survey and all other establishment-based surveys of PSA:
- Public Administration and Defense; Compulsory Social Security (Section O)
- Activities of Households as Employers; Undifferentiated Goods and Services Producing Activities of Households for Own Use (Section T)
- Activities of Extra-territorial Organization and Bodies (Section U)
The survey was confined to the formal sector of the economy, which consists of the following:
- Corporations and partnership
- Cooperatives and foundations
- Single proprietorship with employment of 10 and over
- Single proprietorships with branches
Hence, the 2015 ASPBI covered only the following economic units:
- All establishments with total employment of 10 and over; and
- All establishments with total employment of less than 10, except those with Legal Organization = 1 (Single proprietorship) and Economic Organization = 1 (Single establishments), that are engaged in economic activities described according to the 2009 PSIC.
Frame of Establishments
The frame for the 2015 ASPBI was extracted from the 2015 List of Establishments (LE). The estimated number of establishments in operation in the country in 2015 totaled to 909,786. About 259,386 establishments (29.0% of the total establishments) belong to the formal sector of which 223,821 (86.3%) comprised the establishment frame. This frame was used to draw the sample establishments for the survey.
Unit of Enumeration
The unit of enumeration for the 2015 ASPBI is the establishment. An establishment is defined as an economic unit under a single ownership or control which engages in one or predominantly one kind of activity at a single fixed location.
Classification of Establishments
An establishment is categorized by its economic organization, legal organization, industrial classification, employment size, and geographic location.
Economic Organization refers to the organizational structure or role of the establishment in the organization. An establishment may be single establishment, branch, establishment and main office with branches elsewhere, main office only, and ancillary unit other than main office.
Legal Organization refers to the legal form of the economic entity which owns the establishment. An establishment may be single proprietorship, partnership, government corporation, stock corporation, non-stock corporation, and cooperative.
Industrial classification of an economic unit was determined by the activity from which it derives its major income or revenue. The 2009 PSIC was utilized to classify economic units according to their economic activities.
Size of an establishment is determined by its total employment (TE) as of a specific date.
Geographic Classification refers to the classification by geographic area using the Philippine Standard Geographic Code (PSGC) classification. The PSGC contains the latest updates on the official number of regions, provinces, cities, municipalities, and barangays in the Philippines. The PSGC as of December 31, 2015 was used for the 2015 ASPBI.
Methodology
Sampling Design
The 2015 ASPBI used stratified systematic sampling with 5-digit PSIC serving as first stratification variable and employment size as the second stratification variable.
Estimation Procedure
- Non-Certainty Stratum (strata of TE 20 to 49 and TE 50 to 99)
The estimate of the total of a characteristic ![]() for the non-certainty employment strata in an industry domain in each region,
for the non-certainty employment strata in an industry domain in each region,

where:
s denotes the non-certainty employment strata in TE of 20 to 99
p = 1, 2,..., 18 regions (geographic domains)
xspj= value of the jth establishment in the non-certainty employment strata in TE of 20 to 99 for an industry domain in each region
j = 1, 2, 3,…,nspestablishments
![]() = weight of thejthestablishment in the non-certainty employment strata in TE of 20 to 99 for an industry domain in each region
= weight of thejthestablishment in the non-certainty employment strata in TE of 20 to 99 for an industry domain in each region

Nsp = total number of establishments in the non-certainty employment strata in TE of 20 to 99 for an industry domain in each region
nsp = number of sample establishments in the non-certainty employment strata in TE of 20 to 99 for an industry domain in each region
- Certainty Stratum (TE 100 and over)
The value of the total of a characteristic  for the certainty employment stratum in an industry domain in each region,

where:
c denotes the certainty employment strata of TE 100 and over
p = 1, 2,..., 17 regions (geographic domains)
xcpj= value of the jth establishment in the certainty employment strata in TE 100 and over in an industry domain within each region
j = 1, 2, 3, …,mcp establishments
mcp= number of establishments in the certainty employment strata in TE 100 and over in an industry domain within each region
- Total Estimate for TE of 20 and Over
The estimate of the total of a characteristic  for the industry domain in each region (geographic domain) was obtained by aggregating the estimates for all employment strata (non-certainty and certainty) in the same industry domain,

Where dp denotes the industry domains in each region.
National level estimates of the characteristics by industry domain were obtained by aggregating separately the estimates  for the particular industry domain from all the regions.
National 
For Establishments with TE of Less Than 20
- Non-Certainty Stratum
The estimate of the total of a characteristic ![]() for the non-certainty employment stratum TE less than 20 in the sth industry domain was
for the non-certainty employment stratum TE less than 20 in the sth industry domain was

where:
s = denotes the non-certainty employment strata in TE of less than 20
Xsj = value of the jth establishment in non-certainty employment stratum in TE of less than 20 in Sth industry domain
j = 1,2,3..., ns establishments
Wsj = weight of the jth establishment in the non-certainty employment stratum of less than 20 in the sth industry domain

Ns = total number of establishments in the non-certainty employment stratum in TE of less than 20 in the sth industry domain
ns = number of sample establishments in the non-certainty employment stratum in TE of less than 20 in sth domain
Weight Adjustment Factor for Non-Response
To account for non-response in the non-certainty strata, the adjustment factor (n/n’) was multiplied with the sampling weight (W) of each of the sampling unit. The sampling weight, defined as N/n, was recomputed as

Thus, the adjusted weight (W’sj) for employment stratum in TE 1-9 or TE 10-19 was

where:
Ns= total number of establisments in the employment stratum in TE 1-9 or TE 10-19 in the sth industry domain
n's = number of responding establishments in the employment stratum in TE 1-9 or TE 10-19 in the sth industry domain
For the non-certainty employment stratum for the selected industry domain with TE 20-99, the adjusted weight (W'spj) was

where:
Nsp = total number of establisments in the non-certainty employment stratum with TE 20-99 for the selected industry domain within each geographic domain (region)
n'sp = number of responding establishments in the non-certainty employment stratum with TE 20-99 for the selected industry domain within each geographic domain (region)
Response Rate
Response rate for all Agriculture, Forestry and Fishing sector was 95.1 percent (1,014 out of 1,066 establishments). This included receipts of "good" questionnaires, partially accomplished questionnaires, reports of closed, moved out or out of scope establishments.
Of the total responses, 16 establishments responded online
Reports of the remaining non-reporting establishments were imputed based on established imputation methods and from other available administrative data sources and financial statements from Securities and Exchange Commission (SEC). However, reports of establishments which were found to be duplicates and out of business in 2015, were not imputed.
Limitation of Data
The 2015 ASPBI covered only the formal sector of the economy.
Concepts and Definitions of Terms
Economic activity is the establishment’s source of income. If the establishment is engaged in several activities, its main economic activity is that which earns the biggest income or revenue.
Total employment is the number of persons who worked in for the establishment as of November 15, 2015.
Paid employees are all persons working in the establishment and receiving pay, as well as those working away from the establishment paid by and under the control of the establishment. Included are all employees on sick leave, paid vacation or holiday. Excluded are consultants, home workers, receiving pure commissions only, and workers on indefinite leave.
Income or Revenue refers to cash received and receivables for goods/products and by-products sold and services rendered.
Expense refers to cost incurred in an enterprise effort to generate revenue, representing the cost of doing business. This is treated on a consumed basis. It excludes cost incurred in the acquisition of income generating assets.
Compensation is the sum of salaries and wages, separation/retirement/terminal pay, gratuities, and payments made by the employer in behalf of the employees such as contribution to SSS/GSIS, ECC, PhilHealth, Pag-ibig, etc.
Salaries and wages are payments in cash or in kind to all employees, prior to deductions for employee’s contributions to SSS/GSIS, withholding tax, etc. Included are total basic pay, overtime pay and other benefits.
Value of output represents the sum of the receipts from products and by-products sold, agricultural/forestry/fishery services rendered, industrial services, and goods sold in the same condition as purchased less the cost of goods sold; and value of fixed assets produced on own account and change in inventories of finished products and work-in-progress.
Intermediate expense are expenditures incurred in the production of goods such as materials and supplies used, fuels, lubricants, oils and greases used; electricity and water purchased, agricultural/forestry/fishery and industrial services done by others.
Value added is gross output less intermediate input. Gross output for the agriculture, forestry and fishing sector is value of output non-industrial services done for others (except rent income from land). Intermediate input is intermediate expenses plus non-industrial services done by others (except rent expense for land) and all other expenses.
Gross addition to tangible fixed assets is equal to capital expenditures less sale of fixed assets, including land.
Change in inventories is equivalent to the value of inventories at the end of the year less the value of inventories at the beginning of the year.
Inventories refer to the stock of goods owned by and under the control of the establishment as of a fixed date, regardless of where the stocks are located. Valuation is at current replacement cost in purchaser prices. Replacement cost is the cost of an item in terms of its present price rather than its original cost.
Subsidies are all special grants in the form of financial assistance or tax exemption or tax privilege given by the government to aid and develop an industry.
E-commerce refers to the selling of products or services over electronic systems such as Internet Protocol-based networks and other computer networks. Electronic Data Interchange (EDI) network, or other on-line system. Excluded are orders received from telephone, facsimile and e-mails.
ROMEO S. RECIDE